Creative Education
Vol.09 No.08(2018), Article ID:85698,16 pages
10.4236/ce.2018.98089
Development of a Novel Multimedia E-Learning Tool for Teaching the Symptoms and Signs of Stroke
Jonathan Birns1,2*, Peter Woodward3, Harry Brenton3, Fernando Bello3
1Department of Ageing & Health, St Thomas Hospital, London, UK
2School of Medicine, Health Education England, London, UK
3Centre for Engagement & Simulation Science, Department of Surgery & Cancer, Imperial College, London, UK

Copyright © 2018 by authors and Scientific Research Publishing Inc.
This work is licensed under the Creative Commons Attribution International License (CC BY 4.0).
http://creativecommons.org/licenses/by/4.0/


Received: April 16, 2018; Accepted: June 26, 2018; Published: June 29, 2018
ABSTRACT
A novel, scenario-based, curriculum-mapped, multimedia stroke e-learning tool was developed by a multi-professional project team incorporating experts in stroke, education and virtual reality and human computer interaction. Resource acquisition and generation involved capturing of “real-time, real-life” patient data, including video and audio recordings, and the creation of a digital stroke taxonomy classifying the symptoms and signs of stroke. A number of approaches were explored for visually demonstrating the effects of functional impairment in stroke patients using animations and juxtaposing brain imaging scans and 3D models. An iterative, evolutionary, action research approach was employed to build the e-learning tool around an array of acute neurological scenarios of stroke and stroke-mimic presentations. Each scenario followed a standardised teaching process aligned to the “patient journey”. Evaluation helped to focus on how successful different interface elements reinforced the underlying development design strands.
Keywords:
Stroke, E-Learning, Iterative Development, Content Navigation, Taxonomy

1. Introduction
Stroke is the third leading cause of death in the United States, and it is the leading cause of adult disability in the United States and Europe. It is defined as a sudden onset of focal neurological deficit, lasting more than 24 hours, due to disruption of blood supply to the brain. Approximately 15% of strokes are haemorrhagic (involving bleeding within the brain secondary to arterial rupture) and 85% are ischaemic (involving arterial occlusion). National clinical guidelines emphasise the need to establish acute stroke as a clinical priority requiring early specialist assessment and treatment [http://www.rcplondon.ac.uk/sites/default/files/national-clinical-guidelines-for-stroke-fourth-edition.pdf] . Management on a specialised acute stroke unit from the time of admission results in 19% more patients being alive and independent at 1 year [Kalra et al., 2000, Evans et al., 2001] and “clot-busting” treatment for ischaemic stroke with thrombolysis within 3 hours of stroke onset results in 30% more patients being alive and independent at 3 months [National Institute of Neurological Disorders and Stroke rt-PA Stroke Study Group, 1995] . There has thus been increasing recognition of the importance of timely medical attention in acute stroke management [Stone, 2002, Harbison et al., 2003, Nor et al., 2005] to facilitate early correct diagnosis in addition to planning treatment strategies aimed at reducing the brain damage caused by the stroke, and preventing complications. Centralisation of acute stroke care with the capacity for immediate brain imaging and thrombolysis (when appropriate) in hyperacute stroke units (HASUs) has been shown to provide cost-effective improvements in patient outcomes [Morris et al., 2014, Hunter et al. 2013] . To support the effectiveness of such processes of care, a need for training increased numbers of specialist medical, nursing and allied health care professional staff recruited to HASUs has been identified.
The knowledge, understanding and competencies required by stroke health care professionals are specified by the Department of Health Stroke Specific Educational Framework (SSEF) [http://webarchive.nationalarchives.gov.uk/20110929220218/http://www.dh.gov.uk/prod_consum_dh/groups/dh_digitalassets/@dh/@en/@ps/@sta/@perf/documents/digitalasset/dh_116343.pdf] . Different instructional formats are suited to different types of stroke learning. For example, physical simulations using mannequins and actors allow learners to practise technical and communication skills and multimedia educational tools can visually demonstrate the causal relationships between form (anatomy), function (physiology) and dysfunction (pathology) in the brain [Kassab et al., 2012, Brenton, 2011] . A multidisciplinary working party comprising stroke health care professionals (from medical, nursing and therapy backgrounds) and educationalists identified 39 of the 72 curricular elements of the SSEF as learning outcomes most appropriate to embed within a multimedia e-learning modality [Woodward et al., 2013] . This paper describes the development of a novel multimedia e-learning tool framed around the aforementioned sections of the SSEF dealing with the understanding of the presenting symptoms and signs of different types of stroke; this being crucial for correct diagnostic and management plans being instituted for patients on HASUs.
2. Methods
A multi-professional project team incorporating stroke physicians, educationalists and academics with expertise in virtual reality and human computer interaction was convened to establish the following key requirements for a multimedia e-learning tool for improving the understanding of stroke symptoms and signs by clinicians working on HASUs:
1) Focus on and visually explain stroke care pathways (stages of assessment and treatment for stroke patients) taking care to correlate between training elements and National Stroke Strategy markers of high quality care [http://webarchive.nationalarchives.gov.uk/20110929220218/http://www.dh.gov.uk/prod_consum_dh/groups/dh_digitalassets/@dh/@en/@ps/@sta/@perf/documents/digitalasset/dh_116343.pdf, R07 ].
2) Focus on and visually explain the inter-relationships in the stroke triad of cerebrovascular anatomy and physiology, cerebral function, and cerebral dysfunction emphasising the presenting symptoms and signs of a stroke [Testani-Dufour et al., 1997] .
3) Classify symptoms and signs of stroke using an appropriate digital taxonomy.
4) Facilitate confident diagnosis of stroke and stroke mimics.
5) Emphasise the importance of “door to needle” time (the time from a patient entering the emergency department in a HASU to receiving thrombolysis (clot-busting) treatment (via injection) for acute ischaemic stroke).
The project team reviewed existing multimedia learning resources for stroke that included Stroke4Carers (http://www.stroke4carers.org/) and STARS (Stroke Training and Awareness Resources (http://www.strokecorecompetencies.org/) that explained the symptoms and signs of stroke using videos of patients and 2D and 3D animations, and used multiple choice questions for formative assessment. Such resources were noted to be structured according to the effects of stroke such as impaired vision, communication and swallowing. For this new learning tool to be closely aligned with the competencies from the SSEF framework, the quality assurance standards underpinning the operational activities of a HASU and the widely known “FAST” (face, arms, speech, time) stroke public information campaign [Harbison et al., 2003, http://www.nhs.uk/actfast/Pages/stroke.aspx] , the project team aimed to base it around “real-time, real-life” case study scenarios [http://www.rcplondon.ac.uk/sites/default/files/national-clinical-guidelines-for-stroke-fourth-edition.pdf, http://clahrc-gm.nihr.ac.uk/wp-content/uploads/DoH-National-Stroke-Strategy-2007.pdf, National Institute for Health and Care Excellence, 2008] .
2.1. Resource Acquisition and Generation
Patients were recruited from HASUs in two London university teaching hospitals according to a standardised protocol over a three month period as follows: Patients presenting to the HASU were observed and filmed whilst having a standardised neurological examination that identified the severity of their stroke [http://www.ninds.nih.gov/disorders/stroke/strokescales.htm] . The position of the camera was pre-arranged before filming in order to minimise disruption and the camera operator (PW) agreed to remain stationary and follow any instructions from staff. Relevant documents were collected for each patient, including clinical records and laboratory results. Brain imaging scans of patients were stored digitally from HASU Picture Archiving and Communications Systems. Audio recordings of patient interactions with health care professionals were also undertaken. Written consent was retrospectively sought from participants or their next of kin/carer/patient advocate after initial presentation but before discharge from the HASU. Participants were free to withdraw at any point and filming was immediately ceased if any actions from the patient or carer indicated noncompliance. All filmed, printed and digital data were anonymised and stored on a secure server. Ethical approval was obtained for video and audio-recording patients admitted via the stroke care pathway and accessing and collecting all relevant clinical information (National Research Ethics Service Camden and Islington Committee Reference 11/LO/1348).
To complement the patient-specific resources, we used off-the-shelf commercial 3D anatomical models (http://www.3dscience.com/) to create animated 3D models of the brain and its blood supply. Poser and Maya (https://my.smithmicro.com/; https://www.autodesk.co.uk/products/maya/overview) were used to create animated virtual patients who had suffered a stroke (Figure 1).
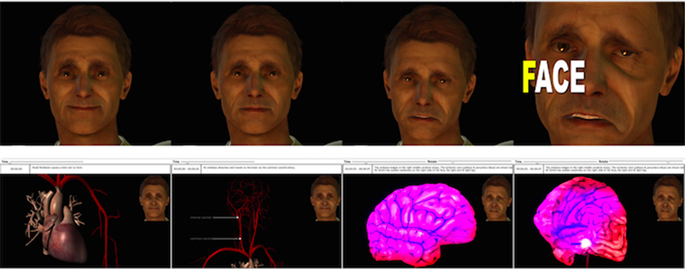
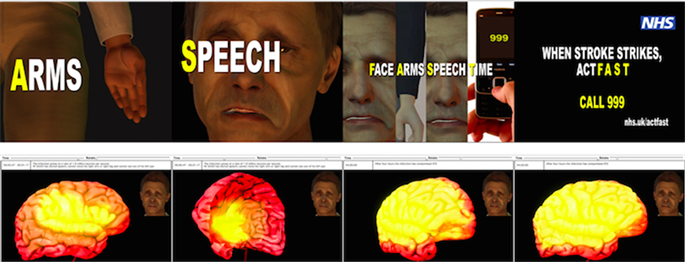
Figure 1. 3D animations of a virtual patient linking the FAST (face, arms, speech, time) stroke public information campaign and the relevant cerebrovascular anatomical and physiological abnormalities accounting for the presenting acute symptoms and signs of stroke-related facial and arm weakness and speech deficit.
2.2. Digital Stroke Taxonomy
Strokes may be haemorrhagic or ischaemic in aetiology and ischaemic strokes have been further classified by the Oxfordshire Community Stroke Project (OCSP), based on clinical and anatomical features, into total anterior circulation infarction, partial anterior circulation infarction, lacunar infarction (confined to the territory of the deep perforating arteries), and posterior circulation infarction [Bamford et al., 1991] . Using the eXtensible Markup Language (XML) we developed a programmatic taxonomy, based on the OCSP classification, to store data about stroke symptoms, signs and test results to structure pathologies and impairments of stroke according to information available from when a patient was assessed.
2.3. Iterative Development
An iterative, evolutionary, action research approach was employed involving successive prototypes being tested and then refined following feedback from HASU staff and various workshops and conferences [Woodward et al., 2013, Noffke & Somekh, 2009, Woodward et al., 2011] .
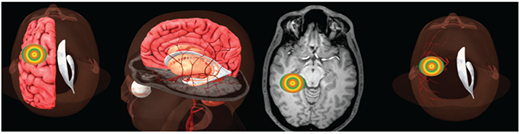
Stroke scenarios were created using Adobe Flash and coded using Actionscript. Flash was deemed to be the best compromise for both delivering multimedia content such as video and 3D animations and ensuring compatibility with online healthcare professional communications networks. Early non-interactive prototypes initially developed (Figure 2(a)) acted as sketches to experiment with different layouts and modes of presentation [Buxton, 2007] . We experimented with several approaches to convey the relationships within the stroke triad, for example juxtaposing CT (computed tomography) brain scans with 3D models of the brain (Figure 3(a)), employing animations showing the regions of the brain damaged by blockages to blood vessels (Figure 3(b)) and using semi-transparent virtual patients showing impairments caused by different types of stroke (Figure 3(c)).
2.3.1. Content Navigation
A crucial aspect of the design process is choosing how to present and navigate content. Our initial design consisted of a matrix of stroke symptoms and signs (Figure 2(a)) reflecting the digital stroke taxonomy created. Initial prototypes added multimedia content by embedding audio and video recordings and various types of test results, including brain imaging, as hyperlinks (Figure 2(c) and Figure 2(d)). Other interactivity included 3D brain models that allowed a user to select and view the blood supply provided by different arteries. Where relevant, we aligned the content to other online stroke resources [https://www.nhs.uk/actfast/Pages/stroke.aspx] .
The matrix presentation was judged to be a compact and concise way to compare and contrast a range of stroke symptoms and signs. However, clinicians suggested that it would be too dense and might intimidate novices with low prior knowledge about strokes, and recommended concentrating on patient
 (a)
(a)
 (b)
(b)
 (c)
(c)
 (d)
(d)
Figure 2. Multimedia e-learning tool prototypes: (a) Early non-interactive prototype; (b) “Tramline” interface interactive prototype; (c) and (d) Clockface navigation interactive prototype.
 (a)
(a)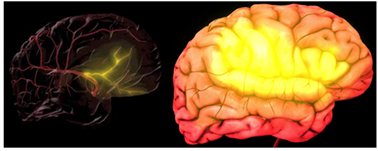 (b)
(b)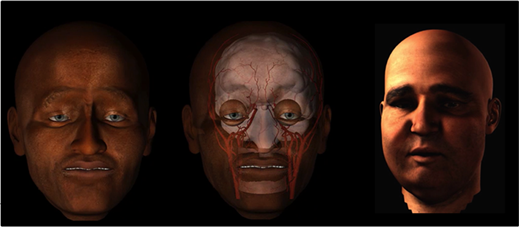 (c)
(c)
Figure 3. Approaches to convey the relationships within the stroke triad: (a) Locating a haemorrhage in the middle cerebral artery territory in CT and 3D models; (b) Animations showing the region affected by a haemorrhage; (c) Integrating visible symptoms and pathology on virtual patients.
stories or scenarios; that being a well-established process in medical education [Prince, 2004] . As such, we abandoned the data matrix in favour of a scenario-based design showing a care pathway for a named individual from symptom onset through to hospital admission and diagnosis.
Clinicians must answer three key questions when they assess a patient that has presented with a suspected stroke:
1) Is this a stroke or a stroke mimic (such as a seizure or a migraine)?
2) What is the symptom onset time?
3) If this is a stroke, is it a haemorrhagic or ischaemic stroke?
Bearing these three key questions in mind, we decided to create a 'Tramline' interface to support each of these as branches of a tree, which visually demonstrated the fact that the patient’s symptoms may be caused by a range of clinical processes until they have been ruled out by various diagnostic tests (Figure 2(b)). The later stages of the tramline also help to distinguish between ischaemic and haemorrhagic strokes once the brain imaging has occurred. Clicking on a white circle (Figure 4) allowed a learner to navigate the scenario stages easily.
Although the tramline navigation concept contained useful information, it was noted that it immediately demonstrated a visual answer to the three key questions stated above, as the branches contained more information about the patient than would normally be available to the assessing clinician. Thus, the tramline design was abandoned in favour of using clockfaces, which highlighted the time for each stage in the scenario (Figures 2(c)-(d)). A system was created to allow users to navigate the scenario by clicking on directional arrows next to a main clock, or by clicking directly on a clockface. Early versions were static images that had to be manually created. This was inefficient and so the final version automatically generated analogue clocks based upon XML data for each individual stage of a patient scenario (Figure 5). Clockfaces also gave visual stimulation of time reinforcing the importance of timely medical attention for acute stroke management [http://www.rcplondon.ac.uk/sites/default/files/national-clinical-guidelines-for-stroke-fourth-edition.pdf] .
Our final navigation design made use of “Second Life” which is an online virtual world that has been used for game-based learning in medicine and allows groups of people to interact with each other using customised characters or avatars [ https://secondlife.com/ , Toro-Troconis et al., 2011 ]. We initially used Second Life to generate images to illustrate the scenarios and Second Life was then used as a way to navigate the scenarios by creating an avatar, a basic hospital ward and anatomical structures. We found that Second Life was good at representing

Figure 4. Tramline navigation.
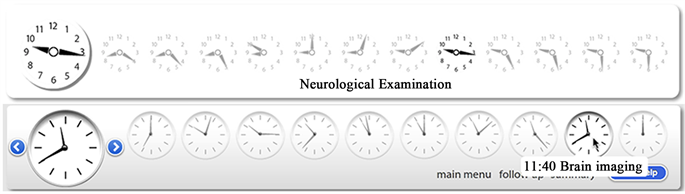
Figure 5. Two versions of the “door to needle” clockface navigation.
buildings, vehicles and the external appearance of patients. It also met our requirements of being able to demonstrate care pathways and emphasising the importance of “door to needle” time. However, Second Life was rejected by the project team as it can only show very crude 3D anatomy, with nothing like the detail required to demonstrate the symptoms and signs of a stroke. In addition, navigating a virtual world such as Second Life has a relatively steep learning curve and we wanted the multimedia e-learning tool to be as easy to use as possible by all HASU staff. Lastly, we were reluctant to build the learning tool on a commercial platform, which did not give us control of the underlying technology and was not compatible with online healthcare professional communications networkssuch as https://synapse.nhs.uk/.
2.3.2. Content Validity and Usability
The methodology of developing this learning tool weaved content (the artefacts) and iterative design as a construction process. More specifically, specific strands were identified to form the nexus of the educational, technological and clinical whole:
1) A relationship to existing clinical guidelines and educational standards;
2) The selection of scenarios as a learning design;
3) The use of actual clinical episodes with treating clinicians;
4) “Closing the loop” of the clinical scenario initiated with a presenting ictus (stroke event) through to post-episodic interviews with treating clinicians and concluding with reference to “final” findings and outcomes.
It was hoped that by remaining true to these strands the learning experience would keep aligned to the goals of a grounded, relevant and authentic system and provide the content validity.
Usability studies with HASU staff sought to assess the effectiveness and utility of user-interface components which were the manifestation of the aforementioned strands as physical (digital software) components. Each component contributed to one or more of the strands identified above and included:
1) Actual patient data;
2) Video and audio recordings of clinical episodes;
3) Use of clock and timing data;
4) Questions and answers with physicians;
5) Clearly delineated and sequentially ordered stages of the stroke pathway.
2.3.3. Evaluation
Following the validation and deployment activities described, the content of the modules was locked down, and a different type of evaluation occurred. This involved HASU staff working through the modules and providing feedback in follow-up interviews that were audio-taped and subsequently thematic analysed.
3. Results
24 patients presenting to 2 HASUs were observed and filmed. 4 patients withdrew, leaving 20 patients remaining. These 20 patients’ “stories” were reviewed by the multi-professional project team to assess the underlying diagnoses and clinical presentations. 9of the 20 patient “stories” were then chosen for multimedia scenarios to be built in order to provide a variety of stroke and stroke-mimic presentations and avoid duplication, as indicated in Table 1. Each scenario consisted of 12 stages, prefixed with the time they occurred for a particular patient. Each scenario was presented as a factual storyline (narrative) with information synthesised from a range of sources including ambulance handover reports and forms, reported statements from the patient and carers/family members (collateral reports), clinical (medical) records (including brain imaging and other test results), discharge summaries, audio and video recordings and, where relevant, animated 3D models and virtual patients (Table 2; Figure 6). Qualitative analysis from HASU staff use of the e-learning tool demonstrated 7 key themes; 4 positive and 3 negative (Table 3).
4. Discussion
A novel multimedia stroke e-learning tool focusing on “real-life” patient stories were successfully developed using an evolutionary, action research approach. The iterative development allowed a number of learning methods and styles to be trialled and facilitated alignment of the learning tool with existing online stroke resources

Table 1. Stroke/mimic type of the e-learning multimedia scenarios.

Figure 6. Scenario 1: Left middle cerebral artery territory lacunar ischaemic stroke.
[http://webarchive.nationalarchives.gov.uk/20110929220218/http://www.dh.gov.uk/prod_consum_dh/groups/dh_digitalassets/@dh/@en/@ps/@sta/@perf/documents/digitalasset/dh_116343.pdf,
http://clahrc-gm.nihr.ac.uk/wp-content/uploads/DoH-National-Stroke-Strategy-2007.pdf, http://www.nhs.uk/actfast/Pages/stroke.aspx] . The capturing of “real-life” patient data for the development of a clinical stroke e-learning tool effuses “simplicity” but is a double edged sword. On the one hand, there is
Table 2. Twelve stages of scenario 1 and their associated national stroke strategy quality markers.
Table 3. Thematic analysis.
strength in the fidelity of the final product but on the other hand the raw data may hide the complexity of the learning task. As such, the designer may create or use a technology (such as computer generated imagery (CGI) but there is a question as to whether this is or is not beneficial for the learner. Similarly, the designer can insert extra interactivity based around the stroke triad but these may not help the learner. These issues were borne out by early evaluations by HASU staff.
Previous multimedia stroke e-learning resources have focussed on the effects of stroke but the novel approach utilised in the development of this e-learning tool was in following a patient along their care pathway. Scenario-based learning has been theorised to encourage active engagement by presenting clinical learning within authentic contexts and has been commonly used to support problem-based learning [Prince, 2004] . Furthermore, previous novel HASU teaching models have demonstrated the benefits of observation of stroke specialists” clinical assessments of stroke patients, thus helping to refine learners” own assessments and direct behavioural change for the future [Haran et al., 2016] .
The clinical development of HASU-based stroke care has demanded consideration of new pedagogical requirements for a new workforce [Ross et al., 2015] . As such, two linked, integrated frameworks exist; firstly the HASU clinical pathway and secondly a pedagogical process designed for the workforce training issues. Both of these two streams have been infused with new technologies and the relationship between the two streams is that the pedagogical stream must be kept in close synchronicity with the clinical. More specifically, the clinical must drive the pedagogical content and the successful application of pedagogic techniques (such as those employed in the e-learning tool developed) should aim to have a positive impact on clinical delivery.
The way in which this tool was developed has many additional strengths including it being curriculum mapped to the SSEF, the project team being truly multidisciplinary with expertise in stroke, education and virtual reality and human computer interaction, and the iterative development, akin to the “plan-do-study-act” model of quality improvement used in healthcare systems improvement, including in the field of stroke [Taylor et al., 2014, Sommerville et al., 2016] . Limitations, in addition to those raised by HASU users of a dislike of CGI and an over-emphasis on brain imaging and other investigations, include the small, unstandardised evaluation and the patient mix related to the demographics of the population served by the 2 HASUs in London where patient data was captured. Educational needs of HASU staff may also vary depending on discipline as well as locus of input to the stroke patient journey and it may be that by having stroke physicians and not other stroke health care professionals as members of the project team, the e-learning tool had a medical bias. This may, in part, be one of the reasons why feedback was that there was too much emphasis on stroke-related investigations in the learning pathway.This also provided an interesting view on the relationship between the adherence to the design strands and the manifestation in the final e-learning product.
Whilst the e-learning tool developed focused on the stroke triad, more could be done to help learners make meaningful links between the observable symptoms of stroke and its underlying causes. One way to do this might be through dynamic linking: an arrangement where interaction with one representation automatically drives the behavior of one or more additional representations [Brenton, 2011] . Future work might also be directed at optimizing learner-directed control of the module; we could have designed a version which only revealed the type of stroke after the learner had been given an opportunity to suggest his/her own diagnosis.
5. Conclusion
This study showed the feasibility of developing a bespoke multimedia stroke e-learning tool taking learners along the patient journey through a HASU. Given the crucial concept of “time is brain” in the hyperacute stroke care pathway, the tool emphasised a timeline that the learner followed. The project also demonstrated the benefits of collaborative working between clinical and non-clinical professionals and the development of a digital taxonomy to underpin the process.
Acknowledgements
London Commissioner for Medical and Dental Education Simulation and Technology-Enhanced Learning Initiative for funding this work.
Conflict of Interest Statement
There are no conflicts of interest.
Cite this paper
Birns, J., Woodward, P., Brenton, H., & Bello, F. (2018). Development of a Novel Multimedia E-Learning Tool for Teaching the Symptoms and Signs of Stroke. Creative Education, 9, 1196-1211. https://doi.org/10.4236/ce.2018.98089
References
- 1. Bamford, J., Sandercock, P., Dennis, M., Burn, J., & Warlow, C. (1991). Classification and Natural History of Clinically Identifiable Subtypes of Cerebral Infarction. Lancet, 337, 1521-1526. https://doi.org/10.1016/0140-6736(91)93206-O [Paper reference 1]
- 2. Brenton, H. (2011). Instruction with 3D Computer Generated Anatomy. PhD Thesis. [Paper reference 2]
- 3. Buxton, B. (2007). Sketching User Experiences: Getting the Design Right and the Right Design. San Francisco, CA: Morgan Kaufmann Publishers Inc. [Paper reference 1]
- 4. Evans, A., Perez, I., Harraf, F., Melbourn, A., Steadman, J., Donaldson, N., et al. (2001). Can Differences in Management Processes Explain Different Outcomes between Stroke Unit and Stroke-Team Care? Lancet, 358, 1586-1592. https://doi.org/10.1016/S0140-6736(01)06652-1 [Paper reference 1]
- 5. Haran, H., Bhalla, A., Cluckie, G., & Birns, J. (2016). Hyperacute Stroke Unit Training for Paramedics. Journal of Paramedic Practice, 8, 494-498. https://doi.org/10.12968/jpar.2016.8.10.494 [Paper reference 1]
- 6. Harbison, J., Hossain, O., Jenkinson, D., Davis, J., Louw, S. J., & Ford, G. A. (2003). Diagnostic Accuracy of Stroke Referrals from Primary Care, Emergency Room Physicians, and Ambulance Staff Using the Face Arm Speech Test. Stroke, 34, 71-76. https://doi.org/10.1161/01.STR.0000044170.46643.5E [Paper reference 2]
- 7. http://clahrc-gm.nihr.ac.uk/wp-content/uploads/DoH-National-Stroke-Strategy-2007.pdf [Paper reference 3]
- 8. http://webarchive.nationalarchives.gov.uk/20110929220218/http://www.dh.gov.uk/prod_consum_dh/groups/dh_digitalassets/@dh/@en/@ps/@sta/@perf/ documents/digitalasset/dh_116343.pdf [Paper reference 3]
- 9. http://www.nhs.uk/actfast/Pages/stroke.aspx [Paper reference 3]
- 10. http://www.ninds.nih.gov/disorders/stroke/strokescales.htm [Paper reference 1]
- 11. http://www.rcplondon.ac.uk/sites/default/files/national-clinical-guidelines-for-stroke-fourth-edition.pdf [Paper reference 3]
- 12. http://www.secondlife.com [Paper reference 1]
- 13. Hunter, R.M., Davie, C., Rudd, A., Thompson, A., Walker, H., Thomson, N., et al. (2013). Impact on Clinical and Cost Outcomes of a Centralized Approach to Acute Stroke Care in London: A Comparative Effectiveness before and after Model. PLoS ONE, 8, e70420. https://doi.org/10.1371/journal.pone.0070420 [Paper reference 1]
- 14. Kalra, L., Evans, A., Perez, I., Knapp, M., Donaldson, N., & Swift, C. G. (2000) Alternativestrategies for Stroke Care: A Prospective Randomised Controlled Trial. Lancet, 356, 894-899. https://doi.org/10.1016/S0140-6736(00)02679-9 [Paper reference 1]
- 15. Kassab, E., Kyaw Tun, J., & Kneebone, R. L. (2012). A Novel Approach to Contextualized Surgical Simulation Training. Simulation in Healthcare, 7, 155-161. https://doi.org/10.1097/SIH.0b013e31824a86db [Paper reference 1]
- 16. Morris, S., Hunter, R. M., Ramsay, A. I. G., Boaden, R., McKevitt, C., Perry, C., et al. (2014). Impact of Centralising Acute Stroke Services in English Metropolitan Areas on Mortality and Length of Hospital Stay: Difference-in-Differences Analysis. Br. Med. J., 349, 4757. https://doi.org/10.1136/bmj.g4757 [Paper reference 1]
- 17. National Institute for Health and Care Excellence (2008). Stroke and Transient Ischaemic Attack in over 16s: Diagnosis and Initial Management. [Paper reference 1]
- 18. National Institute of Neurological Disorders and Stroke rt-PA Stroke Study Group (1995). Tissue Plasminogen Activator for Acute Ischemic Stroke. The New England Journal of Medicine, 333, 1581-1587. https://doi.org/10.1056/NEJM199512143332401 [Paper reference 1]
- 19. Noffke, S., & Somekh, B. (2009). The SAGE Handbook of Educational Action Research. Thousand Oaks, CA: Sage Publications Ltd. https://doi.org/10.4135/9780857021021 [Paper reference 1]
- 20. Nor, A. M., Davis, J., Sen, B., Shipsey, D., Louw, S. J., Dyker, A. G. et al. (2005). The Recognition of Stroke in the Emergency Room (ROSIER) Scale: Development and Validation of a Stroke Recognition Instrument. The Lancet Neurology, 4, 727-734. https://doi.org/10.1016/S1474-4422(05)70201-5 [Paper reference 1]
- 21. Prince, M. (2004). Does Active Learning Work? A Review of the Research. Journal of Engineering Education, 93, 223-232. https://doi.org/10.1002/j.2168-9830.2004.tb00809.x [Paper reference 2]
- 22. Ross, A. J., Reedy, G. B., Roots, A., Jaye, P., & Birns, J. (2015). Evaluating Multisite Multi-Professional Simulation Training for a Hyperacute Stroke Service Using the Behaviour Change Wheel. BMC Medical Education, 15, 143. https://doi.org/10.1186/s12909-015-0423-1 [Paper reference 1]
- 23. Sommerville, P., Lang, A., Nightingale, S., & Birns, J. (2016). Dysphagia after Stroke and Feeding with Acknowledged Risk. British Journal of Neuroscience Nursing, 12, 162-170. https://doi.org/10.12968/bjnn.2016.12.4.162 [Paper reference 1]
- 24. Stone, S. (2002). Stroke Units. British Medical Journal, 325, 291-292. https://doi.org/10.1136/bmj.325.7359.291 [Paper reference 1]
- 25. Taylor, M. J., McNicholas, C., Nicolay, C. et al. (2014). Systematic Review of the Application of the Plan-do-Study-Act Method to Improve Quality in Healthcare. BMJ Quality & Safety, 23, 290-298. https://doi.org/10.1136/bmjqs-2013-001862 [Paper reference 1]
- 26. Testani-Dufour, L., & Morrison, C. A. (1997). Brain Attack: Correlative Anatomy. Journal of Neuroscience Nursing, 29, 213-222. https://doi.org/10.1097/01376517-199708000-00002 [Paper reference 1]
- 27. Toro-Troconis, M., Kamat, A., & Partridge, M. (2011). Design and Development of a Component-Based System for Virtual Patients in the Virtual World of Second Life. Journal of Emerging Technologies in Web Intelligence, 3, 4. https://doi.org/10.4304/jetwi.3.4.308-316 [Paper reference 1]
- 28. Woodward, P. J., Brenton, H., Ames, D., Bello, F., & Birns, J. (2013). A Multi-Media e-Learning Tool for Stroke. International Journal of Stroke, 8, 34-35. [Paper reference 2]
- 29. Woodward, P., Birns, J., Bello, F., & Brenton, H. (2011). E-Learning Framework for Stroke. International Journal of Stroke, 6, 56. [Paper reference 1]