Energy and Power Engineering
Vol.09 No.01(2017), Article ID:73465,11 pages
10.4236/epe.2017.91002
Energy Targeting for a Brewing Process Using Pinch Analysis
Noah Tibasiima, Aldo Okullo*
Department of Chemistry, Faculty of Science, Kyambogo University, Kampala, Uganda

Copyright © 2017 by authors and Scientific Research Publishing Inc.
This work is licensed under the Creative Commons Attribution International License (CC BY 4.0).
http://creativecommons.org/licenses/by/4.0/


Received: November 24, 2016; Accepted: January 10, 2017; Published: January 13, 2017
ABSTRACT
The rising cost of energy and environmental concerns have led the brewing industry to search for techniques of reducing energy consumption in brewery operations. In this paper, pinch analysis was applied to a typical Ugandan based brewery process to target for the energy requirements of the process. Hint software was used for the analysis. At the chosen ΔTmin of 10˚C, the minimum cooling and heating utility requirements of the brewery studied were determined as being 4862.21 kW and 8294.21 kW respectively, with a pinch temperature at 68˚C. It was observed that using the technique, 1806.59 kW of energy could be recovered through process to process heat exchange which presented an energy saving potential of 21.5%. It is recommended that results from this study could be used in the design or retrofit of a heat exchanger network of a brewery for improved energy efficiency. Considerations can also be made for other values of ΔTmin.
Keywords:
Energy Targeting, Pinch Analysis, Hint, Brewing, Utility Requirements

1. Introduction
The concerns on energy sustainability and security coupled with increasingly stringent environmental regulations have pooled to elevate the challenge of energy efficiency particularly for energy intensive industries, to a high-priority subject [1] . A study by [2] showed that beer production is an energy demanding process with the energy intensity of producing 562 hectoliters (hl) of beer approximating to 262 MJ/hl, consisting of electrical (41%), thermal (58.8%) and manual (0.2%) of the total energy. On a 10-year projection, this energy consumption is enormous and it is imperative to mitigate so as to reduce costs and make it sustainable as population and economic growths are significantly increasing [3] .
Uganda is the fifth largest beer market in Africa only behind Nigeria, South Africa, Kenya and Ghana [4] with its market share split among three breweries viz Uganda Breweries Limited (UBL) (46.5%), Nile Breweries Limited (NBL) (52%) and Parambot Breweries Limited (PBL) (1.5%). In recent years, these manufacturers have experienced an increase in cost of production and an inadequacy in global competitiveness of the beer produced. This has triggered off a campaign in search of opportunities to reduce manufacturing costs through the use of cost-effective energy saving technologies and practices that will reduce operating costs while maintaining or increasing quality and productivity.
Pinch technology presents a simple energy analysis and systematic methodology for industrial processes and the surrounding utility systems. The technique was first developed by two independent research groups ( [5] and [6] ) based on the applied thermodynamics concepts of [7] .
“Pinch Analysis” is often used to denote the application of the tools, algorithms and heuristics that are embedded in pinch technology. The laws of thermodynamics provide the basis for determining the enthalpy changes and direction of heat flow and as such pinch analysis can be used to identify energy targets and heat exchanger network (HEN) capital cost targets for a process by recognizing the pinch point, the temperature at which the driving force for heat transfer is zero, and designing exchange networks based on the location of this point. The process streams that affect energy consumption are identified, quantified in terms of heat and mass flow and categorized in respect to their utility requirements as heating or cooling then combined in form of two composite curves [8] on a temperature-enthalpy diagram wherein the region for possible heat recovery and utility requirements can easily be identified. Grand composite curve analysis helps towards identifying opportunities for energy-efficient utility integration to satisfy the energy requirements [9] .
The Top-Down approach [10] for analyzing the energy efficiency of industrial processes in the food industry uses Pinch Analysis to identify the possible heat recovery by heat exchange between the streams. The method shows that more than 80% of the energy consumption can be explained by describing only 20% of the units of a factory and thus the approach consists of the identification and characterization of the main Process Unit Operations whose streams are used in the pinch study.
Breweries are operated in batch mode due to the biological processes involved [11] , however pinch analysis and practical heat recovery projects for batch systems are more difficult to undertake using this system than for continuous processes [8] since the hot and cold streams in batch processes don’t exist over the entire process time [12] , thus restricting heat exchange options. Another consequence arises from the fact that batch processes are not as energy intensive compared to continuous bulk systems leading to a less consideration in a methodical search for process integration opportunities [13] that have been effective in continuous processes. Nonetheless approaches for targeting and integration in batch processes have been reported by several authors [14] [15] and a complete review of the techniques can be found in [16] .
The two widely used models for analysis of batch processes for integration are the time slice model (TSM) and time average model (TAM). The time slice model was derived from the Pinch Analysis for continuous processes [17] [18] with the process streams being sectioned when a change in heat flow occurs. As a result, steady state conditions prevail in every created time “slice” enabling the application of Pinch Analysis on these time intervals and the results can be combined to receive the minimum amount of external utilities. Nevertheless, heat streams occurring when a medium is heated or cooled in a vessel (dynamic heat streams) cannot be processed by the TSM [12] as these streams have to be converted to have steady-state behavior.
The Time Average Model (TAM) was introduced by [19] to identify potentials for energy integration in batch processes basing on a procedure adapted from Pinch Analysis for continuous processes. Ignoring the discontinuous nature of process streams in batch mode, the energy of each stream is averaged over each batch cycle time. Hence, the minimum requirements for external heating and cooling as well as the internally exchanged heat can easily be determined as if the process is in “continuous” mode.
Pinch analysis of the brewing process allows for the determination of targets for maximum heat exchange within each batch, identifying key matches that achieve most heat recovery, analysis of utility systems and reduction of peak loads [8] for the process to meet an energy target resulting into an efficient energy utilization.
This technique can be used by Ugandan based breweries in particular as a preliminary to retrofitting their processes for efficient energy use.
The objective of this study was to use pinch analysis to establish energy targets that can meet the energy consumption of the brewery defined by the minimum utility requirements in heating and cooling.
2. Materials and Methods
Hint software was used to analyze the collected data for the pinch study as it performs energy target calculations using the Problem Table Algorithm as given by [5] .
Since the brewing process is quite a standardized process albeit experiencing major changes in production equipment [20] , similar technologies are used in different breweries. An actual industrial brewing process similar to a typical Ugandan based brewery was identified and relevant data for the pinch study was obtained as described by [8] . The procedure involved:
・ Identification of hot process, cold process and utility (hot and cold) streams of a particular brewing plant.
・ Data extraction of relevant plant process utility and streams (supply and target temperatures, heat capacity and enthalpy) that could be used in calculations for the heat exchanger network.
・ Selection of a “suitable” ΔTmin value, in determined range, that serves as the design parameter.
・ The collected data was fed to Hint. The information required for this calculation are the thermal properties of the streams (supply/target temperatures) and enthalpy (H) or heat capacity flow rate (mCp) obtained at ΔTmin.
・ Generation of composite and grand composite curves using the extracted data to evaluate the type of utility required and the amount of heating and cooling required in the HEN.
The flowchart in Figure 1 summarizes the procedure undertaken to establish the energy targets in this work.
Pinch Analysis of the brewery was performed using the following key hypotheses:
・ Thermal losses during heat transfer were neglected.
・ The time average model (TAM), where the process operations are taken as being simultaneous, was considered as the approach of choice since in reality the brewery units are operated in batch mode.

Figure 1. Process flow-chart for this energy targeting.
・ The process streams physical properties were constant at the given process temperatures.
3. Process Description
The brewery studied corresponds to a typical brewing process described by [3] as shown in Figure 2 and is divided in two stages:
Hot Stage (mashing): The malt/water mixture is combined with a rice/water mixture in a mash converter. The mash is heated from 63˚C to 78˚C then sent to a lautertun.
The clarified wort goes to an energy intensive wort kettle where it is boiled to 100oC with hops to develop beer flavours. The wort is clarified in a whirlpool to remove the hops and eventually cooled to a pitching temperature of 13˚C before it undergoes fermentation.
Cold Stage: Wort fermentation by yeast at 14˚C takes place by converting the sugars to alcohol for 2 weeks. The beer is cooled down to 7˚C before it undergoes treatment to precipitate protein via silica gel. The beer is then chilled to −2˚C and clarified before being stored in insulated tanks where it ends its maturation.
4. Results and Discussion
The stream data for the pinch study in Table 1 indicates a total energy requirement of 16769.6 kW with the heating and cooling loads of 10100.8 kW and 6668.8 kW respectively for the current system not utilizing process to process heat recovery.
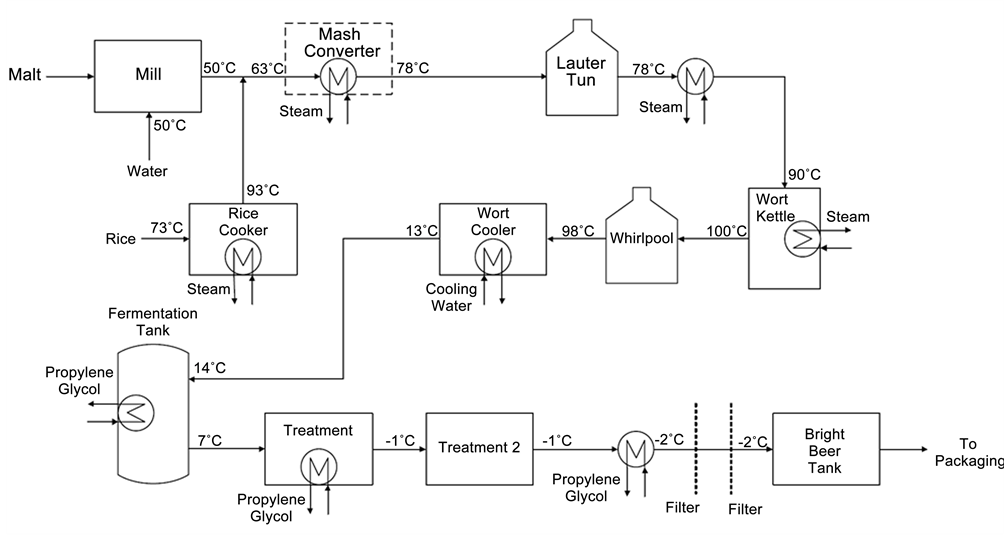
Figure 2. Typical industrial brewing process. Adopted from [3] .
Since for a given value of ∆Tmin, the utility quantities predicted are the minima required to solve the heat recovery problem, a plot of energy targets versus ΔTmin in Figure 3 shows that the possible range for the minimum temperature difference is 0 < ΔTmin < 35˚C.
It should be noted that as ΔTmin increases, there is a decrease in the heat transferred within the system which requires a lower heat transfer area and therefore leading to a decrease in capital costs(if c < 1 in the cost equation Cost = a + bAc) as shown in Figure 4.
However an increase in ΔTmin leads to an increase in energy costs since there is greater external energy demand which warrants an increase in the requirement for the extra heat transfer utilities.

Table 1. Stream data table.
C―Cold Stream; H―Hot Stream.

Figure 3. Energy targets vs. ΔTmin.
With ΔTmin = 10˚C, there is an overlapping of the cold composite curve and the hot composite curve (Figure 5) which indicates a possibility of process to process heat exchange. The minimum energy requirements are predicted at 8294.21 kW and 4862.21 kW for the heating and cooling utilities respectively. For maximum energy recovery, the region of overlap indicates a total of 1806.59 kW as possible energy that can be recovered in the process. This presents a potential reduction of 21.5% in the utility requirements as shown in Table 2.
The Grand Composite curve in Figure 6 plotted using net heat flow (utility requirement) and shifted temperatures shows a sharp pinch at 68˚C with no

Figure 4. Heat transfer area vs. ΔTmin.

Figure 5. Composite curves (CC) for the process streams.
other near pinches. This is the pinch temperature at which enthalpy is zero. It also gives the same results for the minimum utility requirements as the composite curves.
The characteristics of the existing brewery utilities are shown in Table 3 below.
A plot of grand composite curve with utilities (balanced grand composite curves) in Figure 7 and the composite curve with utilities (balanced composite curves) in Figure 8 shows that the energy targets for the utilities under consideration for the process should be 8294.21 kW for the LP steam utility, 4305.78 kW for cooling water and 556.43 kW for propylene glycol in order to satisfy for the minimum energy requirements predicted by the composite curves.
Table 2. Possible utility requirement savings.

Figure 6. Grand composite curve (GCC).
Table 3. Current process utility streams.

Figure 7. Balanced GCC.

Figure 8. Balanced CC.
5. Conclusions
From this work, it can be concluded that the existing energy intake from utilities is 16,769.6kW with 6668.8 kW needed for cooling and 10,100.8 kW needed for heating. However using pinch analysis with ∆Tmin = 10˚C, it is found that the minimum energy requirements are 4862.21 kW and 8294.21 kW for the cooling and heating utilities respectively with maximum energy recovered during process- process exchange being 1806.59 kW. This represents a saving of 21.5% in energy requirement which can be translated into the process giving efficient energy use.
A single pinch exists at 68˚C and this temperature may be referred to when considering the retrofitting of the existing brewery configuration to implement the energy targets through a design of a heat exchange network based on MER.
Recommendations
It is recommended that:
・ A heat exchange network (HEN) can be designed for the brewery process based on the targets obtained in this study for efficient energy implementation.
・ Pinch analysis be applied using various temperatures in the range obtained from the energy targets vs. ∆Tmin since reduction would increase the heat recovery, thus decreasing the utility consumption and cost, but at the expense of an increase in the heat exchanger size and capital cost.
・ The time average model (TAM) used in this work gives similar results to an assumed continuous process however most brewery configurations are effected as batch processes and as such the time slice model (TSM) may be considered to give more realistic energy targets.
・ A Top Level Analysis could be performed on the process to identify utilities “worth saving” and how much of the existing utility system can be saved within the context of the constraints.
Acknowledgements
We would like to acknowledge the assistance of Kyambogo University for enabling us produce and ultimately publish this paper.
Cite this paper
Tibasiima, N. and Okullo, A. (2017) Energy Targeting for a Brewing Process Using Pinch Analysis. Energy and Power Engineering, 9, 11-21. http://dx.doi.org/10.4236/epe.2017.91002
References
- 1. Von Hippel, D., Suzuki, T. and William, J.H. (2011) Energy Security and Sustainability in North East Asia. Energy Policy, 39, 6719-6730. https://doi.org/10.1016/j.enpol.2009.07.001
- 2. Fadare, D.A., et al. (2010) Energy and Exergy Analyses of Malt Drink Production in Nigeria. Energy, 35, 5336-5346. https://doi.org/10.1016/j.energy.2010.07.026
- 3. Leni, C.E., Daniel, G., de Luna Mark, G., Ferdinard, M. and Nurak, G. (2015) Brewery Heat Exchanger Networks Design and Optimization Based on Pinch Analysis at a Single ΔTmin. Philippine Engineering Journal, 36, 54-75.
- 4. Kalungi, N. (2012) Monitor Publications.
http://www.monitor.co.ug/Business/Commodities/Uganda-is-fifth-biggest-beer-market/688610-1475458-sh7lp7z/index.html - 5. Linnhoff, B. and Flower, J.R. (1978) Synthesis of Heat Exchanger Networks I: Systematic Generation of Energy Optimal Networks. AIChE Journal, 24, 633-642.
- 6. Umeda, T., Itoh, J. and Shikoro, K. (1978) Heat Exchanger Synthesis. Chemical Engineering Progress, 74, 70-76.
- 7. Holman, J.P. (1988) Thermodynamics. McGraw-Hill, New York.
- 8. Kemp, I.C. (2007) Pinch Analysis and Process Integration—A User Guide on Process Integration for Efficient Use of Energy. Butterworth-Heinemann, Oxford.
- 9. Dumbliauskaite, M., Becker, H. and Maréchal, F. (2010) Utility Optimization in a Brewery Process Based on Energy Integration Methodology. Proceedings of ECOS, 91-98.
- 10. Muller, D. (2007) Web-Based Tools for Energy Management in Large Companies Applied to Food Industry. PhD Dissertation, EPFL-STI, Industrial Energy System Laboratory, Lausanne.
- 11. Muster-Slawitsch, B., Brunner, C., de Lima, D.R. and Schnitzer, H. (2010) The Green Brewery Concept—Energy Efficiency and the Use of Renewable Energy Sources in Breweries. Chemical Engineering Transactions, 21, 649-654.
- 12. Christian, D., Kirsten, U., Christian, B. and Gerhard, S. (2014) Heat Integration in Batch Processes Including Heat Streams with Time Dependent Temperature Progression. Applied Thermal Engineering, No. 70, 321-327.
- 13. Gundersen, T. and Naess, L. (1988) The Synthesis of Cost Optimal Heat Exchanger Networks. Computers and Chemical Engineering, No. 12, 503-530. https://doi.org/10.1016/0098-1354(88)87002-9
- 14. Foo, D.C.Y., Chew, Y.H. and Lee, C.T. (2008) Minimum Units Targeting and Network Evolution for Batch Heat Exchanger Network. Applied Thermal Engineering, No. 28, 2089-2099. https://doi.org/10.1016/j.applthermaleng.2008.02.006
- 15. Atkins, M.J., Walmsey, M.R.W. and Neale, J.R. (2010) The Challenge of Integration Non-Continuous Processes—Milk Powder Plant Case Study. Journal of Cleaner Production, No. 18, 927-934. https://doi.org/10.1016/j.jclepro.2009.12.008
- 16. Fernandéz, I., Renedo, C.J., Pérez, S.F., Ortiz, A. and Manana, M. (2012) A Review: Energy Recovery in Batch Processes. Renewable and Sustainable Energy Reviews, No. 16, 2260-2270. https://doi.org/10.1016/j.rser.2012.01.017
- 17. Kemp, I.C. and Deakin, A.W. (1989) The Cascade Analysis for Energy and Process Integration of Batch Processes, Part 1: Calculation of Energy Targets. Chemical Engineering Research & Design, No. 67, 495-505.
- 18. Golwelker, S. (1994) Energy Integration of Batch Processes: Pinch Technology Approach. M.Tech Thesis, Indian University of Technology, Bombay.
- 19. Kemp, I.C. and Macdonald, E.K. (1988) Energy and Process Integration in Continuous and Batch Processes. Institution of Chemical Engineering Symposium, Series No. 105, 185-200.
- 20. Kunze, W. (2007) Technologie der Brauer und Malzer. Versuchs-und Lehranstalt für Brauerei in Berlin, Berlin.