World Journal of Mechanics
Vol.05 No.05(2015), Article ID:56272,5 pages
10.4236/wjm.2015.55009
Cyclic Elasto-Plastic Fracture Diagram and Some Parameters of Cyclic Crack Growth Resistance for the Plastic Steels
L. A. Sosnovskiy1, A. V. Bogdanovich2, S. S. Sherbakov2
1S&P Group “TRIBO-FATIGUE”, Gomel, Belarus
2Department of Theoretical and Applied Mechanics, Belarusian State University, Minsk, Belarus
Email: bogal@tut.by, sherbakovss@mail.ru
Copyright © 2015 by authors and Scientific Research Publishing Inc.
This work is licensed under the Creative Commons Attribution International License (CC BY).
http://creativecommons.org/licenses/by/4.0/


Received 13 March 2015; accepted 10 May 2015; published 13 May 2015
ABSTRACT
Method of calculation and experimental estimation of crack growth resistance under cyclic elasto- plastic deformation is proposed. This method is based on measuring of local plastic strain near the crack tip and plotting the cyclic elasto-plastic fracture diagram for a specimen with a crack. Analysis of two types of the cyclic elasto-plastic fracture diagrams and their parameters is made. Experimental D-diagrams of cyclic elasto-plastic fracture for the plastic carbon steel are given.
Keywords:
Crack Growth Resistance, Elasto-Plastic Deformation, Compact Specimen, Plastic Steel, Stress Intensity Factor, Contraction

1. Introduction
A significant influence on strength and life of the structures is conditioned by manufacturing defects and operational nature which often become the cause of fatigue cracks. Evaluation of the crack resistance of structures made from plastic steel based on the approaches of nonlinear fracture mechanics is problematic due to non- compliance of the conditions of plane strain. One solution to the problem is in the extrapolation of formulas of linear elastic fracture mechanics for stress intensity factor (SIF) on essentially nonlinear stage of deformation using functions of plasticity amendments. Analytical and experimental method for the estimation of crack growth resistance under cyclic elasto-plastic deformation [1] based on measuring of local plastic strain near the crack tip end is discussed further.
2. Diagram Construction Method
Considering that plastic steel was subjected to test an estimation of applicability of basic formulas of linear elastic fracture mechanics was made. Observance of flat deformation conditions was checked by criteria [2] - [5] :
 (1)
(1)
 (2)
(2)
where  is stress intensity factor;
  is a nominal thickness of the compact specimen;
  is a thickness of the compact specimen with the account of elasto-plastic strains;
  is yield strength (offset = 0.2%) of a material;
  is relative contraction of cross-section of the specimen (Figure 1).
It has appeared that conditions Equation (1) and Equation (2) are not satisfied for the investigated steel in the upper part of the fatigue crack growth diagram. Formulas of linear elastic fracture mechanics for the estimation of SIF value of the standard compact tension specimen [2] -[4]
 (3)
(3)
where  is the maximum load of a cycle; l is the measured length of a crack;
 , B are the sizes of a dangerous section of the specimen (Figure 1);
  is the correction function which considers geometry of the specimen and its scheme of loading:
 (4)
(4)
is also correct for elastic deformation under preservation of flat deformation conditions. In order to apply them to elasto-plastic domain it is necessary to correct them for plasticity.
It can be realized by taking into account in Equation (4) the actual sizes of dangerous cross-section of the specimen, i.e. those sizes that take place under plastic deformation [1] [6] -[9] .
Let us multiply and divide the relation  by
by  value; thus
 . Means,
 . At elastic deformation this equality is identical. Taking into account plastic defor-
mation of dangerous cross-section of the specimen in function Y it is necessary to accept the actual thickness  of the specimen, where
  is a lateral component of plastic strain (contraction) of cross-section, i.e. we can write [6] :
 , (5)
, (5)
where  is the nominal (before deformation) area of dangerous cross-section of the specimen;
  is the area damaged by a crack with a length l and defined with the account of the plastic deformation of cross-section. It means that by introduction of Equation (5) into Equation (3) and Equation (4) we obtain a technique of SIF calculation for elasto-plastic domain [1] [6] -[9] :
 ; (3а)
 (4а)
(4а)
Thus Equation (4а) considers not only geometry of the specimen and its scheme of loading but also integrally the size of plastic strain in dangerous cross-section. And in Equation (3а) the local measure of damage of a specimen with a crack  that has not only geometrical meaning but also physical content is introduced. This measure unambiguously defines the life of an object with a crack [10] .
It should also be stressed out that the measure  is defined taking into account plastic strain of dangerous cross-section. According to the developed approach [1] [6] -[9] whole process of elasto-plastic deformation and destruction are described by means of the cyclic elasto-plastic fracture diagram for a specimen with a crack (CEPF-diagram). This diagram is built in SIF coordinates
  and absolute
  or relative
  contraction. Lateral component of plastic strain of the specimen in the zone of crack growth (contraction) is defined as a difference between nominal
  and actual
  values of thickness of the specimen, i.e.
  (see Figure 1(a)); its relative value is
 . Thus SIF
  is calculated using formulas of linear elastic fracture mechanics, but adjusted for plasticity of the investigated material. For example Equations (3а), (4а) are used for calculation of SIF of the compact specimen (see Figure 1(a)).
3. Two Types of CEPF-Diagram
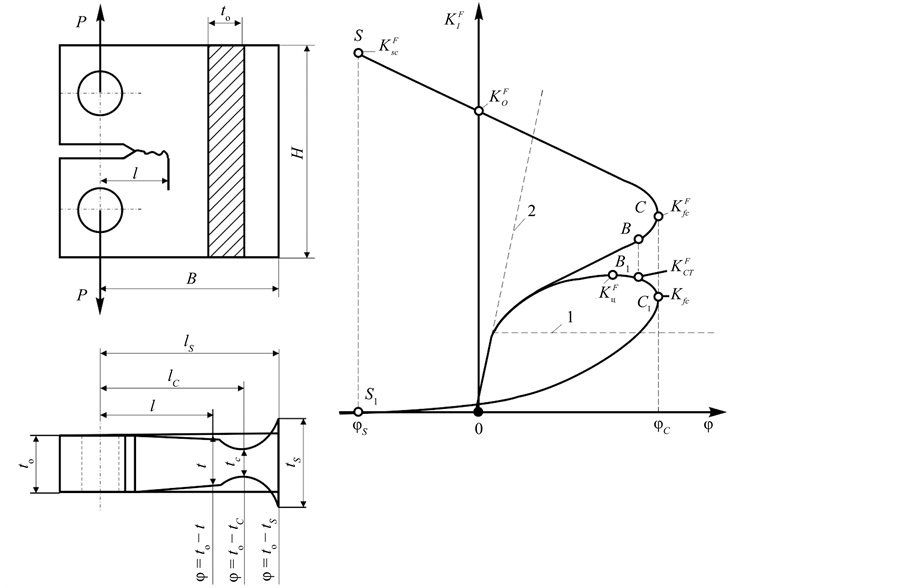
There are two types of CEPF-diagram [8] [9] . If for calculation of  value we conditionally accept that the maximum load in rupture process remains constant (and it is really possible if the test machine is rigid enough or loading rate is high), then ОВСS diagram (see Figure 1(b)) is obtained which resembles letter D taking into account ordinates axis. Therefore it is named D-diagram. If for calculation of
  we consider decrease of loading in rupture process of a specimen (when the test machine has rather low rigidity or the rate of loading is low) diagram
  (see Figure 1(b)) is obtained. As the form of this diagram reminds letter Q it is named Q-diagram.
The CEPF-diagram generally consists of two curves: a curve of cyclic elasto-plastic destruction (sections ОВС in D-diagram and  in Q-diagram) and a curve of quasi-static destruction (rupture) (sections CS in D-diagram and
  in Q-diagram). In points C and
  the crack reaches the critical size
  to which limiting contraction
  and limiting SIF value―cyclic fracture toughness (values of
  in D-diagram and
  in Q-diagram) correspond. There is a division of the specimen into two parts in corresponding points S and
 , thus takes place a maximum limiting widening
  it’s dangerous cross-section on which we define other limiting SIF value―the quasi-static fracture toughness (size
  in the D-diagram;
  in this point in Q- diagram). Crossing of CS curve with an axis of ordinates gives one more parameter of crack growth resistance
  (see Figure 1(b)). The maximum of Q-diagram on an SIF axis (point В1) corresponds to the beginning of
 (a) (b)
Figure 1. Schemes: test of the compact specimen and measurement of the thickness reduction (a); cyclic elasto-plastic fracture diagram for a specimen with a crack (b).
cyclic rupture and is characterized by parameter ; parameter
  in the Q-diagram corresponds to the beginning of quasi-static rupture; it is not a characteristic point of this diagram, but it corresponds to the beginning of sharp lifting of curve ОВС (a point B in the D-diagram). In a case of “ideally plastic fracture” the curve of cyclic elasto-plastic destruction is transformed to a straight line 1. In a case of “ideally brittle fracture”
  this curve coincides with an axis of ordinates. The line 2 divides areas of quasi-brittle and elasto-plastic destructions. Thus the analysis of is viscous-brittle transition, for example, at change of the sizes of a specimen or test temperature is possible by means of CEPF-diagram.
4. Analytical Description of CEPF-Diagram
It is offered three expressions for the analytical description of ОВС curve at D-diagram [6] [8] [9] . The first is a power equation
 (6)
(6)
where  is a parameter of cyclic hardening
 ;
;  is a plasticity threshold, i.e. SIF value below which the plastic strains in a crack top do not influence its value. Parameters
  and
and  are defined on experimental dependence in co-ordinates
 .
.
The second dependence for the description of a curve of cyclic elasto-plastic destruction ОВС looks like:
 (7)
(7)
where  is the parameter which is subject to definition;
  is parameter of hardening;
  is a relative contraction of a specimen, corresponding to the beginning of yield of a material at an axial tension. If
 ,
,  or
or . Hence parameter
  is such SIF value which corresponds to relative size of contraction
 . And as
  and for plastic materials
  so parameter
  can
can

Figure 2. D-diagrams of the cyclic elasto-plastic fracture for the carbonic steel constructed by the results of tests of compact samples of 10 (1), 20 (2) and 40 (3) mm thickness.
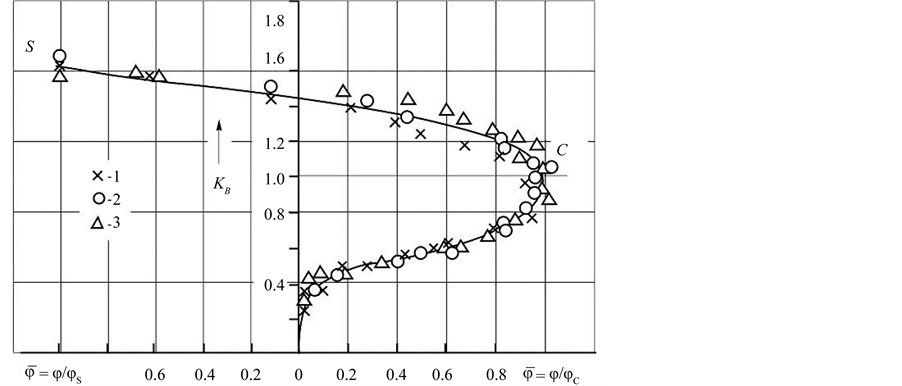
Figure 3. Generalized D-diagrams of the cyclic elasto-plastic fracture for the carbonic steel constructed by the results of tests of compact samples of 10 (1), 20 (2) and 40 (3) mm thickness.
be defined for them as such value  which corresponds to half of limiting contraction
 . Practically value Kw is defined also as value corresponding to value
  at representation of ОВС
curve (see Figure 1(b)) in co-ordinates , and value of parameter
  can be
found from the same graph as a tangent of an angle of an inclination of the received straight line to an axis of abscises.
For obtaining the third expression it is accepted that experimental points in an average part of ОВС part of the D-diagram are approximated by a straight line in co-ordinates . The equation of this straight line at transition to usual co-ordinates is transformed to power dependence of a kind
 (8)
(8)
where ,
,  are parameters. Practically value
  is defined on a point of crossing of the specified straight line with an axis of ordinates in double logarithmic co-ordinates, and value of parameter
  is found as a tangent of an angle of an inclination of this straight line to an axis of abscises.
Figure 2 shows CEPF-diagrams (analytical description of which was given above) for compact specimens of different thickness made of the plastic carbonic steel. Influence of specimen sizes on deformation characteristics of crack growth resistance is visible on Figure 2. And in Figure 3 the same diagrams are combined in the form of one dependence SIF-specimen contraction by means of the offered similarity transformation. It is shown how the stated approach can be used for an estimation of pipes survivability.
References
- Sosnovskiy, L.A. and Bogdanovich, A.V. (2011) Crack Growth Resistance. BelSUT, Gomel, 169-254.
- Е-647 (2000) Standard Test Method for Measurement of Fatigue Crack Growth Rates.
- E-339 (1976) Standard Test Method for Plane-Strain Fracture Toughness of Materials. Annual Book of ASTM Standards, 471-490.
- РД 50-345-82 (1982) Calculations and Tests for Strength. Methods of Mechanical Tests of Metals. Definition of Crack Growth Resistance Characteristics (Viscosity of Destruction) at Cyclic Loading. Methodical Instructions. Moscow.
- Drozdovsky, B.А. and Morozov, E.M. (1976) Methods of an Estimation of Viscosity of Destruction. Zavodskaya Laboratoriya, 8, 916-1004.
- Sosnovskiy, L.A. (1990) Cyclic Elasto-Plastic Fracture Diagram for a Specimen with a Crack and Its Basic Points. Vesty AS BSSR, series of phis.-tech. sciences, 2, 3-7.
- Sosnovskiy, L.A., Hamaza, L.A. and Babich, N.K. (1990) Experimental Research of Cyclic Crack Growth Resistance of Steel 20. Problems of Strength, 6, 34-38.
- Sosnovskiy, L.A. and Bogdanovich, A.V. (1995) The Analysis of Cyclic Elasto-Plastic Fracture Diagram for a Specimen with a Crack. Part 1. Problems of Strength, 5-6, 39-51.
- Sosnovskiy, L.A. and Bogdanovich, A.V. (1995) The Analysis of Cyclic Elasto-Plastic Fracture Diagram for a Specimen with a Crack. Part 2. Problems of Strength, 5-6, 52-61.
- Sosnovskiy, L.A. (1987) Statistical Mechanics of Fatigue Fracture. Science and Technics, Minsk.