World Journal of Condensed Matter Physics
Vol.1 No.4(2011), Article ID:8763,7 pages DOI:10.4236/wjcmp.2011.14019
Hydrogen Incorporation in Undoped ZnO Nanoparticles
![]()
Jurusan Fisika, Fakultas MIPA, Universitas Indonesia, Depok, Indonesia.
Email: *rosari.saleh@ui.ac.id
Received May 27th, 2011; revised June 10th, 2011; accepted June 20th, 2011.
Keywords: ZnO nanoparticles, Structural and optical properties, H bonding
ABSTRACT
Zinc Oxide nanoparticles in the size range of ~18 - 23 nm are prepared using wet chemical method. Hydrogen concentration in the samples was obtained by drying the precipitate at various temperatures. XRD pattern showed a single phase wurzite structure for ZnO nanoparticles. Average crystallite sizes and lattice parameters determined from XRD pattern showed a gradual increase with increasing dry temperature, while the lattice strain showed the opposite direction. Optical studies revealed the optical gap ranging from 3.05 - 3.24 eV. Hydrogen incorporation in the specimen was studied using infrared absorption measurement. Infrared absorption measurements revealed six hydrogen-related local vibrational modes in the wave number range from 2800 to 3600 cm–1. To remove hydrogen, some samples were annealed up to 800˚C. Infrared absorption measurements showed that the local vibational modes disappeared. This shows that the observed local vibrational modes are due to the presence of hydrogen. The results of XRD and optical studies will be correlated with the results obtained from infrared absorption measurements.
1. Introduction
Recently, a wide-band gap semiconductor has been receiving much attention due to its electronic, optical and piezoelectric properties at the nanoscale, leading to a wide range of optoelectronic applications [1-4]. The activity has intensified more recently because of the possibility that a wide-band gap semiconductor might be useful for spintronics or spin-base quantum computation [5,6]. ZnO nanoparticles are among one of wide-band gap semiconductor that possess extraordinary electronic and optical properties useful for optoelectronic devices and UV lasers [7-8]. The structure of ZnO nanoparticles is pivotal to the above potential applications. For example, it has been reported that the ZnO properties are heavily dependent on the size and morphology tailored by preparation conditions [9-12]. Most of ZnO nanoparticles were prepared by several high temperature methods such as vapor-phase transport, vapor-liquid-solid growth, vapor-phase epitaxy and template-assisted techniques along with some low-temperature routes such as wet chemical reactions and electrochemical techniques [13].
As grown, ZnO is almost always exhibits n type conductivity, with electrons in the conduction band as the charge carriers. The origin of this conductivity has been discussed for years and is still controversial. Traditionally, the nature of this conductivity has been attributed to native defects. However, Van de Walle [14] in his firstprinciples investigation, based on density functional theory suggested that the presence of hydrogen atom in ZnO can act as a shallow donor. This behavior is unexpected and very different from hydrogen’s role in other semiconductors, in which it acts only as a compensating center counteracting the prevailing conductivity. The presence of hydrogen in the crystal-growth is not surprising and it is very difficult to avoid its incorporation into the sample during the process of the crystal-growth. However, almost all optoelectronic applications require the control of the conductivity from n-type to p-type. Therefore, we believe that understanding hydrogen properties in ZnO is necessary not only for the academic point of view but also for semiconductor applications.
In this paper we present information on hydrogen bonding and hydrogen concentrations in ZnO nanoparticles synthesized using wet chemical method. To obtain various concentration of hydrogen in the nanoparticles the mixture was dried at various temperatures. The influence of dry temperature on hydrogen bonding, structural properties and optical properties are investigated using Infrared absorption, X-ray diffraction and UVvisible spectroscopy. Infrared absorption measurements reveal six hydrogen-related local vibrational modes in the wave number range between 2800 - 3600 cm–1. Through our study, we attempt to correlate the structural and optical properties with the hydrogen incorporation in the samples.
2. Experimental
For the synthesis of undoped ZnO nanoparticles in this study ZnSO4∙7H2O, 25% aqueous ammonia or NaOH were used which are procured from Aldrich. All of the chemicals used are GR grade without further purification. Analytical grade ZnSO4∙7H2O from Aldrich was dissolved in de-ionized water to get final concentration of 0.1 M. In this solution 0.1 M of NaOH solution was added gradually until the final pH of solution reached to 13. The solution was then stirred at temperature of 80˚C for 30 min until a milky white solution was obtained. After the reaction process, the solution was washed several times with de-ionized water and anhydrous alcohol to remove the by-product sodium sulfate (NaSO4). Then the solution was filtered. The mixture was aged at room temperature for 24 h. To obtain various concentration of hydrogen the mixture was dried at various temperatures (100˚C - 600˚C) for 4 h. Some samples were annealed up to 800˚C for 4 h to remove hydrogen. In order to study the hydrogen bonding configuration infrared absorption measurements were performed using a Shimadzu Fourier transform spectrometer. The structural characterization has been carried out by using a standard X-ray diffractometer (Philips PW1710) with monochromatic Cu-Kα (λ = 1.54060 Å) radiation operated at 40 kV and 20 mA in the range from 10˚ to 80˚. The calibration of the diffracttometer was done using Si powder. The XRD patterns of the nanoparticles were verified by comparison with the JCPDS data. The average size of precipitate crystallites was estimated by using the Scherrer peak broadening method. Optical characterizations were carried out by measuring the diffuse reflectance spectroscopy. All spectra were taken in the range of 250 - 800 nm using shimadzu UV-Vis spectrophotometer with integrating sphere attachment and spectralon reflectance standard.
3. Results and Discussion
The typical XRD patterns of the nanoparticles dried at various dry temperatures are shown in Figure 1. Structural change occurring in our nanoparticles could be seen with increasing dry temperature. The spectra are almost equal to the typical XRD spectra of ZnO nanoparticles reported from other experiments [15,16]. For each sample, all observed peaks can be indexed with the wurzite phase of ZnO with varying degree of crystallinity and crystallite size. In all our XRD patterns nine peaks are observed around 2Θ = 32.12, 34.48, 36.6, 47.76, 56.84, 63.02, 66.95, 68.23, 69.24 which correspond to (100), (002), (101), (102), (110), (103), (200), (112) and (201), respectively. It is found that there are no any other peaks due to the presence of other impurities. The values of lattice parameters calculated from XRD data by using the Rietveld refinement analysis are shown in Figure 2, respectively. The lattice parameters increases from a = b = 3.218 Å and c = 5.155 Å to a = b = 3.233 Å and c = 5.173 Å as the dried temperatures are increased from 100˚C to 600˚C. These results are consistent with those of bulk ZnO. However, a careful analysis of peak positions suggestive a small shifting in its value toward a lower 2Θ with increasing dry temperature, indicating a presence of compressive strain in the samples. It is also shown that for the entire samples the reflection peaks
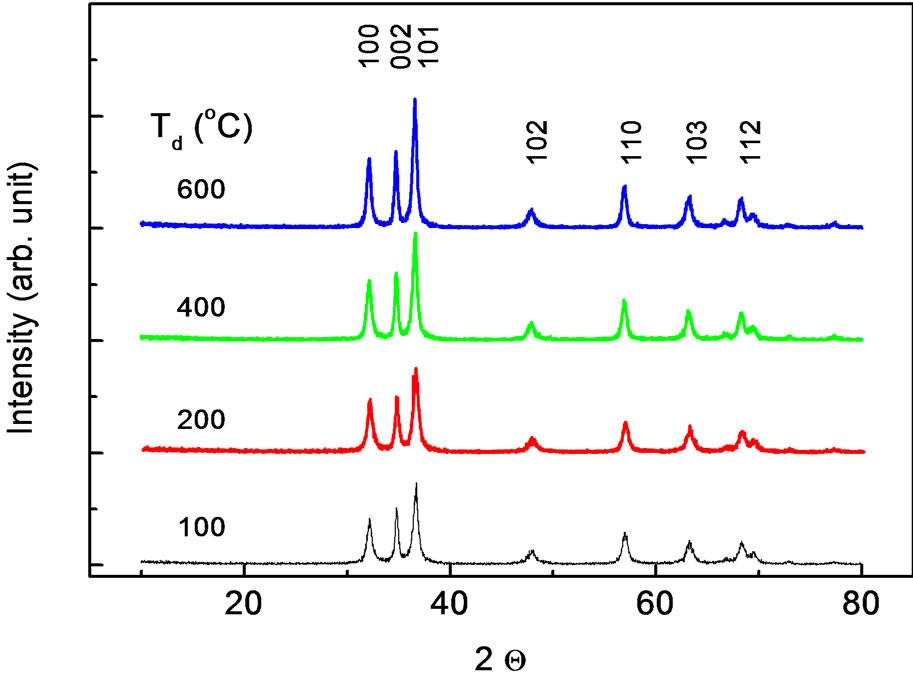
Figure 1. XRD pattern measured at room temperature for ZnO nanoparticles prepared at various dry temperatures.
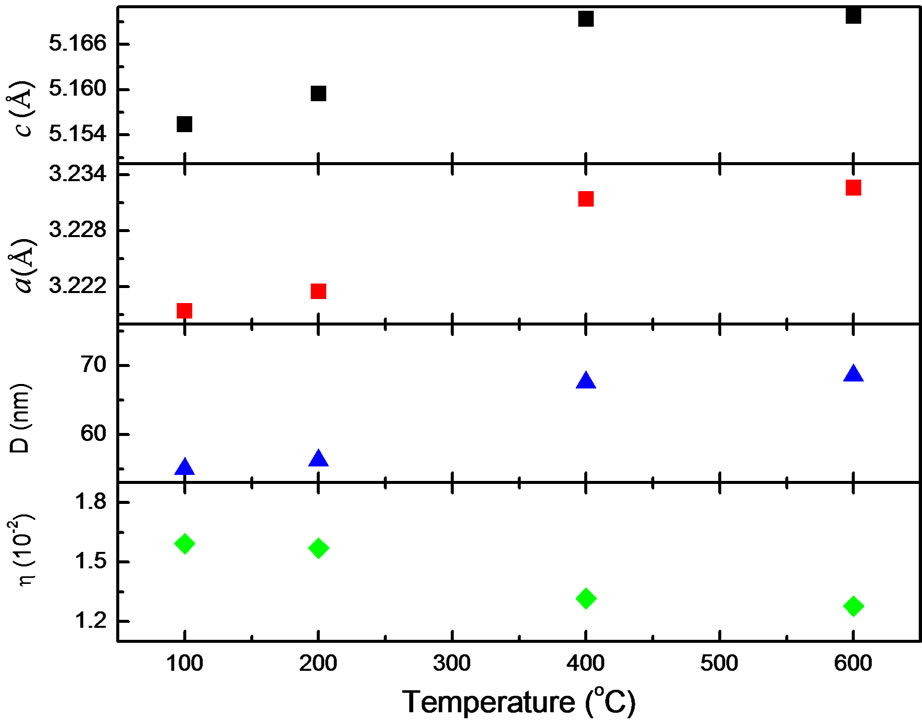
Figure 2. Lattice parameter c and a for hexagonal wurzite structure, average crystallite size D determined from XRD pattern, and strain h estimated from analysis of XRD pattern.
become sharper and the full width at half maximum (FWHM) are slightly decreased with increasing dry temperature, indicating the enhancement of crystallinity. The average crystallite size and strain of ZnO samples were calculated from the XRD data using the equation [17]: βcosθ = 0.89λ/D + ηsinθ where λ, β, θ, η and D represent the wavelength of the X-ray radiation, the FWHM, the diffraction angle, strain and average crystallite size, respectively. Using this equation we find that the average crystallite size increases from 18 to 23 nm, while the strain is decreasing as a dry temperature increased from 100˚C to 600˚C (Figure 2).
The structure of the samples was further investigated using infrared absorption measurements. Infrared spectra for sample prepared in various dry temperatures are plotted in Figure 3. Also shown is the infrared spectrum for the sample annealed at 800˚C for 4 h (curve e). For all spectra the background signal was subtracted from the original data. It is seen that the intensity of absorption peaks are decreased with increasing dry temperatures. In these spectral range six local vibrational modes at 2990, 3315, 3329, 3351, 3425 and 3572 cm–1 are observed. The peak positions were obtained by fitting the spectrum into six Gaussian lines (dash lines in the inset of Figure 3). However, the annealed sample did not reveal any local vibrational modes. This clearly demonstrated that the six local vibrational modes shown in Figure 3 (inset) are due to the presence of hydrogen.
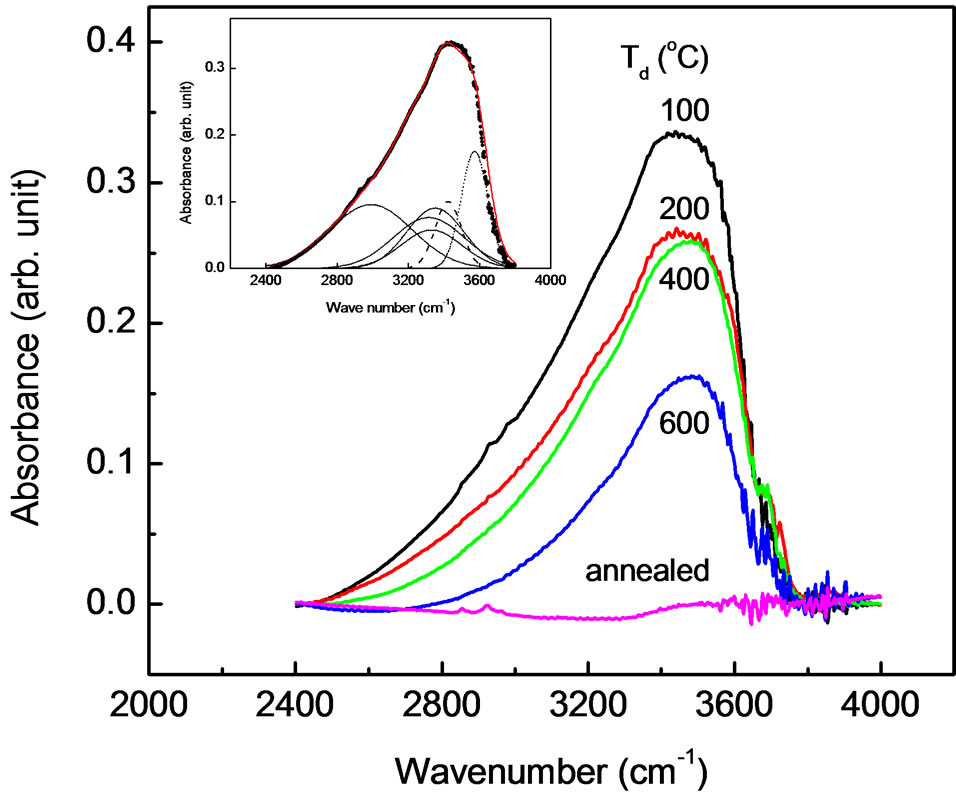
Figure 3. Infrared absorption spectra measured at room temperature for sample prepared in various dry temperatures. Also shown is the infrared spectrum for the sample annealed at 800˚C for 4 h. The inset shows the solid line that is represented a least-squares fit of six gaussian lines to the data (sample prepared at dry temperature 100˚C) and the dash lines that is indicated the individual local vibrational modes.
The presence of hydrogen in the crystal-growth environment is not surprising and very difficult to avoid its incorporation into the crystal during the process of crystal growth [18]. Local vibrational modes between 2800 and 3100 cm–1 have been observed in a number of semiconductor such as amorphous silicon carbon (a-SiC:H) [19], GaAs [20], and GaN [21]. In these materials the local vibrational modes are assigned to symmetric and antisymmetric C-H stretching modes. Therefore, the local vibrational mode located at 2988 cm–1 should be due to the stretching mode of C-H.
The theoretical work conducted by Van de Walle [14] showed that hydrogen is a shallow donor in ZnO. In his work based on first-principles density functional theory he calculated the formation energies and lattice relaxations for interstitial hydrogen in wurtzite as well as zinc-blende ZnO. He found that H+ is most stable in a bond center site (BC) that is not parallel to the c axis. An O-H bond is formed, pointing along the original O-Zn bond. H+ could also be accommodated in the corresponding oxygen anti bonding site (ABo). He also found that various configurations, in which hydrogen is located at a distance of ~1 Å from the oxygen host atom, are very close in energy. His results indicated that the strength of the O-H bond is the main driving force for stabilization of this configuration, while details of the hydrogen orientation and relaxations have only small effect on the energy. Although it is clear that H+ prefers to bind strongly with oxygen at a bond length of ~1 Å and with a local vibrational mode at 3550 cm–1, the details is still a matter of discussion [22]. Jokela and Mc Cluskey [23] observed a local vibrational mode at 3326 cm–1 in samples provided by Cermet and attributed to hydrogen donor in anti bonding configuration, which is not aligned along the c axis. Experiment by Lavrov et al. [24], on the other hand, revealed a different local vibrational mode at 3611 cm–1 in samples by Eagle-Picher. They assigned this local vibrational mode to hydrogen donor in bonding configuration, which is parallel to the c axis. Shi et al. [25] in their infra red absorption measurement on various ZnO samples demonstrated that the local vibrational modes at 3326 and 3611 cm–1 are revealed in different ratios of intensities depending on the type of the samples. They falso ound that the EaglePicher sample used by Lavrov et al. [24] show a strong local vibrational mode at 3611 cm–1 and a weak 3326 cm–1, whereas Cermet sample used by Jokela and Mc Cluskey [23] showed exactly the opposite. These results indicated that there exist two forms of O-H in these two samples [25]. Studies performed later by Lavrov et al. [26,27] concerned hydrogen related defect in hydrothermally grown ZnO and ZnO grown from vapor phase. They reported a number of hydrogen-related defects in both kinds of samples. Vapor phase ZnO sample showed three local vibrational modes at 3611.3, 3349 and 3312.2 cm–1, while in hydrothermally grown ZnO the situation is completely different. The local vibrational modes at 3611.3 cm–1 is assigned to a defect labeled H-I, that contains a single hydrogen atom, Based on polarization studies and first-principles calculations they proposed that H-I corresponds to an interstitial hydrogen atom at bonding configuration which is parallel to the c axis, while the local vibrational modes 3349.6 and 3312.2 cm–1 are associated with a defect labeled H-II that contains two inequivalent hydrogen atoms, one in an O-H bond roughly aligned with the c-axis and the other in an O-H that forms an angle of 100˚ with the c-axis. Later, this H-II is also identified as a hydrogenated Zn vacancy [24]. In as-grown hydrothermal ZnO, that is already contain hydrogen they found new local vibrational modes at 3335.6, 3482.9, 3516.3 and 3577.3 cm–1. Although the four new local vibrational modes observed in hydrothermally grown ZnO are located in the region characteristic of O-H stretch modes, but the nature of 3335.6, 3482.9, 3516.3 cm–1 remains unknown. Based on the isotope substitution experiments as well as on the polarization studies one additional local vibrational mode at 2644.4 cm–1 are detected. Moreover, the frequency ratio of the 3577.3 and 2644.4 cm–1 is 1.35, which is close to the value expected for a harmonic oscillator consisting of hydrogen atom bound to an oxygen atom. Therefore, they identified the 3577.3 cm–1 as one hydrogen atom bound in a defect, that primarily aligned with the c axis of the crystal. They labeled this defect as H-I*. By comparing our results with the results obtained in the literature [19,22-27], we believed that our LVMs at 3315 and 3351 cm–1 assigned to hydrogenated Zn vacancy saturated with two hydrogen atoms, while the LVMs at 3329 and 3572 cm–1 associated with hydrogen donor in anti bonding configuration and hydrogen located at H-I* defect, respectively.
The deconvolution of the infrared spectra shown in the inset of Figure 3 assigns a partial absorption to each vibrational mode of a specific hydrogen configuration. The basis for a quantitative analysis of the bonded hydrogen in the material is that the integrated partial absorptions are proportional to the densities of the hydrogen configuration contributing to that particular mode. Figure 4 shows the integrated absorption of local vibrational modes at 3315, 3329, 3351 and 3572 cm–1 as a function of dry temperature. The integrated absorption decreased up to about 30% as dry temperature is increased from 100 to 600˚C. This suggests that the dry temperature limits the incorporation of hydrogen atoms bonded in the samples. The figure shows temperature dependences of integrated absorption at 3315 and 3351 cm–1 are proportional each other, which confirmed that our LVM at 3315 and 3351 cm–1 belong to the same defect as suggested by Lavrov et al. [24]. The integrated absorptions at 3329 and 3572 cm–1 are however, 40% - 50% less compared to that of 3315 and 3351 cm–1. It follows also from the figure that the integrated absorption at 3329 cm–1 anneals out with increasing dry temperature, whereas the integrated absorption at 3572 cm–1 tends to saturate at higher dry temperature. A similar observation has already been reported by Lavrov et al. [26] who performed infrared absorption measurements on hydrothermally grown ZnO. They showed that the hydrogen atom bound in H-I* defect is relatively stable, even after annealing at higher temperatures.
Optical characterization was carried out by measuring the diffuse reflectance spectroscopy. All spectra were taken in the range of 200 - 800 nm. Figure 5 shows the diffuse reflectance spectra R as a function of wavelength for samples shown in Figure 1. Since our samples are powder, the low reflectance values in our spectra indicate high absorption in the corresponding wavelength region. The data collected at room temperature showed a clear difference between the samples in the region of 350 - 800 nm. The significance of this is more visible after applying the Kubelka-Munk function F(R) given by the relation F(R) = (1 – R)2/2R, where R is the magnitude of reflectance [28]. The optical gap (inset of Figure 5) was estimated from diffuse reflectance spectra by plotting the square of the Kubelka-Munk function F(R)2 as a function of energy. To obtained the optical gap the linear part of F(R)2 curve was extrapolated until it intersects the energy axis. The optical gap of ZnO dried at 100˚C determined by the above method to be 3.52 eV, which is higher than that for bulk ZnO (3.4 eV) [29]. The corresponding optical gaps are seen to be shifted to lower energies with increasing dry temperature. The corresponding optical
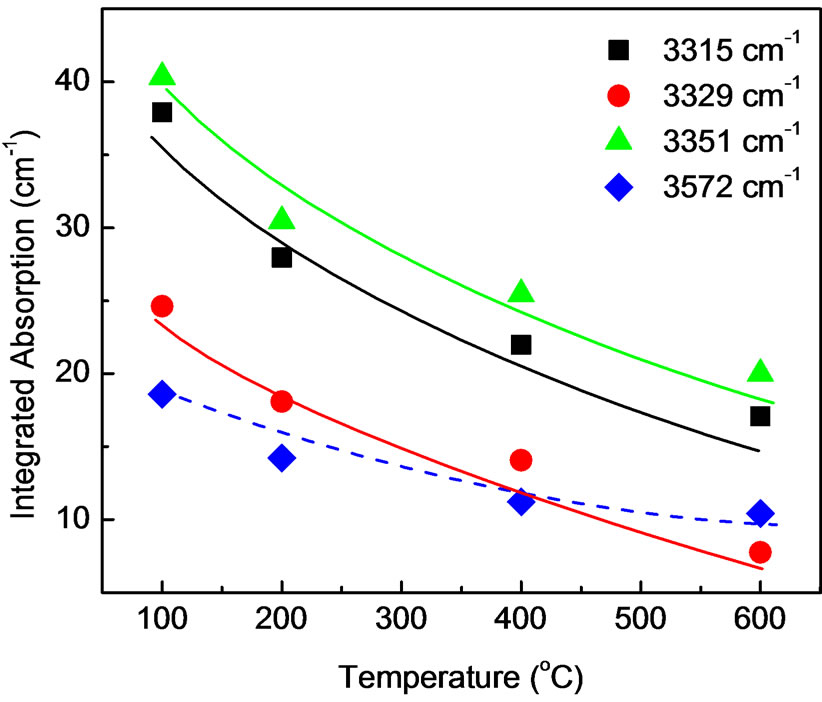
Figure 4. Integrated absorption of local vibrational modes at 3315, 3329, 3351 and 3572 cm–1 for ZnO nanoparticles prepared at various dry temperature.

Figure 5. UV-Vis diffuse reflectance spectra for ZnO nanoparticles prepared at various dry temperature. The inset shows the optical gap of ZnO nanoparticles as a function of dry temperature.
gaps are seen to be shifted to lower energies with increasing dry temperature. The variation follows the strain data obtained from analysis of XRD patterns in a direct relationship indicating that the variation in optical gap is related to structural change resulting from variation of dry temperatures. The variation of optical gap in ZnO has been observed by several authors [30,31], who is explained that the change in optical gap on the basis of variation of the average particle size. This explanation is also consistent with our observation plotted in Figure 2(c). However, Zheng et al. [11] found that the red shift in optical gap with increasing particle size may be related to the change in morphology. In addition they also showed that with increasing annealing temperature the band-edge absorption in ZnO nanoparticles begins at larger wavelength. They suggested that these results are due to the existence of more defect in the samples as annealing temperature is increased. Our results presented in Figure 4 demonstrated that hydrogen accommodate in H-I* defect as well as in Zn vacancy diffuse out of the samples with increasing dry temperature. These results suggested that more defects and vacanzies are created with increasing dry temperatures. Therefore, we believe that in our ZnO nanoparticles, the optical gap decrease not only due to the combine effect of strain and particle size, but also due to the incorporation of hydrogen in the samples. The presence of defect-hydrogen complexes in ZnO nanoparticles is one important aspect that has to be investigated further.
4. Summary
In summary, we performed X-ray diffraction, infrared absorption and UV-Vis measurements on undoped ZnO nanoparticles prepared using wet chemical methods. The X-ray diffraction resuts indicated that the synthesized ZnO nanoparticles have only the wurzite structure. Observed XRD pattern indicates strain in the ZnO lattice. Infrared absorption measurements revealed six local vibrational modes in the frequency range from 2800 to 3600 cm–1. The local vibrational modes are located at 2990, 3315, 3329, 3351, 3425 and 3572 cm–1. Annealing the specimen up to 800˚C resulted in out diffusion of hydrogen from the samples. After annealing of the samples all local vibrational modes disappeared. This clearly indicates that the local vibrational modes between 2800 - 3600 cm–1 are due to the presence of hydrogen. By comparing our results with the results obtained from other researchers [19,21-27], we believed that the local vibrational modes at 2990 and 3425 cm–1 are assigned to symmetric and antisymmetric C-H stretching modes and hydrogen stretching modes in ammonia molecules, respectively. The local vibrational modes located at 3315 and 3351 cm–1 are assigned to hydrogenated Zn vacancy saturated with two hydrogen atoms, while the LVMs at 3329 and 3572 cm–1 are associated with hydrogen donor in anti bonding configuration and hydrogen located at H-I* defect, respectively. In the visible spectral range, diffuse reflectance data showed changes in the spectra and absorption edges with increasing of dry temperature. The significance of this is more visible after applying the Kubelka-Munk function [28] to estimate optical gap. The corresponding optical gaps are seen to be shifted to lower energies with increasing dry temperature. Observed decrease in the optical gap follows a decrease in strain and hydrogen content in the samples, indicating that such decrease in optical gap could be related to the hydrogen incorporation in the samples.
REFERENCES
- K, Nomura, H. Ohta, K. Ueda, T. Kamiya, M. Hirano and H. Hosono, “Thin-Film Transistor Fabricated in SingleCrystalline Transparent Oxide,” Science, Vol. 300, No. 5623, 2003, pp. 1269-1272. doi:10.1126/science.1083212
- J. Sun and H.-T. Wang, “Ab Initio Investigations of Optical Properties of the High-Pressure Phases of ZnO,” Physical Review B, Vol. 71, No. 12, 2005, p. 125132. doi:10.1103/PhysRevB.71.125132
- M. H. Huang, S. Mao, H. Feick, H. Yan, Y. Wu, H. Kind, E. Weber, R. Russo and P. Yang, “Room-Temperature Ultraviolet Nanowire Nanolasers,” Science, Vol. 292, No. 5523, 2001, pp. 1897-1899. doi:10.1126/science.1060367
- C. T. Lee, Y. K. Su and H. M. Wang, “Effect of r.f. Sputtering Parameters on ZnO Films Deposited onto GaAs Substrates,” Thin Solid Films, Vol. 150, No. 2-3, 1987, pp. 283-289. doi:10.1016/0040-6090(87)90101-5
- B. M. Choudary, R. S. Mulukutla and K. J. Klabunde, “Benzylation of Aromatic Compounds with Different Crystallites of MgO,” Journal of American Chemical Society, Vol. 125, No. 8, 2003, pp. 2020-2021. doi:10.1021/ja0211757
- N. J. Harmon, W. O. Putikka and R. Joynt, “Theory of Electron Spin Relaxation in ZnO,” Physical Review B, Vol. 79, No. 11, 2009, p. 115204. doi:10.1103/PhysRevB.79.115204
- M. Rajalakshmi, A. K. Arora, B. S. Bendre and S. Mahamuni, “Optical Phonon Confinement in Zinc Oxide Nanoparticles,” Journal of Applied Physics, Vol. 87, No. 5, 2000, p. 2445. doi:10.1063/1.372199
- C. L. Yang, J. N. Wang, W. K. Ge, L. Guo, S. H. Yang and D. Z. Shen, “Enhanced Ultraviolet Emission and Optical Properties in Polyvinyl Pyrrolidone Surface Modified ZnO Quantum Dots,” Journal of Applied Physics, Vol. 90, No. 9, 2001, p. 4489. doi:10.1063/1.1406973
- T. Dietl, H. Ohno, F. Matsukura, J. Cibert and D. Ferrand, “Zener Model Description of Ferromagnetism in ZincBlende Magnetic Semiconductors,” Science, Vol. 287, No. 5455, 2000, pp. 1019-1022. doi:10.1126/science.287.5455.1019
- A. B. Djurisic, Y. H. Leung, K. H. Tam, L. Ding, W. K. Ge and H. Y. Chen, “Green, Yellow, and Orange Defect Emission from ZnO Nanostructures: Influence of Excitation Wavelength,” Applied Physics Letter, Vol. 88, No. 10, 2006, p. 103107. doi:10.1063/1.2182096
- Y. Zheng, Y. Cheng, Y. Wang, F. Bao, L. Zhou, X. Wei, Y. Zhang and Q. Zheng, “A Theoretical Study of the IonMolecule Chemistry of K+·X Complexes (X = O, O2, N2, CO2, H2O):
 Implications for the Upper Atmosphere,” Journal Physical Chemistry B, Vol. 110, No. 7, 2006, pp. 3093-3097. doi:10.1021/jp056617q
 - Y. Zheng, Y. Cheng, Y. Wang, L. Zhou, F. Bao and C. Jia, “Metastable γ-MnS Hierarchical Architectures:
 Synthesis, Characterization, and Growth Mechanism,” Journal Physical Chemistry B, Vol. 110 , No. 16, 2006, pp. 8284-8288. doi:10.1021/jp060351l
 - Y. Zheng, C. Chen, Y. Zhan, X. Lin, Q. Zheng, K. Wei, J. Zhu and Y. Zhu, “Luminescence and Photocatalytic Activity of ZnO Nanocrystals:
 Correlation between Structure and Property,” Inorganic Chemistry, Vol. 46, No. 16, 2007, pp. 6675-6682. doi:10.1021/ic062394m
 - C. G. Van de Walle, “Hydrogen as a Cause of Doping in Zinc Oxide,” Physical Review Letter, Vol. 85, No. 5, 2000, pp. 1012-1015. doi:10.1103/PhysRevLett.85.1012
- P. K. Giri, S. Bhattacharyya, D. K. Singh, R. Kesavamoorthy, B. K. Panigrahi and K. G. M. Nair, “Correlation between Microstructure and Optical Properties of ZnO Nanoparticles Synthesized by Ball Milling,” Journal of Applied Physics, Vol. 102, No. 9, 2007, p. 093515. doi:10.1103/PhysRevLett.85.1012
- D. Gao, Z. Zhang, J. Fu, Y. Xu, J. Qi and D. Xue, “Room Temperature Ferromagnetism of Pure ZnO Nanoparticles,” Journal of Applied Physics, Vol. 105, No. 11, 2009, p. 113928. doi:10.1063/1.3143103
- A. Thurber, K. M. Reddy, V. Shutthanandan, M. H. Engelhard, C. Wang, J. Hays and A. Punnoose, “Ferromagnetism in Chemically Synthesized CeO2 Nanoparticles by Ni Doping,” Physical Review B, Vol. 76, No. 16, 2007, p. 165206. doi:10.1103/PhysRevB.76.165206
- N. H. Nickel and K. Fleischer, “Hydrogen Local Vibrational Modes in Zinc Oxide,” Physical Review Letter, Vol. 90, No. 19, 2003, p. 197402. doi:10.1103/PhysRevLett.90.197402
- R. Saleh, L. Munisa and W. Beyer, “Infrared Absorption in a-SiC:H Alloy Prepared by d.c. Sputtering,” Thin Solid Films, Vol. 426, No. 1-2, 2003, pp. 117-123. doi:10.1016/S0040-6090(03)00003-8
- M. O. Manasreh, J. M. Baranowski, K. Pakula, X. X. Jiang and J. Lin, “Localized Vibrational Modes of Carbon-Hydrogen Complexes in GaN,” Applied Physics Letter, Vol. 75, No. 5, 1999, p. 659. doi:10.1063/1.124473
- D. M. Joseph, R. Balagopal, R. F. Hicks, L. P. Sadwick and K. L. Wang, “Observation of Carbon Incorporation during Gallium Arsenide Growth by Molecular Beam Epitaxy,” Applied Physics Letter, Vol. 53, No. 22, 1988, p. 2203. doi:10.1063/1.100281
- M. D. McCluskey and S. J. Jokela, “Defects in ZnO,” Journal of Applied Physics, Vol. 106, No. 7, 2009, p. 071101. doi:10.1063/1.3216464
- S. J. Jokela and M. D. McCluskey, “Structure and Stability of O-H Donors in ZnO from High-Pressure and Infrared Spectroscopy,” Physical Review B, Vol. 72, No. 11, 2005, p. 113201. doi:10.1103/PhysRevB.72.113201
- E. V. Lavrov, J. Weber, F. Börnnert, C. G. Van de Walle and R. Helbig, “Hydrogen-Related Defects in ZnO Studied by Infrared Absorption Spectroscopy,” Physical Review B, Vol. 66, No. 16, 2002, p. 165205. doi:10.1103/PhysRevB.66.165205
- G. A. Shi, M. Stavola, S. J. Pearton, M. Thieme, E. V. Lavrov and J. Weber, “Hydrogen Local Modes and Shallow Donors in ZnO,” Physical Review B, Vol. 72, No. 19, 2005, p. 195211. doi:10.1103/PhysRevB.72.195211
- E. V. Lavrov, F. Börnnert and J. Weber, “Zinc Oxide—A Material for Microand Optoelectronic Applications,” In N. H. Nickel and E. Terukov, Eds., Nato Science Series, Springer, 2005, p. 133.
- E. V. Lavrov, F. Börnnert and J. Weber, “Dominant Hydrogen-Oxygen Complex in Hydrothermally Grown ZnO,” Physical Review B, Vol. 71, No. 3, 2005, p. 035205. doi:10.1103/PhysRevB.71.035205
- M. Naeem, S. K. Hasanain and A. L. Mumtaz, “Electrical Transport and Optical Studies of Ferromagnetic Cobalt Doped ZnO Nanoparticles Exhibiting a Metal-Insulator Transition,” Journal of Physics: Condensed Matter, Vol. 20, No. 2, 2008, p. 025210. doi:10.1088/0953-8984/20/02/025210
- A. Parra-Palomino, O. Perales-Perez, R. Singhal, M. Tomar, J. Hwang and P. M. Voyles, “Structural, Optical, and Magnetic Characterization of Monodisperse Fe-Doped ZnO Nanocrystals,” Journal of Applied Physics, Vol. 103, 2008, p. 07D121.
- L. Irimpan, V. P. N. Nampoori, P. Radhakrishnan, B. Krishnan and A. Deepthy, “Size-Dependent Enhancement of Nonlinear Optical Properties in Nanocolloids of ZnO,” Journal of Applied Physics, Vol. 103, No. 3, 2008, p. 033105. doi:10.1063/1.2838178
- R. Al-Gaashani, S. Radiman, N. Tabet and A. R. Daud, “Effect of Microwave Power on the Morphology and Optical Property of Zinc Oxide Nano-Structures Prepared via a Microwave-Assisted Aqueous Solution Method,” Materials Chemistry and Physics, Vol. 125, No. 3, 2011, pp. 846-852. doi:10.1016/j.matchemphys.2010.09.038