Atmospheric and Climate Sciences
Vol.3 No.2(2013), Article ID:30766,9 pages DOI:10.4236/acs.2013.32019
GOSAT CH4 and CO2, MODIS Evapotranspiration on the Northern Hemisphere June and July 2009, 2010 and 2011
Geophysical Institute, University of Alaska Fairbanks, Fairbanks, USA
Email: reginald.muskett@gmail.com
Copyright © 2013 Reginald R. Muskett. This is an open access article distributed under the Creative Commons Attribution License, which permits unrestricted use, distribution, and reproduction in any medium, provided the original work is properly cited.
Received December 15, 2012; revised January 17, 2013; accepted January 26, 2013
Keywords: GOSAT; CH4; CO2; MODIS; Evapotranspiration; Wildfire
ABSTRACT
The Greenhouse gases Observing Satellite (GOSAT) affords an ability to assess and monitor CH4 and CO2 near-surface atmospheric concentrations globally on monthly scales pertaining to biogeochemical cycles and anthropogenic emissions. In addition to GOSAT our investigation incorporates global-monthly estimates of evapotranspiration (ET) from the Moderate Resolution Spectroradiometer (MODIS) and fire/wildfire locations for correspondence and comparison. We restrict the investigation to the months of June and July in years 2009, 2010 and 2011. After processing and assessment on the northern hemisphere we focus on two regions in Eurasia for interrogation: 40˚ to 80˚E by 50˚ to 58˚N and 100˚ to 140˚E by 50˚ to 58˚N. The regions allow for contrasting regional settings, an agricultural-industrial-urban west-region to a boreal-steppe discontinuous permafrost zone palsa and thaw lake east-region. Joint probability density functions allow us to identify significant modes, the highest probable values of background levels of CH4 and CO2 to ET and develop regressions for correlated relationships. We found that background levels of CH4, CO2 and ET were not affected by the wildfires of 2010. Regressions indicate significant inverse relationships of CH4 and CO2 to ET in the west-region and no significant relationships in the east-region. The east-region shows significantly higher background levels of CH4, CO2 and ET owing to the heterogeneity of ecosystems, hydrology, physical processes and terrain in the discontinuous permafrost zone of the central Siberian Plateau.
1. Introduction
Addressing the uncertainties in near-surface atmospheric CH4 and CO2 sources and sinks is a task that space-based remote sensing has engaged in recent years to complement and extend ground-based sensing methods. GOSAT a joint project by the Japan National Institute of Environmental Studies, the Japan Ministry of Environment and the Japan Aerospace Exploration Agency (JAXA) employs dual-channel Fourier transform spectrometry to measure dry-air concentrations of CH4 and CO2 globally since launch in early 2009 [1].
CH4 and CO2 are constituents of the Earth’s atmosphere. Their concentrations derive from physical processes of long-lived biogeochemical cycles on lands and in oceans. Additionally variations in their concentration owe to anthropogenic activities since wide spread industrialization in the 19th century. Their affects on the Earth’s near-surface energy budget, i.e. greenhouse gases warming, have been speculated, postulated and debated extensively [2-5].
Our purpose is to investigate correspondences of background levels of CH4, CO2 and ET through joint probability density functions and develop regressions for correlated relationships. We compose and co-geolocate the datasets on the northern hemisphere, and then focus on two regions of interest in Eurasia during June and July 2009, 2010 and 2011. We test a hypothesis that the wildfires in the summer of 2010 affected background levels of CH4, CO2 and ET on a regional and hemispheric basis.
2. Data and Methods
2.1. GOSAT
Launched and operating since January 2009 the Greenhouse gases Observing Satellite (GOSAT) has been providing global estimates of the column average dry air mole fractions of CH4 and CO2 [1]. The GOSAT sensing instrument is the Thermal and Near Infrared Sensor for Carbon Observations (TANSO) Fourier Transform Spectrometer (FTS). TANSO-FTS exploits absorption band characteristics of backscatter sunlight from surface and atmosphere in two channels: a spectral interferometer. The spectral resolution of TANSO-FTS is 0.3 cm. The nadir footprint radius is about 5 km. A second instrument the TANSO-Cloud and Aerosol Imager (CAI) observes surface and atmosphere reflectance in the shortwave and near infrared to provide cloud screening flags at several hundred points within a FTS footprint. Vertical profiles of pressure, temperature and humidity together with surface pressure and wind speed are taken from European Center for Medium-Range Weather Forecasts. Surface elevation data (within the FTS footprint) are taken from the GTOPO30 database.
The retrieval algorithm uses a radiative transfer inverse method based on Phillips-Tikhonov regularization and the L-curve method to estimate retrieval parameters to simultaneously derive near surface and atmosphere column average concentrations of CH4 and CO2 [1]. The algorithm uses radiances in 4 spectral windows cover the O2A-band, weakly absorbing CO2 band, CH4 band and strongly absorbing CO2 band. Retrieval parameters are in 12-layer vertical profiles of CH4 and CO2 column number and total number density of H2O (interfering absorber) and scattering-spectral shift parameters.
During April 2009 through July 2010 validation campaigns were performed using six Total Carbon Column Observing Network (TCCON) sites that use groundbased FTS: two in Australia, Europe and North America. Bias in CH4 is −0.3% ± 0.26% and in CO2 is −0.05% ± 0.37%, on average.
GOSAT TANSO-FTS by design has a critical dependence on solar angle and cloud (contamination by meteorological cloud water vapor) that reduces the number of reliable CH4 and CO2 retrievals in the high latitudes. Therefore we limit our time period of interest to June and July 2009, 2010 and 2011 to obtain the maximum number of retrievals. From the files we extract geolocation information (latitude-longitude relative to the WGS-84 reference ellipsoid), concentration of CH4 and CO2 in ppb and ppm, respectively, and the standard error values.
June and July retrievals across the northern hemisphere 40˚N latitude and higher are irregular grids which become sparse at 70˚N. We apply a least squares Green’s Function interpolation such that the original concentration values per geolocation are constraints to produce regular equal-area projection grids at 5 km intervals [6]. The resultant CH4 and CO2 mixing ratios (concentrations) and standard error grids are shown in Figure 1. Grayareas indicate no data. The oceans are masked; generally too few data for reliable processing. Values on Greenland are mostly artifacts from too few data at times.
2.2. MODIS
Proto-Flight Model and Flight Model 1 of the Moderate Resolution Imaging Spectroradiometer (MODIS) operate onboard the NASA-Terra launched in December 1999 and NASA-Aqua launched in May 2002, respectively [7]. The orbits of Terra and Aqua are near polar and sun synchronous. They acquire reflectance and radiance (atmosphere and surface) in the optical through thermal portion of the electromagnetic spectrum in 36 bands. Spatial (nadir) resolutions are from 250 m, 500 m and 1 km. Terra acquires its data with equator crossing times of 10:30 (daytime) with repeat pass 22:30 (nighttime). Aqua acquires its data with equator crossing times of 13:30 (daytime) with repeat pass 01:30 (nighttime). Both instruments have a viewable swath width of 2330 km. Temporal resolutions of the MODIS products are 1-day, 8-day, 16-day, 1-month, 4-month and 1-year. Detailed information can be found online at the Land Processes Distributed Active Archive Center USGS website1.
2.3. MODIS Fire Information for Resource Management System (FIRMS)
MODIS FIRMS produces daily near-real time and science quality fire location hotspots data from standard MODIS MOD14 (Terra) and MYD14 (Aqua) Fire and Thermal Anomalies products, Level 3 version 5 [8]. The fire detection algorithm of MOD14/MYD14 (version 2.4 as of Oct. 2006) uses radiances in thermal 4 μm (two channels) and 11 μm (one channel) for fire detection relative to background brightness temperature, 0.65, 0.68 and 2.1 μm water-body (glint false alarm rejection) and 11 and 12 μm for fire/cloud masks [9]. Daily FIRMS products of hotspot locations give the detection thermal brightness temperature in Kelvin, probability of detection quality flag and geolocations given by latitude and longitude relative to the WGS-84 reference ellipsoid.
Validation campaigns have been carried out globally since 2000 using co-located thermal images from ASTER, Landsat 5/7 and Geostationary Operational Environment Satellites (GOES) for example [10]. On a global basis estimated commission errors vary with scan angle from 1.5% up to 8%. Commission errors in dense vegetation equatorial regions can approach 35% [11].
Our processing of the MODIS FIRMS data takes the daily detection files to produce June and July month fire-spot sums at 1 km resolution on the northern hemisphere, Figure 2. This gives us a monthly landscape and regional fire-spot geolocations for comparison to the GOSAT and other MODIS monthly datasets.
2.4. MODIS Evapotranspiration
The Global Terrestrial Evapotranspiration Data Set project of the Numerical Terradynamic Simulation Group at the University of Montana Collage of Forestry produces
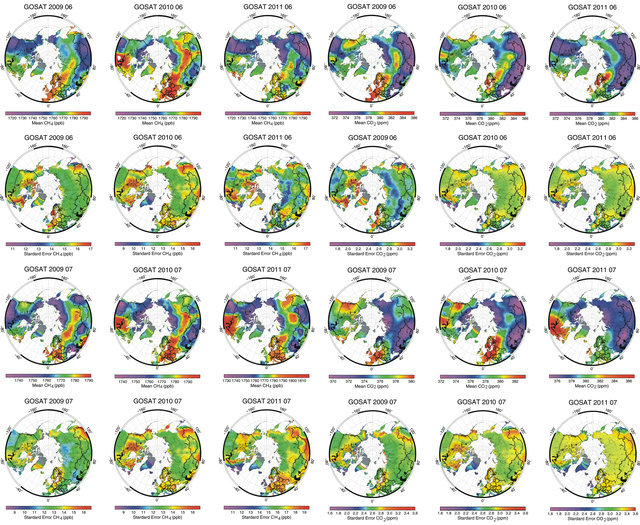
Figure 1. GOSAT mean CH4 and CO2 mixing ratio (concentrations) and standard error (ppm) fields during June and July 2009-2011.
the MODIS MOD16 product Global Terrestrial Evapotranspiration for the NASA2. Files contain derived evapotranspiration (ET, mm/mo) and include latent heat flux (LE), potential ET and potential LE with quality control flags. The time period covered begins January 2000 and continues through the current year with about one to two month processing lag. Spatial resolution is 1 km with temporal resolution at 8-day, 1-month and 1-year intervals. Geolocation information is relative to the WGS-84 reference ellipsoid.
Since 2012 MOD16 ET is derived algorithmically based on the Penman-Monteith equation [12]. The algorithm derived ET includes surface evapotranspiration from vegetation stomata, evaporation from moist and wet soil, evaporation from open water bodies and evaporation of rain water on vegetation. During winter monthsevaporation from surface snow is included in ET. Cloud contamination estimates derive from albedo and fraction of photosynthetic available radiation/leaf area index (FPAR/LAI) MODIS inputs. Validations have been performed using available tower eddy covariance observations at FLUXNET stations. Correlation of tower measurements with the current version of the algorithm shows R = 0.86 with the distribution centered on the 1:1 line. Errors in tower measured eddy covariance can themselves be as great as 30%. This arises from problems in the energy balance closure at tower sites and scaling issues when estimating landscape scale ET from specific and sparse site measurements.
Our processing of the monthly MOD16 files extracts ET and geolocation values into equal-area projection grids. We co-geolocate the GOSAT and MODIS grids on the WGS-84 reference ellipsoid. This is to ensure that for any geolocation there are paired ET rates, CH4 and CO2
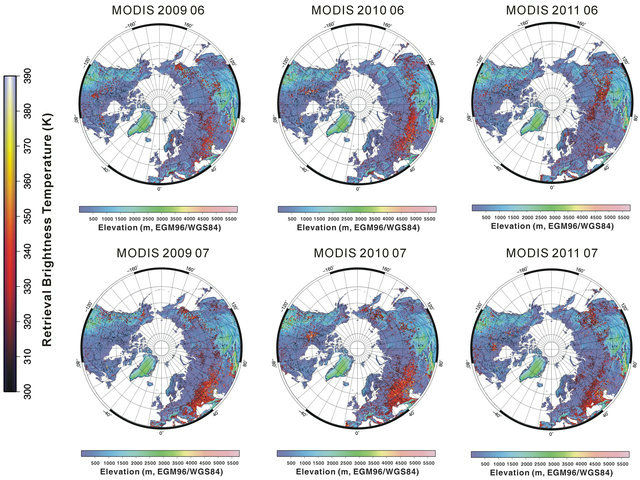
Figure 2. MODIS FIRMS fire hotspot retrievals (K, 1 km resolution) during June and July 2009-2011 projected on the ACE2 DEM (1 km resolution).
concentrations. The MODIS ET grids are shown in Figure 3.
2.5. Regions of Interest in Eurasia
Our investigation focuses on two regions of Eurasia: west-region 40˚ to 80˚E by 50˚ to 58˚N and east-region 100˚ to 140˚E by 50˚ to 58˚N. The west-region includes agricultural, industrial and urban area of Moscow and drained peatlands. The east-region is within the southern portions of the central Siberian Plateau and including heterogeneous terrains of the discontinuous permafrost zone, palsa and thermokarst lakes, and southern boreal and steppe ecosystems.
Wildfires are visually spectacular and physically dynamic events. We use these regions to investigate the wildfire events in June-July 2010 relative to 2009 and 2011 for affecting regional CH4 and CO2 levels, i.e. background concentration levels. We state this as a hypothesis to test: Did regional background levels of CH4, CO2 and ET change in response to the June-July wildfires in Russia.
3. Results
Within the eastand west-regions we extract up to 299,800 co-geolocated CH4 and CO2 concentrations and ET rates in months June and July 2009, 2010 and 2011 and extract fire/wildfire hotspots. We then compute joint probability density functions of CH4 with ET and CO2 with ET. The joint probability density functions allow us to isolate the dominant mode, the most likely co-geolocated levels. We then compute least squares regression of the modes of CH4 and ET with CO2 with ET. We further plot the co-geolocation standard deviations of the dominant modes. This allows for evaluation of the test hypothesis.
3.1. Fire/Wildfire Hotspots
Table 1 shows the counts of MODIS FIRMS fire/wildfire hotspots (1 km) in the eastand west-regions for June and July 2009, 2010 and 2011.
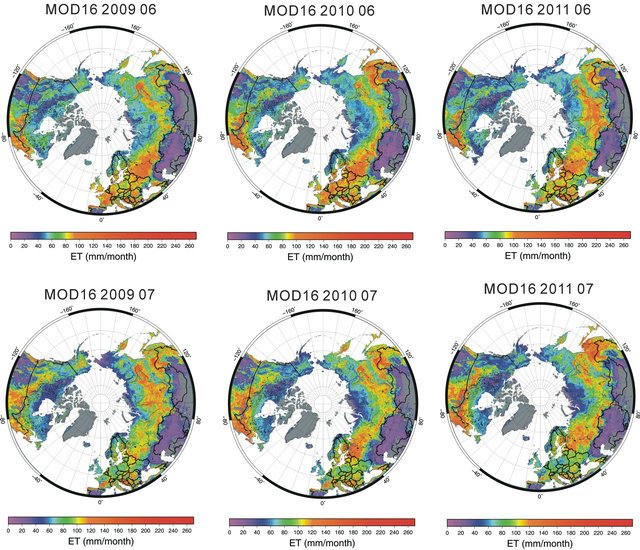
Figure 3. MODIS Evapotranspiration (mm/month) fields during June and July 2009-2011.
Table 1. Counts of fire/wildfire hotspots from MODIS FIRMS for regions 40˚ to 80˚E by 50˚ to 58˚N (West) and 100˚ to 140˚E by 50˚ to 58˚N (East).
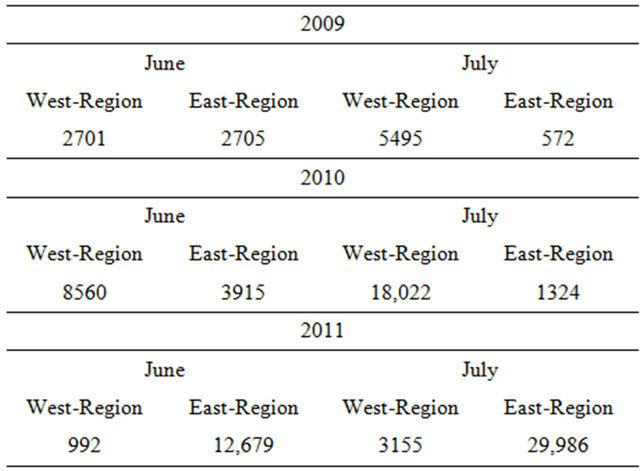
July counts in the west-region are greater by a factor of two above counts in June. In the east-region, July counts are lower by more than a factor of two than counts in June for years 2009 and 2010. In year 2011 the eastregion July count is greater by a factor of two compared to the June count.
3.2. Joint Probability Density Functions
Figures 4 shows the joint probability density functions of CH4 with ET and CO2 with ET. The distribution change by month and year as well as the dominant modes, which represent values of co-geolocated CH4 with ET and CO2 with ET that are the most likely.
On inspection the dominant modes correspond to regional background levels of CH4, CO2 and ET. Dominant modes do not correspond to any co-geolocated event or group of events such as a wildfire hotspot or industrial
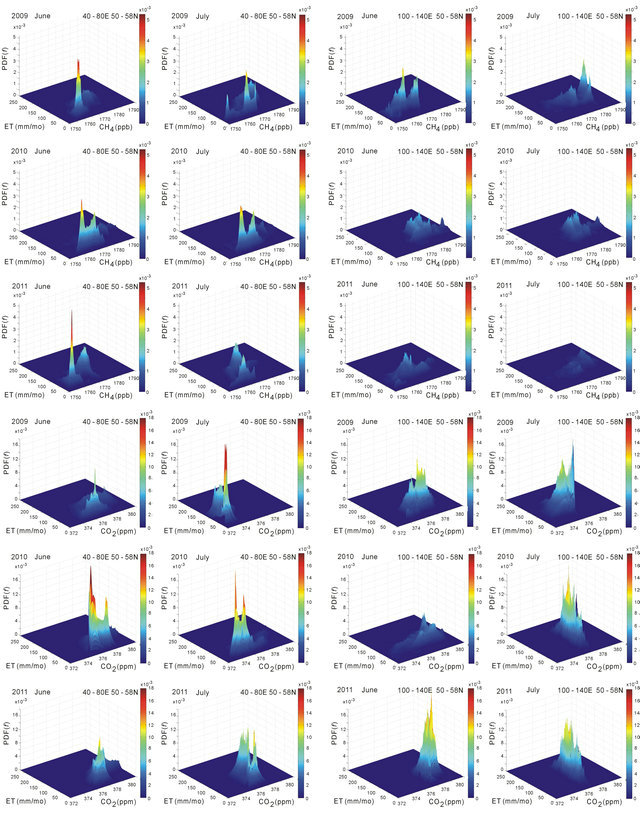
Figure 4. Joint probability density functions of MOD16 evapotranspiration (mm/month) and GOSAT CH4 concentrations (ppb) and CO2 concentrations (ppm), June 2009-2011 and July 2009-2011 in the region 40˚ to 80˚E by 50˚ to 58˚N and 100˚ to 140˚E by 50˚ to 58˚N.
site (such as a coal-fire powered electrical generation facility, or a city in general). Events lend themselves to the spread of the probability distribution and have much lower probability, i.e. less significance.
3.3. Regressions of Dominant Modes
We next isolate the dominant modes in their values of CH4 ET and CO2 ET and plot these in Figure 5. Table 2 also gives the values with their mode standard deviations. Modes occurring in the regions of interest are identified by symbol and the month is identified by color.
The west-region, which includes Moscow and locations of the 2010 fires show strong R2 values. The regressions indicate inverse relationships of CH4 to ET and CO2 to ET in time of month and year. This equates low CH4 and CO2 concentrations to high ET rates.
The east-region, which includes much of Siberia and includes boreal and steppe ecosystems, locations wildfire activity and very numerous peatlands-wetlands and palsa and thermokarst lakes show very weak R2 values. Significant forward or inverse relationships of CH4 to ET and CO2 to ET are not indicated.
The spread of the dominant modes of CH4 ET and CO2 ET are much greater for the east-region than for the westregion. This is an expression of the heterogeneity of ecohydrologic systems, the discontinuous permafrost zone and the varied physical processes and terrain governing CH4 and CO2 concentrations and ET rates.
3.4. Standard Deviations of Dominant Modes
Figure 6 shows the standard deviation comparison plot

Figure 5. Regressions of dominant modes from joint probability density functions of MODIS Evapotranspiration (ET, mm/mo) with GOSAT CH4 (ppb) and CO2 (ppm) in regions 40˚ - 80˚E by 50˚ - 58˚N (Square) and 100˚ - 140˚E by 50˚ - 58˚N (Triangle) during June (yellow) and July (red), 2009, 2010 and 2011.
Table 2. Dominant modes and standard deviations of joint probability density functions of GOSAT CH4 and CO2 with MODIS Evapotranspiration (ET) during June and July 2009, 2010 and 2011 in west and east regions.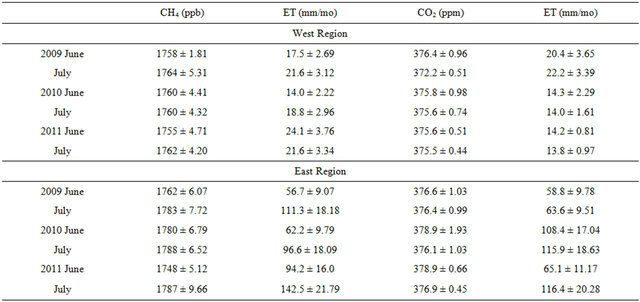
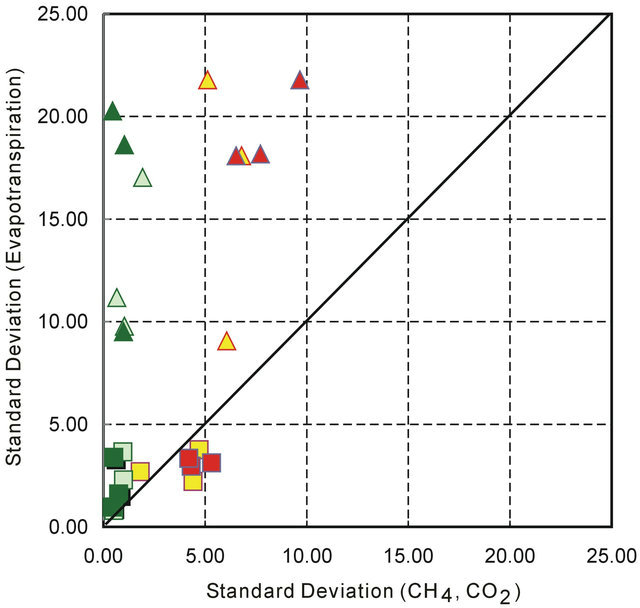
Figure 6. Standard deviation plot of dominant modes of GOSAT-derived CH4, CO2 to MODIS-derived Evapotranspiration in June (yellow, light green), July (red, dark green) of 2009, 2010 and 2011 in regions 40˚ - 80˚E by 50˚ - 58˚N (Square) and 100˚ - 140˚E by 50˚ - 58˚N (Triangle).
of the co-geolocated joint probability density function dominant modes. The standard deviations of the dominant modes in the west-region have restricted ranges and plot close to the 1:1 line near the origin. The east-region, while having a similar range in standard deviation CH4 and CO2 has a much larger range in standard deviation of ET.
This indicates that physical processes governing CH4, CO2 concentrations and ET rates in the west-region are different than those of the east-region. The background levels of CH4 and CO2 concentrations remain near constant, with some variation over June-July of 2009, 2010 and 2011. Evidence supports an inverse relationship of CH4 and CO2 concentrations to ET rates in the west-region.
4. Discussion
In the summer of 2010 numerous media outlets including companies and governments in Europe and North America reported on the visually spectacular fires in southwest Russia particularly those southeast of Moscow3. There were many reported impacts to local air quality, and problems associated with the summer “heat wave” that accompanied the fires of that year [13].
Our investigation focus is on comparison and interrogation of GOSAT and MODIS datasets at both fine scale (landscape) and course scale (regional to hemispheric). Our analysis shows correspondence of increase-regions of CH4, CO2 concentrations and ET rates during June and July 2009, 2010 and 2011. These increase-regions have correspondence to active-fire (wildfire, including forest and steppe and peatlands-wetlands including palsa and thermokarst lakes) during the same months and years. Fire/wildfire counts in June and July 2009, 2010 and 2011 show variations of a factor of two. The west-region in general has higher fire/wildfire counts in July 2010. The highest count of fire/wildfire occurs in July 2011 in the east-region. CH4, CO2 concentrations and ET rates are significantly higher in the east-region (Siberia) relative to the west-region (agricultural, industrial and urban) and during June and July in 2010, on average. Standard deviations of CH4 and CO2 concentrations occupy a narrow range in both regions of interest. Standard deviations of ET rates are much broader in the east-region relative to the west-region. This and the higher values of CH4, CO2 and ET point to heterogeneous ecosystems, hydrology including palsa and thermokarst lake processes, discontinuous permafrost zone, terrain of the east-region relative to the west-region. The east-region is well known for its long history of lightning ignited wildfires within larch-dominated communities of the central Siberian Plateau [14].
On average, background levels of CH4, CO2 concentrations and ET rates are not significantly perturbed during June-July 2010 relative to 2009 and 2011. This points to the buffering capacity of the lower atmosphere and terrestrial ecosystems [15-17]. Therefore, evidence does not at this time support the test hypothesis. In conclusion the fires and wildfires of summer 2010 did not significantly affect regional or hemispheric and multi-year background levels of CH4, CO2 concentrations and ET rates.
5. Conclusion
We investigate the correspondence of GOSAT CH4 and CO2 near-surface concentrations and standard errors to MODIS ET rates and fire/wildfire hotspots on the northern hemisphere during June-July 2009, 2010 and 2011. Our month-year time frame is constrained by the sunangle and cloud-free requirements of the Fourier Transform Spectrometer, spectral interferometer TANSO-FTS sensor onboard GOSAT. After processing our datasets to 5 km resolution we focus on two regions in Eurasia for analysis: west-region 40˚ to 80˚E by 50˚ to 58˚N and east-region 100˚ to 140˚E by 50˚ to 58˚N. Joint probability density functions identify significant dominant modes of CH4 and CO2 concentrations to ET rates. Evidence indicates that background levels of CH4 and CO2 are specific to each region and that these levels are near constant across the month-by-year observations. The westregion (agricultural, industrial and urban) shows strongly correlated inverse relationships of CH4 and CO2 concentrations to ET rates. CH4, CO2 concentrations and ET rates in the east-region have significantly greater levels than those in the west-region. In the east-region (Siberia) evidence shows no relationships (forward or inverse) of CH4 and CO2 concentrations to ET rates. This is likely an expression of the heterogeneity of ecosystems, hydrology including numerous palsa and thermokarst lakes and varied physical processes and terrain of the discontinuous permafrost zone of the central Siberian Plateau.
6. Acknowledgements
R. R. Muskett thanks Hiroshi Watanabe, Center for Global Environmental Research and National Institute for Environmental Studies and the GOSAT Project for encouragement. R. R. Muskett thanks Arctic Region Supercomputing Center for computational facilities assistance. R. R. Muskett was supported through grants to Vladimir E. Romanovsky Geophysical Institute University of Alaska Fairbanks from the USGS Alaska Climate Science Center in coordination with the Arctic and Western Alaska Landscape Conservation Cooperative and the Scenarios Network for Alaska and Arctic Planning and the National Science Foundation Arctic Observing Network. Datasets used in this research are available through the Geophysical Institute Permafrost Laboratory website and server4 with anonymous ftp available on request. The Generic Mapping Tools and MATLAB are used in computational processing of this research.
REFERENCES
- A. Butz, S. Guerlet, O. Hasekamp, D. Schepers, A. Galli, I. Aben, C. Frankenberg, J.-M. Hartmann, H. Tran, A. Kuze, G. Keppel-Aleks, G. Toon, D. Wunch, P. Wennberg, N. Deutscher, D. Griffith, R. Macatangay, J. Messerschmidt, J. Notholt and T. Warneke, “Toward Accurate CO2 and CH4 Observations from GOSAT,” Geophysical Research Letters, Vol. 38, No. 14, 2011, Article ID L14812. doi:10.1029/2011GL047888
- S. Arrhenius, “On the Influence of Carbonic Acid in the Air upon the Temperature of the Ground,” Philosophical Magazine and the Journal of Science, Vol. 41, No. 251, 1896, pp. 237-276. doi:10.1080/14786449608620846
- M. I. Hoffert and C. Covey, “Deriving Global Climate Sensitivity from Palaeoclimate Reconstructions,” Nature, Vol. 360, 1992, pp. 573-576. doi:10.1038/360573a0
- J. T. Houghton, Y. Ding, D. J. Griggs, M. Noguer, P. J. van der Linden, X. Dai, K. Maskell and C. A. Johnson, “Climate Change 2001: Scientific Basis,” Cambridge University Press, New York, 2001.
- G. Kramm and R. Dlugi, “Scrutinizing the Atmospheric Greenhouse Effect and Its Climatic Impact,” Natural Science, Vol. 3, No. 12, 2011, pp. 971-998. doi:10.4236/ns.2011.312124
- P. Wessel, “A General-Purpose Green’s Function-Based Interpolator,” Computers & Geoscience, Vol. 35, No. 6, 2009, pp. 1247-1254. doi:10.1016/j.cageo.2008.08.012
- R. R. Muskett, “MODIS-Derived Arctic Land-Surface Temperature Trends,” Atmospheric and Climate Sciences, Vol. 3, No. 1, 2013, pp. 55-60. doi:10.4236/acs.2013.31008
- C. O. Justice, L. Giglio, D. Roy, L. Boschetti, I. Csiszar, D. Davies, S. Korontzi, W. Schroeder, K. O’Neal and J. Morisette, “MODIS-Derived Global Fire Products,” In: B. Ramachandran, C. O. Justice and M. J. Abrams, Eds., Land Remote Sensing and Global Environmental Change, Springer, New York, Vol. 11, 2011, pp. 661-679.
- C. Justice, L. Giglio, L. Boschetti, D. Roy, I. Csiszar, J. Morisette and Y. Kaufman, “MODIS Fire Products: Algorithm Technical Background Document,” Ver. 2.3, University of Maryland, 2006. http://modis-fire.umd.edu/AF_usermanual.html
- I. A. Csiszar, J. T. Morisette and L. Giglio, “Validation of Active Fire Detection from Moderate-Resolution Satellite Sensors: The MODIS Example in Northern Eurasia,” IEEE Transactions on Geoscience and Remote Sensing, Vol. 44, No. 7, 2006, pp. 1757-1764. doi:10.1109/TGRS.2006.875941
- S. Wilfrid, E. Prins, L. Giglio, I. Csiszar, C. Schmidt, J. Morisette and D. Morton, “Validation of GOES and MODIS Active Fire Detection Products Using ASTER and ETM+ Data,” Remote Sensing of Environment, Vol. 112, No. 5, 2008, pp. 2711-2726. doi:10.1016/j.rse.2008.01.005
- Q. Mu, M. Zhao and S. W. Running, “Improvements to a MODIS Global Terrestrial Evapotranspiration Algorithm,” Remote Sensing of Environment, Vol. 115, No. 8, 2011, pp. 1781-1800. doi:10.1016/j.rse.2011.02.019
- I. B. Konovalov, M. Beekmann, I. N. Kuznetsova, A. Yurova and A. M. Zvyagintsev, “Atmospheric Impacts of the 2010 Russian Wildfires: Integrating Modelling and Measurements of an Extreme Air Pollution Episode in the Moscow Region,” Atmospheric Chemistry and Physics, Vol. 11, No. 19, 2011, pp. 10031-10056. doi:10.5194/acp-11-10031-2011
- V. I. Kharuk, K. J. Ranson, M. L. Dvinskaya and S. T. Im, “Wildfires in Northern Siberian Larch Dominated Communities,” Environmental Research Letters, Vol. 6, 2011, Article ID: 045208.
- O.-Y. Kwon and J. L. Schnoor, “Simple Global Carbon Model: The Atmosphere-Terrestrial Biosphere-Ocean Interaction,” Global Biogeochemical Cycles, Vol. 8, No. 3, 1994, pp. 295-305. doi:10.1029/94GB00768
- M. Pagani, K. Caldeira, R. Berner and D. Beerling, “The Role of Terrestrial Plants in Limiting CO2 Decline for 24 Million Years,” Nature, Vol. 460, 2009, pp. 85-88. doi:10.1038/nature08133
- D. Taraborrelli, M. G. Lawrence1, J. N. Crowley, T. J. Dillon, S. Gromov, C. B. M. Groß, L. Vereecken and J. Lelieveld, “Hydroxyl Radical Buffered by Isoprene Oxidation over Tropical Forests,” Nature Geoscience, Vol. 5, 2012, pp. 190-193. doi:10.1038/ngeo1405
NOTES
1https://lpdaac.usgs.gov/products/modis_overview.
2http://www.ntsg.umt.edu/project/mod16.
3http://www.jpl.nasa.gov/news/news.php?release=2010-261.
4http://permafrost.gi.alaska.edu and www.permafrostwatch.org.