International Journal of Astronomy and Astrophysics
Vol.06 No.01(2016), Article ID:64602,6 pages
10.4236/ijaa.2016.61002
Variations in Solar Cycles 22, 23 & 24 and Their Effect on Earth’s Climate
Prithvi Raj Singh, Chandra Mani Tiwari, Ajay Kumar Saxena
Department of Physics, Awadhesh Pratap Singh University, Rewa, India

Copyright © 2016 by authors and Scientific Research Publishing Inc.
This work is licensed under the Creative Commons Attribution International License (CC BY).
http://creativecommons.org/licenses/by/4.0/


Received 27 October 2015; accepted 13 March 2016; published 16 March 2016
ABSTRACT
In the present work, the study of influence of solar activity, cosmic ray intensity and geomagnetic activity on Earth’s climate during solar cycles 22, 23 and 24 has been done. The change in Earth’s climate, specifically the change in the global mean temperature has been associated with the variation of some solar activity indices, cosmic ray intensity and geomagnetic activity indices in the period of 1986-2014 (Till Dec.). The important solar indices that are total solar irradiance (TSI), Sunspot Number (SSN), F10.7 index, Cosmic Ray Intensity (CRI) Kiel (NM), geomagnetic activity indices Auroral Electrojet Index (AE) and aa index, have been presented. The study of the Earth’s climate in relationship with solar activity, cosmic ray intensity and geomagnetic activity has been analysed with variations and correlations. The variations of SSN with CRI are in anti- phase; SSN with F10.7, SSN with TSI, SSN with AE, SSN with aa are in same phase. The correlation of SSN with CRI is strongly negatively correlated; SSN with F10.7, SSN with TSI is strongly positively and SSN with AE, SSN with aa positively correlated to averaging solar cycles 22, 23 and 24. The Earth’s climate will be affected by the solar activity, cosmic ray intensity and geomagnetic activity.
Keywords:
Solar Activity, Geomagnetic Activity, Cosmic Ray Intensity

1. Introduction
The globally averaged yearly mean temperature increase in the long-term solar variation, registered in the 21st century, has risen to the observed changes and can be attributed to human influence and natural phenomena. The Sunspot Number (SSN) is a solar activity index with long-term data record in a measure of natural phenomenon. We have studied that long-term instance phenomena are frequently used for climate change. The radiation from the Sun into space is redistributed by the Earth’s atmosphere and eventually reradiated to affect there by the climates i.e., the surface of the Earth at any variation in the received radiated energy has an immediate effect on the climate. The energy balance of the Earth that influences the composition is one parameter of the atmosphere. The reradiated (thermal) energy from the Earth’s surface may absorb radiation from space as well as from the various atmospheric constituents. The effect on Earth is caused by external sources related to the varying solar activity; variability including changes in the radiation [1] has been investigated possible effects on the height of constant pressure levels in the stratosphere and solar activity variations on the Earth’s temperature. The dynamics of the general circulation patterns of the solar cycles play a major role in the solar variability and consequently influence the atmospheric response.
The recent increase in the mean surface temperature of the Earth now is popularly used to refer to the long- term global warming, in particular the increased contribution of the greenhouse gases (CO2, CH4 and NO2), these increases being attributed to increase human activity in the atmosphere and this is the cause of global warming [2] . The greenhouse effect has been understood as the physical mechanism of solar influence on the weather and climate, and requires more detailed study [3] - [5] . Observations on most place of our globe over the last century have revealed considerable change in the climate from human and natural sources [6] - [8] , having proposed that the mechanism is caused by the ionizing effect of cosmic rays (galactic and solar), related to change in atmospheric transparency. We would expect, at least near the equator, in the cosmic ray flux is indeed a cause of climate variation, and in particular will have a larger shielding effect regarding the ionizing particles to the geomagnetic equator, where the magnetic field lines are horizontal.
The Sun gives energy for the Earth’s climate, and data show it is a variable star. The term “solar variability” describes a number of different processes occurring mostly in the Sun’s convection zone, surface (photosphere), and atmosphere. The influence of solar variability on the Earth’s climate requires knowledge of the short and long-term solar variability and the mechanisms are determining the response of the Earth’s climate system to these interactions [9] . A time series of sunspot number for the solar cycles 22, 23 & 24, and the Sunspots appear as dark spot on the surface of the Sun and have temperatures as low as ∼4200 K (in the central umbra) and ∼5700 K (in the surrounding penumbra), compared to ∼6050 K for the surrounding of quiet photosphere.
We have three important implications for Sun-climate relationship. First they are proxies for solar irradiance which can be used to look for Sun-climate relationships. Second how the Sun’s magnetic activity is related to solar irradiance and reconstructs the historical variations of the solar irradiance. Third it shows an increasing ability to simulate and predict solar magnetic behavior. The role of solar variability on climate received much notification because of the solar influence on the global mean surface temperature over the past 150 years. The impact of the Sun is its influence on the Earth’s radiation. The main theme of research has been focused on the extent to global temperature. For example [10] included estimates of forcing by solar activity, greenhouse gas concentration, including the cooler period of the 17th century and warming during the 21st century.
The solar irradiance over the past few centuries is difficult since direct observations are not available from a Maunder Minimum type epoch. The estimated increase in TSI from the Maunder Minimum (about 1645-1715) to present day values is uncertain. The present research converged on a probable increase of ∼1.3 W∙m−2 with an uncertainty range of 0.9 - 1.6 W∙m−2.
The smoothed monthly geomagnetic index aa as a function of time along with the sunspot number, for comparison, the minima in geomagnetic activity tends to occur just after those for the sunspot number and the geomagnetic activity tends to remain high during the declining phase of each cycle [11] -[13] decomposed geomagnetic variability into two components―one proportional to and in phase with the sunspot cycle (Relative sunspot number component) and another out of phase with the sunspot cycle (Interplanetary component).
2. Methodology
In this paper, we have studied the variations of cosmic ray intensity, solar activity (SSN, total solar irradiance (TSI), F10.7 index), geomagnetic activity (Auroral Electrojet and aa). The correlation coefficients have been calculated between Cosmic Ray Intensity (CRI) with SSN, AE with SSN, F10.7 index with SSN, TSI with SSN, SSN with aa. The solar activity (SSN) parameter is available on monthly and yearly average data for http://solarscience.msfc.nasa.gov. The Cosmic Ray Intensity (CRI) is cut-off rigidity is 2.36 GV (neutron monitor station at Kiel (Germany)), TSI and aa is taken from data www.ngdc.noaa.gov. The F10.7 index and AE is taken from data omniweb.gsfc.nasa.gov.
3. Results and Discussion
The cosmic ray intensity flux in inner solar system is anti-correlated with the level of solar activity (SSN). We have presented the relationship between solar activity (Sunspot Number) and Cosmic Ray Intensity (CRI) in the solar cycles 22, 23 and 24 till December 2014. From Figure 1 we have calculated correlation coefficient of average yearly value of Cosmic Ray Intensity (CRI) (Kiel) with SSN (R = −0.85) for the period 1986-2014. It is clear that SSN and CRI are anti-phase in solar cycles 22, 23 and 24. The amount of irradiation from the Sun causes a periodic change on the Earth climate.
The Auroral Electrojet Index (AE) shows a global, quantitative measure of auroral zone in magnetic activity produced by enhanced Ionospheric currents flowing below and within the auroral oval in solar cycles 22, 23 and 24. The Auroral Electrojet Index (AE) is the interplanetary magnetic field and the behaviour of communication satellites and radio propagation on the Earth’s magnetosphere. Figure 2 shows the variability of solar activity (SSN) with Auroral Electrojet Index (AE) in solar cycles 22, 23 and 24. We have observed positive correlation coefficient SSN with AE (R = 0.65) for the period 1986-2014. In the duration of 1986-2014 are also effected to the Earth’s climate; we have observed maximum Auroral Electrojet in 1989 and 2003.
The peak of the observed solar radio emission of the solar radio flux per unit frequency is at a wavelength of 10.7 cm. The sunspot activity effect on the long distance radio communication i.e., short wave bands, medium wave and low VHF frequencies and the high level of Sunspot activity improved signal propagation on higher frequency band. The increased levels of solar radiation are caused by impact on the ionosphere.
The F10.7 index is considered a particularly good and simple parameter as an indicator of global activity, and the disk integrated emission from the Sun at the radio wavelength of 10.7 cm (2800 MHz) is effected to the
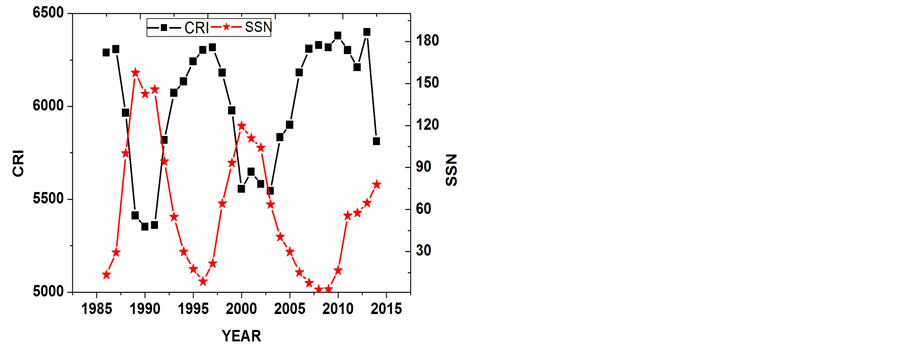
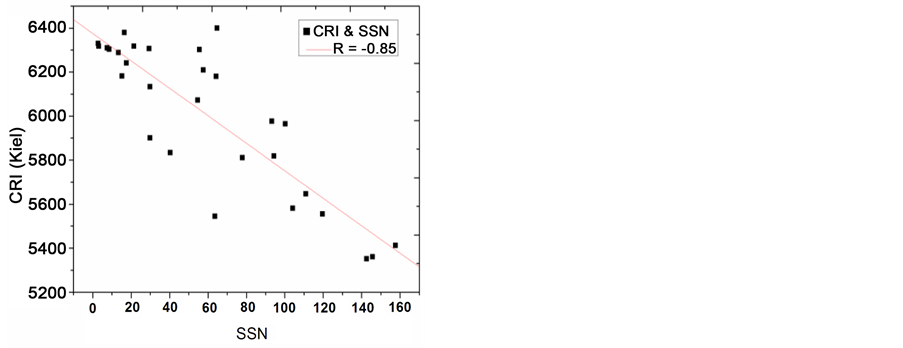
Figure 1. Show the yearly variation of Sunspot Number with Cosmic Ray Intensity (CRI) for solar cycles 22, 23 and 24.
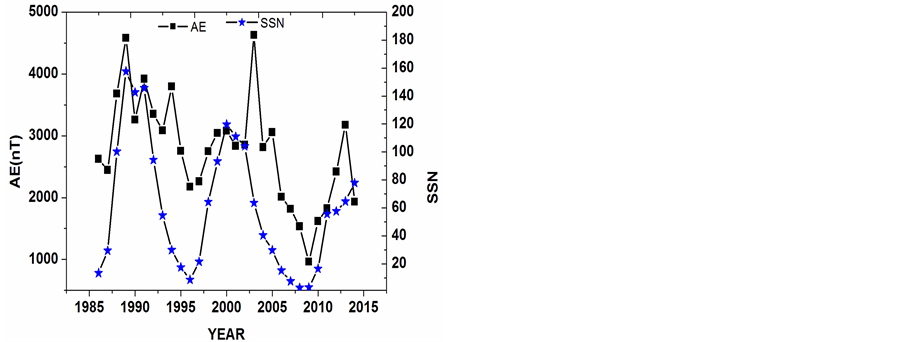
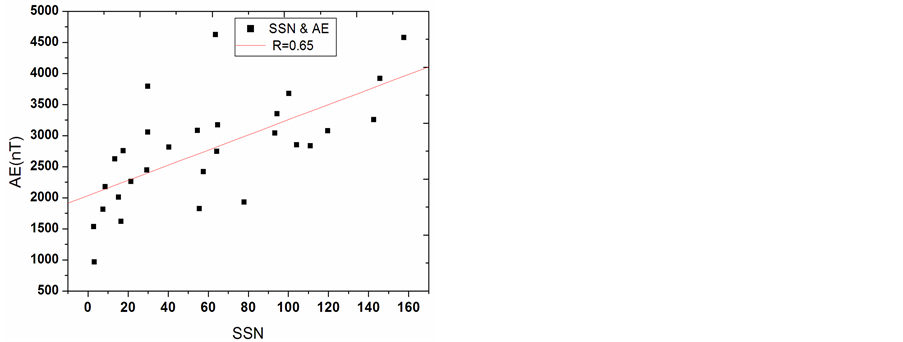
Figure 2. Show the yearly variation of Sunspot Number (SSN) with AuroralElectrojet (AE) for solar cycles 22, 23 and 24.
Earth’s climate. The radio flux in solar cycle 22 is Maximum in other solar cycle 23 and 24 as compare to Figure 3 and also observed similar variability for the period of 1986-2014, and calculated the trend line of the scatter plot, shows large positive correlation coefficient SSN with F10.7 (R = 0.98). It is clear that SSN and F10.7 are in same phase in the solar cycles 22, 23 and 24.
Total solar irradiance (TSI) is caused by the Sun over all wavelengths that fall each second on 11 sq. ft. (1 sq. m) outside the Earth's atmosphere. The change in total solar irradiance (TSI) is an indirect effect of ultraviolet radiation in the stratosphere. From Figure 4 we have observed similar variability in TSI and SSN for the period of 1986-2014. The total solar irradiance (TSI) in solar cycle 22 is Maximum in other solar cycle 23 and 24 as compare in Figure 4 and also observed correlation coefficient TSI with SSN (R = 0.95). It is clear that SSN and TSI are in same phase in solar cycles 22, 23 and 24.
The upper region of the Earth’s atmosphere affected by the Sun energy is known as the solar constant, whose value is approximately 1361 watts per square meter. This radiant solar energy affected the Earth’s weather and climate. The solar cycle 22 - 24 is responsible for a variation which is a period of about 11-year’s activity and the sunspot is actually half of a 22-year magnetic cycle.
The Solar activity is well known to be at the origin of geomagnetic activity. In this study we investigated the relationships between the sunspot activity (SSN), and geomagnetic activity (aa). Conventionally, the relationship between aa and SSN is often analyzed by point-point correspondence. The value of aa depends not only on the present SSN but also on past values aa to SSN at their peaks have been well predicted as the variations of SSN and aa in similar variability for the period of 1986-2014. They also impact on the Earth’s climate. Figure 5 summarizes the average aa values associated with the SSN in regions 1986-2014. We have calculated correla-
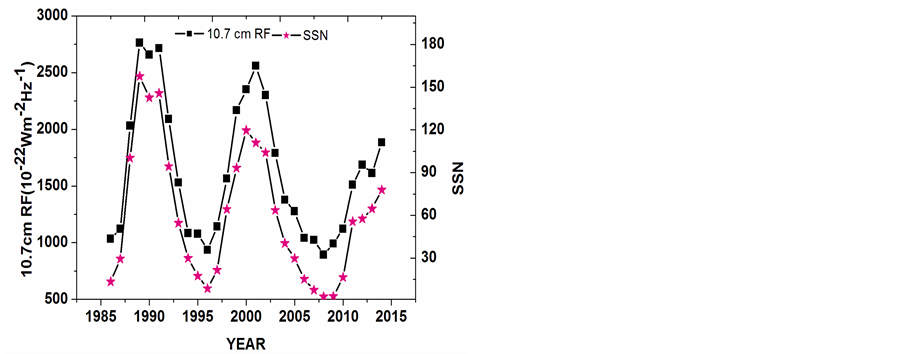
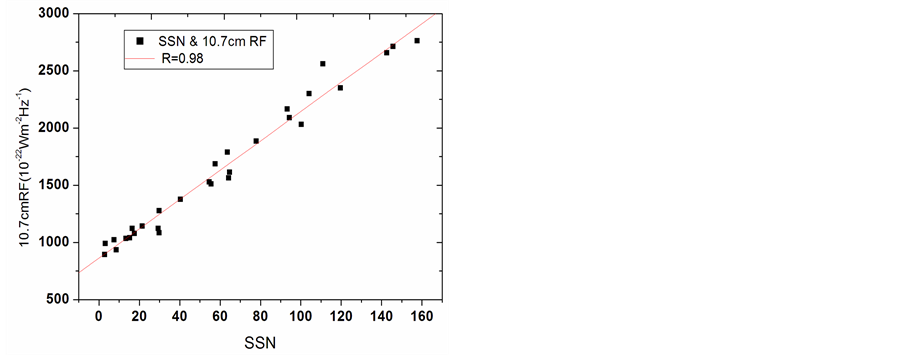
Figure 3. Show the yearly variation of SSN with F10.7 index for solar cycles 22, 23 and 24.
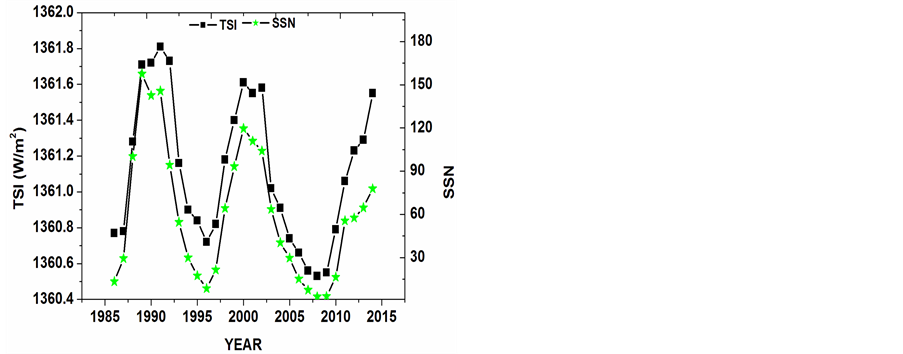
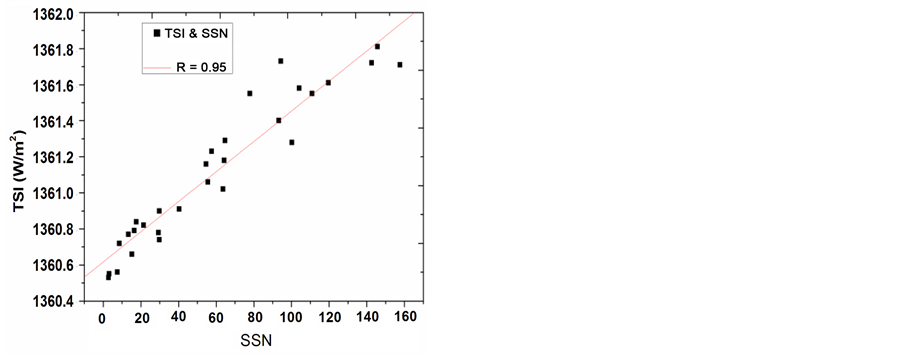
Figure 4. Show the yearly variation of SSN with TSI for solar cycles 22, 23 and 24.
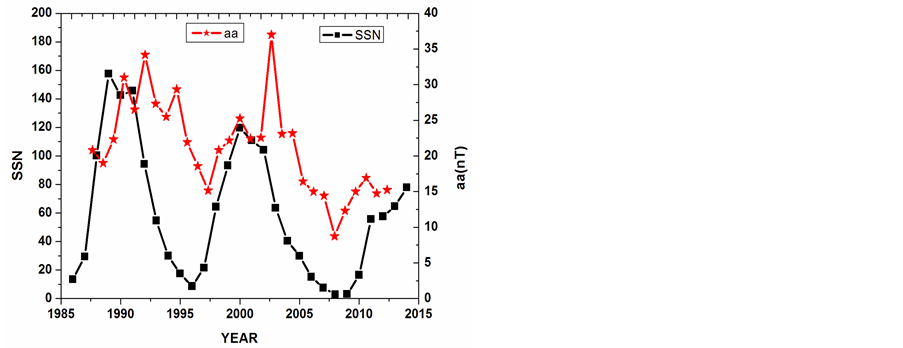
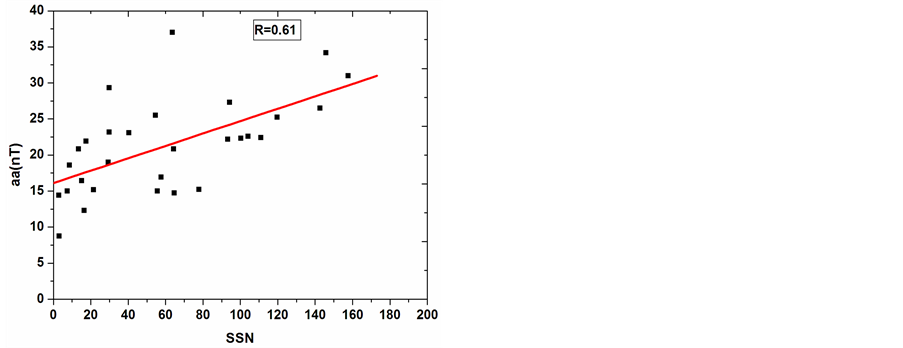
Figure 5. Show the yearly variation of SSN with aa for solar cycles 22, 23 and 24.
tion coefficient aa with SSN (R = 0.61) and also aa and SSN are in same phase in the solar cycles 22, 23 and 24, such as the significant increase in the aa index over the 21st century.
The relationship between geomagnetic activity and the sunspot number increases and there is a baseline level of geomagnetic activity that increases as well. However, uniformly high levels of geomagnetic activity are found even when the sunspot number is quite low.
4. Conclusion
In this paper, the relationship between cosmic ray intensity, geomagnetic activity and solar activity (SSN) that depends not only on the level of the sunspot activity but also the solar polarity and affects the Earth’s climate. The negative correlation with correlation coefficient (R = −0.85) has been found between yearly mean of the Sunspot Number and Cosmic Ray Intensity observed at Kiel (NM) and it was also found that CRI with SSN was in anti-phase for the period 1986-2014. The positive correlation with correlation coefficient SSN with AE (R = 0.65), SSN with F10.7 index was (R = 0.98), SSN with TSI (R = 0.95), SSN with aa (R = 0.61) in the period of 1986-2014 and also found similar variability during the solar cycles 22, 23 and 24, and also affected all the above parameters in the Earth’s climate. We have calculated the average energy of the Sun on the upper regions of the Earth’s atmosphere (known as the solar constant), and its value is approximately 1361 watts per square meter in the period 1986-2014, and changes in TSI has a direct effect on the ultraviolet radiation in the stratosphere. The radio flux F10.7 and TSI in solar cycle 22 is Maximum in other solar cycle 23 and 24. The high levels of geomagnetic activity (aa) are found even when the sunspot number is quite low.
Acknowledgements
The authors thank the CRI data for neutron monitor station at Kiel (Germany), NGDC for data SSN, TSI and aa, Omni Web for data F10.7 index and AE. The authors thank the referee, whose comments and suggestions help us to improve the paper.
Cite this paper
Prithvi RajSingh,Chandra ManiTiwari,Ajay KumarSaxena, (2016) Variations in Solar Cycles 22, 23 & 24 and Their Effect on Earth’s Climate. International Journal of Astronomy and Astrophysics,06,8-13. doi: 10.4236/ijaa.2016.61002
References
- 1. Labitzke, K. and van Loon, H. (1993) Some Recent Studies of Probable Connections between Solar and Atmospheric Variability. Annals of Geophysics, 11, 1084-1094.
- 2. Khandekar, M.L., Murty, T.S. and Chittibabu, P. (2005) The Global Warming Debate: A Review of the State of Science. Pure and Applied Geophysics, 162, 1557-1596.
http://dx.doi.org/10.1007/s00024-005-2683-x - 3. Stozhkov, Y.I. (2003) The Role of Cosmic Rays in the Atmospheric Processes. Journal of Physics G: Nuclear and Particle Physics, 29, 913-923.
http://dx.doi.org/10.1088/0954-3899/29/5/312 - 4. Gray, L.J., Beer, J., Geller, M., Haigh, J., Lockwood, M., Matthes, K., Cubasch, U., et al. (2010) Solar Influences on Climate. Reviews of Geophysics, 48, Article ID: RG4001.
- 5. Badruddin, O.P.M.A. (2014) Study of the Influence of Solar Variability on a Regional (Indian) Climate: 1901-2007. Advances in Space Research, 54, 1698-1703.
- 6. Hiremath, K.M. (2009) Solar Forcing on the Changing Climate. Sun and Geosphere, 4, 16-21.
- 7. Ahluwalia, H.S. (2012) Three-Cycle Quasi-Periodicity in Solar, Geophysical, Cosmic Ray Data and Global Climate Change. Indian Journal of Radio & Space Physics, 41, 509-519.
- 8. Pudovkin, M.I. and Raspopov, O.M. (1992) The Mechanism of Action of Solar Activity on the State of the Lower Atmosphere and Meteorological Parameters: A Review. Geomagnetism and Aeronomy, 32, 593-608.
- 9. Rind, D. (2002) The Sun’s Role in Climate Variations. Science, 296, 673-677.
http://dx.doi.org/10.1126/science.1069562 - 10. Crowley, T.J. (2000) Causes of Climate Change over the Past 1000 Years. Science, 289, 270-277.
- 11. Mayaud, P.N. (1972) The aa Indices: A 100-Year Series Characterizing the Magnetic Activity. Journal of Geophysical Research, 77, 6870-6874.
- 12. Svalgaard, L., Cliver, E.W. and Le Sager, P. (2004) IHV: A New Long-Term Geomagnetic Index. Advances in Space Research, 34, 436-439.
http://dx.doi.org/10.1016/j.asr.2003.01.029 - 13. Feynman, J. (1982) Geomagnetic and Solar Wind Cycles: 1900-1975. Journal of Geophysical Research, 87, 6153-6166.
http://dx.doi.org/10.1029/JA087iA08p06153