Journal of Diabetes Mellitus
Vol. 3 No. 2 (2013) , Article ID: 31104 , 7 pages DOI:10.4236/jdm.2013.32008
Comparison of glycemic variability between basal-bolus and premixed insulin therapy*
![]()
1Diabetes Center, Kitasato Institute Hospital, Tokyo, Japan; #Corresponding Author: yamada-s@insti.kitasato-u.ac.jp
2Department of Internal Medicine, Keio University School of Medicine, Tokyo, Japan
3Center for Clinical Pharmacy and Clinical Sciences, Kitasato University, Tokyo, Japan
4Department of Medicine, Tokyo University School of Medicine, Tokyo, Japan
Copyright © 2013 Satoru Yamada et al. This is an open access article distributed under the Creative Commons Attribution License, which permits unrestricted use, distribution, and reproduction in any medium, provided the original work is properly cited.
Received 27 February 2013; revised 28 March 2013; accepted 7 April 2013
Keywords: Glycemic Variability; Insulin Therapy; Diabetes; Continuous Glucose Monitoring
ABSTRACT
Background: Several studies have shown that twice-daily injections of premixed insulin analogs (MIX) could achieve comparable HbA1c levels to basal-bolus (BB) therapy. However, HbA1c does not necessarily reflect short-term glycemic fluctuations that may contribute to the onset or progression of diabetic complications. Therefore, in this study, we compared MIX and BB therapies in terms of their effects on glycemic variability. Methods: We performed a crosssectional observational study of patients attending our outpatient clinics to compare the effects of two insulin regimens on glycemic variability. We recruited patients treated with MIX or BB with HbA1c < 8.4%. A total of 27 patients (11 treated with BB and 16 treated with MIX) were enrolled and wore a continuous glucose monitor (CGM) for 72 h, while continuing their usual lifestyle and insulin doses. Results: No significant differences in CGM-determined glycemic markers were observed between the two groups. However, the post-lunch duration of glucose levels > 180 mg/dL (t > 180) was significantly shorter with BB therapy (88 ± 76 min) than with MIX therapy (145 ± 54 min; p < 0.05). After classification according to HbA1c levels, markers of glycemic variability were better in patients treated with BB than in those treated with MIX in better control group. Conclusion: These results suggest that BB therapy achieves better glucose profiles than MIX therapy in patients with type 2 diabetes, particularly after lunch.
1. INTRODUCTION
The aim of diabetes treatment is to prevent diabetic complications by controlling blood glucose levels [1,2]. Insulin treatment effectively lowers blood glucose levels and improves glycemic control, and many patients with type 1 and type 2 diabetes require insulin therapy. Among various insulin regimens, basal-bolus (BB) therapy is thought to most closely imitate physiological insulin secretion by frequent injections of insulin [3]. On the other hand, to maintain the patients’ motivation, attempts have been made to reduce the physical and mental burden of diabetes treatment [4]. To this end, several studies have shown that twice-daily injections of premixed insulin analogs (MIX therapy) can achieve HbA1c levels comparable with that achieved by BB therapy but with fewer injections [5-7]. Thus, MIX therapy is preferred by many patients with type 2 diabetes.
Glycemic fluctuations (I.e., variability), as well as HbA1c, have been implicated in the onset and progresssion of diabetic complications [8-10]. Hence, it is necessary to evaluate glycemic control in terms of both HbA1c and glycemic variability.
We previously reported that oxidative stress markers, which may reflect glycemic variability, were not significantly different between BB and MIX therapies [11]. However, we could not reach a firm conclusion, particularly in patients with HbA1c < 7.4%.
Therefore, to expand on these earlier findings, we compared BB and MIX therapies in terms of glycemic variability using continuous glucose monitoring (CGM).
2. METHODS
2.1. Patients
Patients were recruited from the outpatient clinic of Kitasato Institute Hospital, between June and December 2009. Patients with type 2 diabetes, treated with BB or MIX insulin therapy for ≥4 months and HbA1c < 8.4% were eligible for this cross-sectional observational study. HbA1c < 8.4% in inclusion criteria is defined as “fair control” by Japanese Diabetes Society. We excluded patients with “poor control” whose HbA1c is 8.4% or more. Other exclusion criteria included severe liver failure (>3 × the upper limit of normal), severe renal failure (serum creatinine > 1.3 mg/dL), anemia (hemoglobin < 10.0 g/dL) or a change in HbA1c ≥ 1.0% during the 2-month observation period. All patients received an explanation of the procedures and possible disadvantages of participating in the study. All of the patients gave written informed consent before study entry. This study was approved by the Institutional Review Board of Kitasato Institute Hospital and was performed in accordance with the Declaration of Helsinki.
2.2. Treatments and Protocols
The patients continued with their original insulin regimen. BB therapy comprised basal-bolus therapy with insulin glargine (Lantus®; Sanofi-Aventis, Paris, France) or detemir (Levemir®; Novo Nordisk A/S, Bagsværd, Denmark) once daily in combination with preprandial insulin: insulin lispro (Humalog®; Eli Lilly, Indianapolis, IN, USA), insulin aspart (NovoRapid®; Novo Nordisk A/S) or human insulin (Novolin R®; Novo Nordisk A/S). MIX therapy comprised patients treated with twice-daily injections of 50/50 premixed insulin lispro (Humalog® MIX 50; Eli Lilly) or 30/70 premixed insulin aspart (NovoRapid® 30 MIX; Novo Nordisk A/S). The insulin regimen and dosage were not allowed to be changed unless severe hypoglycemia occurred.
In this study, we used the CGMS® Gold™ (Medtronic MiniMed, Northridge, CA, USA) for CGM. This system can determine interstitial glucose levels every 5 minutes for 72 h. Subjects measured their blood glucose values using a Medisafe Mini® glucose meter (Terumo, Tokyo, Japan) four times a day and inserted the values into the CGM for data calibration.
Patients were equipped with the CGM system when they visited the outpatient clinic of Kitasato Institute Hospital, and were monitored for 72 h as outpatients. During this period, patients were asked to continue their usual lifestyle.
2.3. Assessment of CGM Parameters
The following parameters were analyzed using data obtained during the middle 48 hours of wearing the CGM: mean glucose, standard deviation of mean blood glucose values (SD), M-value [12], mean amplitude of glycemic excursions (MAGE) [13], area under the curve of glucose levels > 180 mg/dL (AUC > 180), and duration of glucose levels > 180 mg/dL (t > 180) and < 70 mg/dL (t < 70). Next, we categorized the 48-hour data into postprandial (the 4-hour period from the start of each meal) and nocturnal (0:00 - 6:00) periods. Then we calculated the following parameters: mean glucose, AUCpp (area under the curve of glucose levels above the preprandial blood glucose levels), area under the glycemic fluctuation curve (area under the curve of glucose levels above and below the preprandial blood glucose levels), AUC > 180, t > 180, and t < 70 of postprandial period. We also calculated mean glucose, SD, AUC > 180, t > 180, and t < 70 for the nocturnal period.
Next, we evaluated the relationships between HbA1c and glycemic variability (SD, M-value and MAGE). Because Monnier et al. found that post-lunch plasma glucose (PG) and extended post-lunch PG values were significantly and independently correlated with HbA1c [14], we also analyzed the relationships between HbA1c and post-lunch glycemic variability (AUCpp and area under the glycemic fluctuation curve).
Finally, we classified patients according to HbA1c ( < 7.4% and ≥ 7.4%) and compared glycemic variability (SD, M-value, MAGE, post-lunch AUCpp and area under the glycemic fluctuation curve) between these groups of patients. We used HbA1c < 7.4% or not as the cutoff value because this value is defined as “inadequate” by the Japan Diabetes Society (JDS) [15].
2.4. Statistical Analysis
All values are means ± standard deviation. Differences between the two groups of patients for CGM parameters were analyzed using unpaired t-tests. Pearson’s univariate regression analysis was used to evaluate the relationships between HbA1c and CGM parameters. Values of P < 0.05 were considered to be statistically significant, except in the classified analysis, for which P < 0.01 was considered to be significant. SPSS software version 16.0J (SPSS Japan Inc. Tokyo, Japan) was used for statistical analyses.
3. RESULTS
3.1. Patient Characteristics
We registered 27 patients (BB, n = 11; MIX, n = 16). CGM data were incomplete for one patient in the BB group. Two patients (one in each group), were excluded from the analyses of the postprandial periods because the meal start times were unclear. One patient in the MIX group was excluded from the analyses of the postprandial periods because he started eating dinner within 4 hours after starting lunch. The baseline characteristics of the patients in both groups are shown in Table 1. The baseline variables were equivalent in both groups.
3.2. CGM Parameters
The 24-hour glucose profiles for both groups are shown in Figure 1 and the glycemic parameters are shown in Table 2. There were no significant differences between the two groups in any of the glycemic markers derived from the 48 hours of CGM data. Furthermore, there were no differences between the groups for any of the glycemic markers post-breakfast and post-dinner. However, post-lunch t > 180 was significantly higher in the MIX therapy group than in the BB therapy group (145 ± 54 min vs. 88 ± 76 min, respectively; P < 0.05). There were no significant differences between the two groups in terms of nocturnal glycemic markers.
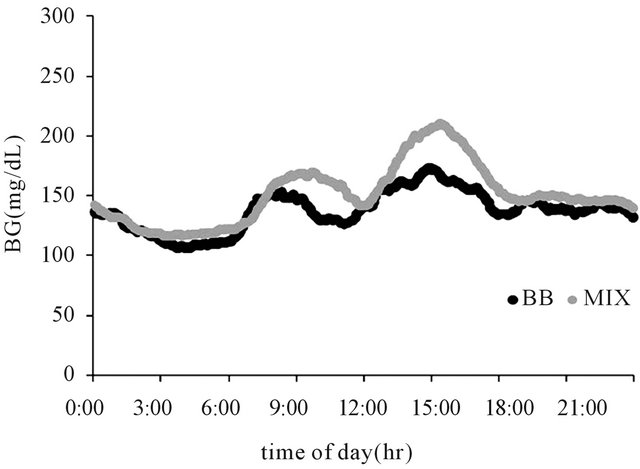
Figure 1. Twenty-four-hour glucose profile in patients treated with basal-bolus insulin (●) or twice-daily injections of premixed insulin analogs (●).
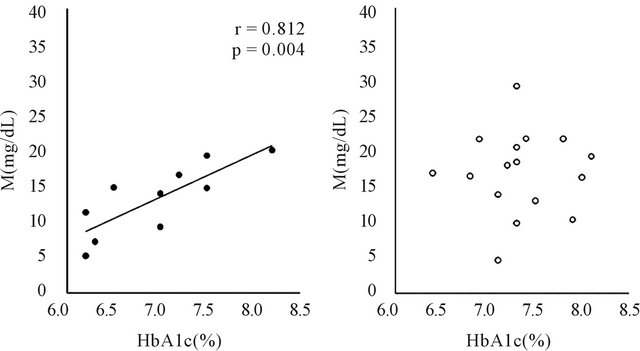
3.3. Correlations between HbA1c and Markers of Glycemic Variability
The correlation between HbA1c and M-value in both groups is shown in Figure 2. HbA1c was significantly correlated with the M-value in the BB therapy group (r =
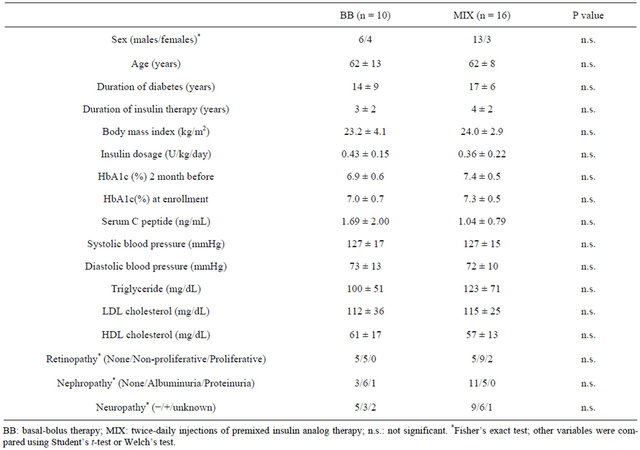
Table 1. Patient characteristics.
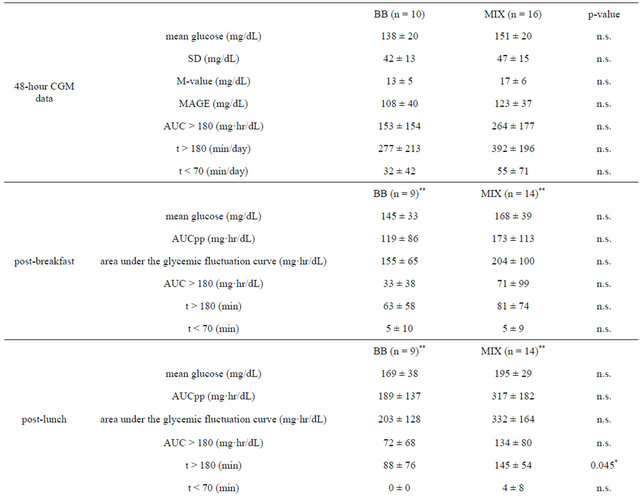
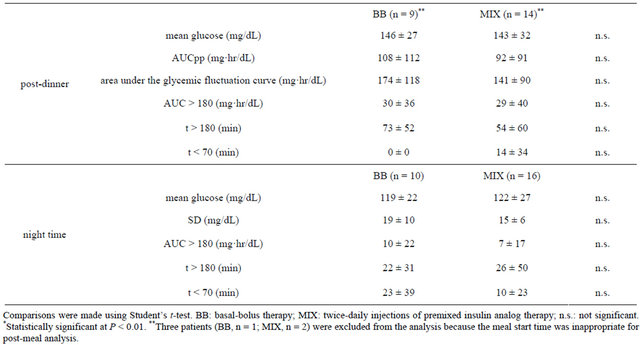
Table 2. Comparison of glycemic parameters.
 (a) (b)
Figure 2. Correlations between HbA1c and M-value in patients treated with basal-bolus insulin (a) or twice-daily injections of premixed insulin analogs (b).
0.812, P < 0.05), but not in the the MIX therapy group. Similarly, there were significant correlations between HbA1c and SD, MAGE, post-lunch AUCpp and area under the glycemic fluctuation curve in the BB therapy group (r = 0.772, P < 0.05; r = 0.706, P < 0.05; r = 0.830, P < 0.05; and r = 0.855, P < 0.05, respectively), but not in the MIX therapy group.
3.4. Classification According to HbA1c
The results of the classified analysis are shown in Table 3. Among patients with HbA1c ≥ 7.4%, there were no significant differences in any of the parameters be tween the BB and MIX groups. In contrast, when we analyzed patients with HbA1c < 7.4%, post-lunch AUCpp and area under the glycemic fluctuation curve were significantly lower in the BB therapy group than in the MIX therapy group. Furthermore, MAGE was lower in the BB therapy group than in the MIX therapy group, although it was not statistically significant (P = 0.033).
4. DISCUSSION
In this study, we used CGM to compare glycemic variability between two insulin regimens—BB therapy and twice-daily MIX—in patients with type 2 diabetes.
Analyses of 48 hours of data showed no significant difference between the two therapies. However, SD, Mvalue and MAGE, markers of glycemic variability, may not necessarily reflect the acute glucose fluctuations, such as postprandial hyperglycemia. Thus, we focused on the postprandial and nocturnal periods and compared glycemic variability within these periods.
Comparison of glycemic control after breakfast and dinner, and during the night showed no significant differences between the two therapies. On the other hand, post-lunch t > 180 was significantly higher in the MIX therapy group. Because preprandial glucose levels were equivalent in both groups (data not shown), these results suggest that the blood glucose levels of patients treated with MIX increased rapidly after lunch, which exposed
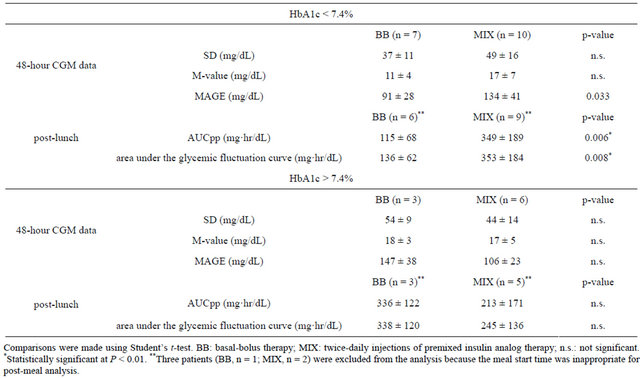
Table 3. Classified analysis.
these patients to hyperglycemia. Several large-scale trials have suggested that postprandial hyperglycemia is an independent risk factor for macrovascular diseases [16- 19].
So the results of this study suggest that, at equivalent HbA1c levels, the risk for diabetes complications may be higher in patients of MIX therapy than BB therapy. This interpretation is supported by previous findings that the risk of retinopathy progression differed significantly between intensively and conventionally treated patients with comparable HbA1c levels [20].
Generally, as glycemic control deteriorates, glycemic variability increases. However, the difference in glycemic variability between BB therapy and twice-daily MIX therapy is not clear. In this study, we analyzed the correlations between HbA1c and markers of glycemic variability. As Figure 2 showed, there was a positive correlation between HbA1c and glycemic variability such as M-value only in BB therapy. This suggests that patients in BB therapy with good control can reduce glycemic variability and may avoid hypoglycemia but not patients in MIX therapy with good control. The results of these analyses suggested that MIX therapy might not sufficiently suppress the fluctuations in blood glucose, even at lower HbA1c levels.
To exclude the influence of HbA1c levels, we divided the patients into groups based on HbA1c (I.e., <7.4% vs. ≥7.4%). Similar to post-lunch AUCpp and area under the glycemic fluctuation curve, MAGE was lower in the BB therapy group than the in MIX therapy group, among patients with HbA1c < 7.4%. MAGE was designed to quantitate major glucose excursions and exclude minor ones [21], hence MIX therapy may be unable to suppress major excursions caused by postprandial hyperglycemia at lower HbA1c levels. Our previous study showed an insignificant difference in oxidative stress markers between BB and MIX therapies in patients with HbA1c < 7.4% [11]. Although the sample size of the study was small, BB therapy might suppress the postprandial hyperglycemia more effectively than does MIX therapy. Flexibility in dosage adjustment may also account for the differences in glycemic variability between the two therapies. During twice daily treatment with premixed insulin, some type 2 diabetic patients complain of hypoglycemia before lunch, necessitating a reduction in insulin dose at breakfast. Reducing the insulin dosage at breakfast, however, causes an increase in evening plasma glucose levels in some patients; indicating the limitation of this insulin regimen. Patients treated with BB, on the other hand, can adjust their insulin doses in response to fasting and postprandial glucose. Thus, BB therapy can suppress postprandial hyperglycemia and glycemic variability more appropriately without increasing hypoglycemia. Therefore, BB therapy may be a better regimen to achieve HbA1c goal and prevent diabetic complications. Indeed, a recent meta-analysis of randomized controlled trials suggests that the BB regimen is better at achieving the HbA1c goal compared with all other regimens, including basal, prandial and MIX [22]. Combining MIX therapy with α-glucosidase inhibitors or glinides may help to reduce postprandial hyperglycemia [23-26].
This study has several limitations: 1) as we mentioned before, the sample size was small; 2) this was a non-randomized observational study. Although the baseline characteristics were equivalent in both groups, other factors may have affected the results. Hence, a largescale, randomized study is needed to confirm our results. Moreover, glucose monitoring was performed in outpatients. Therefore, CGM should also be performed in an inpatient setting to evaluate glycemic variability more precisely and exclude patient lifestyle factors.
In conclusion, BB therapy achieves better glucose levels, particularly after lunch, than twice-daily MIX in patients with type 2 diabetes. Twice-daily injections of MIX may be insufficient to suppress fluctuations in blood glucose and postprandial hyperglycemia, even at lower HbA1c levels.
5. ACKNOWLEDGMENTS
This study was supported by a grant from Kitasato Institute Hospital.
REFERENCES
- The Diabetes Control and Complications Trial Research Group. (1993) The effect of intensive treatment of diabetes on the development and progression of long-term complications in insulin-dependent diabetes mellitus. The New England Journal of Medicine, 329, 977-986. doi:10.1056/NEJM199309303291401
- Ohkubo, Y., Kishikawa, H., Araki, E., et al. (1995) Intensive insulin therapy prevents the progression of diabetic microvascular complications in Japanese patients with non-insulin-dependent diabetes mellitus: A randomized prospective 6-year study. Diabetes Research and Clinical Practice, 28, 103-117. doi:10.1016/0168-8227(95)01064-K
- Hirsch, I.B., Bergenstal, R.M., Parkin, C.G., et al. (2005) A real-world approach to insulin therapy in primary care practice. Clinical Diabetes, 23, 78-86. doi:10.2337/diaclin.23.2.78
- Golden, M.P. (1998) Incorporation of quality-of-life considerations into intensive diabetes management protocols in adolescents. Diabetes Care, 21, 885-886. doi:10.2337/diacare.21.6.885
- Hirao, K., Arai, K., Yamauchi, M., et al. (2008) Sixmonth multicentric, open-label, randomized trial of twicedaily injections of biphasic insulin aspart 30 versus multiple daily injections of insulin aspart in Japanese type 2 diabetic patients (JDDM 11). Diabetes Research and Clinical Practice, 79, 171-176. doi:10.1016/j.diabres.2007.08.011
- Miyashita, Y., Nishimura, R., Nemoto, M., et al. (2008) Prospective randomized study for optimal insulin therapy in type 2 diabetic patients with secondary failure. Cardiovascular Diabetology, 7, 16-23. doi:10.1186/1475-2840-7-16
- Masuda, H., Sakamoto, M., Irie, J., et al. (2008) Comparison of twice-daily injections of biphasic insulin lispro and basal-bolus therapy: Glycaemic control and qualityof-life of insulin-naïve type 2 diabetic patients. Diabetes, Obesity and Metabolism, 10, 1261-1265.
- Monnier, L., Mas, E., Ginet, C., et al. (2006) Activation of oxidative stress by acute glucose fluctuations compared with sustained chronic hyperglycemia in patients with type 2 diabetes. The Journal of the American Medical Association, 295, 1681-1687. doi:10.1001/jama.295.14.1681
- Beisswenger, P.J., Szwergold, B.S. and Yeo, K.T. (2001) Glycated proteins in diabetes. Clinical Laboratory Medicine, 21, 53-78.
- Del Prato S. (2002) In search of normoglycaemia in diabetes: Controlling postprandial glucose. International Journal of Obesity, 26, S9-S17. doi:10.1038/sj.ijo.0802172
- Sakamoto, M., Inoue, G., Tsuyusaki, K., et al. (2010) Comparison of oxidative stress markers in type 2 diabetes: Basal bolus therapy versus twice daily premixed insulin analogs. Internal Medicine, 49, 355-359. doi:10.2169/internalmedicine.49.2725
- Schlichtkrull, J., Munck, O. and Jersild, M. (1965) The m-value, an index of blood-sugar control in diabetes. Acta Medica Scandinavica, 177, 95-102. doi:10.1111/j.0954-6820.1965.tb01810.x
- Service, F.J., Molnar, G.D., Rosevear, J.W., et al. (1970) Mean amplitude of glycemic excursions, a measure of diabetic instability. Diabetes, 19, 644-655.
- Avignon, A., Radauceanu, A. and Monnier, L. (1997) Nonfasting plasma glucose is a better marker of diabetic control than fasting plasma glucose in type 2 diabetes. Diabetes Care, 20, 1822-1826. doi:10.2337/diacare.20.12.1822
- Kashiwagi, A., Kasuga M., Araki, E., et al. (2012) International clinical harmonization of glycated hemoglobin in Japan: From Japan Diabetes Society to National Glycohemoglobin Standardization Program values. Diabetology International, 3, 8-10.
- The DECODE Study Group. (1999) Glucose tolerance and mortality: Comparison of WHO and American Diabetes Association diagnostic criteria. Lancet, 354, 617- 621. doi:10.1016/S0140-6736(98)12131-1
- Hanefeld, M., Koehler, C., Schaper, F., et al. (1999) Postprandial plasma glucose is an independent risk factor for increased carotid intima-media thickness in non-diabetic individuals. Atherosclerosis, 144, 229-235. doi:10.1016/S0021-9150(99)00059-3
- Hanefeld, M., Fischer, S., Julius, U., et al. (1996) Risk factors for myocardial infarction and death in newly detected NIDDM: The diabetes intervention study, 11-year follow-up. Diabetologia, 39, 1577-1583. doi:10.1007/s001250050617
- Tominaga, M., Eguchi, H., Manaka, H., et al. (1999) Impaired glucose tolerance is a risk factor for cardiovascular disease, but not impaired fasting glucose. The Funagata Diabetes Study. Diabetes Care, 22, 920-924. doi:10.2337/diacare.22.6.920
- The Diabetes Control and Complications Trial (DCCT) Research Group. (1995) The relationship of glycemic exposure (HbA1c) to the risk of development and progression of retinopathy in the diabetes control and complications trial. Diabetes, 44, 968-983. doi:10.2337/diabetes.44.8.968
- Monnier, L., Colette, C. and Owens, D.R. (2008) Glycemic variability: The third component of the dysglycemia in diabetes. Is it important? How to measure it? Journal of Diabetes Science and Technology, 2, 1094-1100.
- Giugliano, D., Maiorino, M.I., Bellastella, G., et al. (2011) Efficacy of insulin analogs in achieving the hemoglobin A1c target of <7% in type 2 diabetes: Meta-analysis of randomized controlled trials. Diabetes Care, 34, 510-517. doi:10.2337/dc10-1710
- Coniff, R.F., Shapiro, J.A., Seaton, T.B., et al. (1995) A double-blind placebo-controlled trial evaluating the safety and efficacy of acarbose for the treatment of patients with insulin-requiring type II diabetes. Diabetes Care, 18, 928- 932. doi:10.2337/diacare.18.7.928
- Mitrakou, A., Tountas, N., Raptis, A.E., et al. (1998) Long-term effectiveness of a new alpha-glucosidase inhibitor (BAY m1099-miglitol) in insulin-treated type 2 diabetes mellitus. Diabetic Medicine, 15, 657-660. doi:10.1002/(SICI)1096-9136(199808)15:8<657::AID-DIA652>3.0.CO;2-7
- Chiasson, J.L., Josse, R.G., Hunt, J.A., et al. (1994) The efficacy of acarbose in the treatment of patients with noninsulin-dependent diabetes mellitus. A multicenter controlled clinical trial. Annals of Internal Medicine, 121, 928-935. doi:10.7326/0003-4819-121-12-199412150-00004
- The Committee of Japan Diabetes Society on the diagnostic criteria of diabetes mellitus. (2010) Report of the Committee on the classification and diagnostic criteria of diabetes mellitus. Journal of the Japan Diabetes Society, 53, 450-467.
NOTES
*Author contributions: SY, RH and TY designed the study; RH performed statistical analyses; and GI, YT and KA coordinated the study. All authors have read and approved the final manuscript.
Author disclosure statement: The authors state that they have no conflicts of interest.