Journal of Sensor Technology
Vol.3 No.1(2013), Article ID:29060,7 pages DOI:10.4236/jst.2013.31002
A High-Density Ternary Barcode Detection System with a Dual-Bias Differential Method
Division of Electronics and Information Engineering, Tokyo Metropolitan College of Industrial Technology, Tokyo, Japan
Email: wakaumi@s.metro-cit.ac.jp
Received November 15, 2012; revised December 18, 2012; accepted December 26, 2012
Keywords: Optical Detection System; Laser Diode; Barcode; Ternary; Signal Processing; Simulation
ABSTRACT
A dual-bias differential method is presented for increasing the detection range of a ternary barcode detection system. The system is provided with a second differential delay circuit with bias control to process optimally gray signals by lowering their averaged level using a clamping circuit. This is added to the primary conventional differential delay circuit without bias control and a comparator to process optimally black signals based on the envelope-differential fixed-period delay (EDFPD) detection technique. This method enables the system to detect over a longer range at high speeds while being capable of handling a large amount of information. The estimate results of gray and white code widths against the clamp bias made through the dynamic operation simulation of a differential circuit using SPICE were nearly consistent with the experimental results. Thereby we can conclude that the dynamic simulation is effective for estimation of an optimum clamp bias voltage. It was confirmed that the detection range of the system with a clamp bias voltage of −0.4 V for a minimum bar width W = 0.25 mm was 1.4 times that of the conventional EDFPD detection technique. In addition, the system operated at a maximum scanning speed of 7.7 times that of conventional CCD cameras under the practical detection range. The system with clamp bias control is expected to enable the real-time identification of goods on production lines and in automated warehouses.
1. Introduction
The real-time identification of barcodes (BCs) containing much information is needed for applications such as goods management on production lines in which highspeed detection is required. Though the use of highdensity two-dimensional binary BCs or color two-dimensional BCs for identification systems has been considered [1-3], the maximum scanning speed with these techniques is limited to nearly 50 scans/sec because of the complicated image processing and focus adjustment by the CCD cameras [4,5]. This low-scanning speed makes the high-speed sorting of goods problematic. It also has the problem that an auxiliary light must be provided.
The authors devised a ternary barcode detection system (TBDS) using a dual-threshold detection method and a laser, in which a ternary barcode with much information is employed, to resolve the above low-speed scanning and auxiliary light problems [6]. Because this system is capable of providing an unbent average signal with a non-hyperbola-shaped enveloped line through the averaging method developed to lessen hyperbolic shading caused by different scanning distances from the barcode to the surface of the scanner mirror, it has the features of providing a long detection range and a high scanning speed, and its effectiveness was confirmed through a prototype [6-8]. However, the detection range was limited to 0.4 mm, because of distortion of the detection signals caused by uneven signal changes depending on the bar width.
To resolve this problem for high-speed high-density BC detection, the author developed a TBDS that employs an envelope-differential composite method, featuring the subtraction of an attenuated and slightly enveloped line of the detection signal from the original signal and its differential [9,10]. Because this system detects a ternary barcode with narrow bars while eliminating signal distortion using the slightly enveloped method and emphasizing the transitions of the BC signal by applying the differential method, it can reliably detect high-density BCs. The effectiveness of this technique in providing high BC densification to a bar-width level of 0.3 mm was demonstrated using a single-line ternary BC. However, the detection limitation of this system was a nearly 0.3 mm detectable minimum bar width because of the distortion of the delayed mixed code signal through the counting period-latch timing instability and the fluctuation of the differentiated signal through the noise contained in the average signal.
To resolve this problem and provide a longer detection range for high-density barcodes with a higher scanning speed, the author’s recently developed TBDS employed an envelope-differential fixed-period delay (EDFPD) method, which combined a fixed-period delay method and an envelope-differential detection technique containing nonlinear filtering [11]. In this system, the detection range of nearly 5 cm is inadequate even for a practical W = 0.25 mm and needs to be extended because of the distortion of gray code signals through the decrease in the differential signal and the phase delay caused by the high averaged bias level of small gray signals.
In this paper, a TBDS with a dual-bias differential (DBD) method [12] is proposed to provide a longer detection range at high speeds for high density BCs while being able to handle a great amount of information. In Section 2, the DBD method is described, in which gray signals are processed optimally with a bias control using a clamping circuit and black signals is processed optimally with the EDFPD technique. In Section 3, the clamping and differential circuits are introduced. In Section 4, the prototype TBDS with this DBD scheme is demonstrated and its scheme effectiveness is confirmed experimentally. In Section 5, by estimating gray and white code widths through the dynamic simulation of the differential circuit using SPICE, it is confirmed that the dynamic simulation is effective for appropriate estimation of an optimum clamp bias voltage.
2. Dual-Bias Differential TBDS
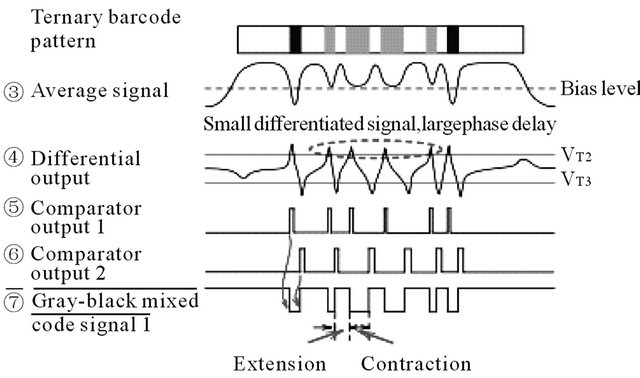
Figure 1 shows an outline of the TBDS using the DBD method. Its operation principle waveforms are shown in Figure 2. In the system, a black code signal is obtained by comparing the average signal of the detected barcode signal with a black level comparator threshold VT1. An adjusted black code signal is obtained through sampling/gating the black code signal by the delayed mixed code signal 1 obtained from the conventional differential delay circuit 1 and the nonlinear filter, based on the EDFPD detection technique containing nonlinear filter processing. In the nonlinear filter processing, the nonlinear filter is used to suppress the sharp-edge noise contained in the average signal to ensure stable detection [11]. In the EDFPD detection technique, bias control of the average signal is not performed. An optimal gray code signal is obtained through gating a selection pulse and a delayed mixed code signal 2 from a differential delay circuit 2 with bias control for lowering the aver aged level of the gray signals. The differential delay circuit 2 consists of a clamping circuit for the bias control of the average signal, a differential circuit for differentiating its clamped average signal, level comparators with two thresholds VT2 and VT3 for processing differentiated signals, a preset-reset circuit for changing comparator outputs to a gray-black mixed code signal 2 and a shift-register delay circuit 2 for the delay of the grayblack mixed code signal 2 by a delay time td. The substantial difference between the conventional EDFPD method and the new DBD method is shown in Figure 3. In the conventional EDFPD method, an average level of the gray signal is located above the bias level of the average signal (nearly 0 V). It means that the gray signal is differentiated near the upper saturation level of the differential circuit. This provides a small differentiated signal and thus a large phase-delay at the beginning of the gray signal, which causes an extension of the white code signal and a contraction of the gray code signal. On the contrary, in the DBD method, the bias level of gray sig-
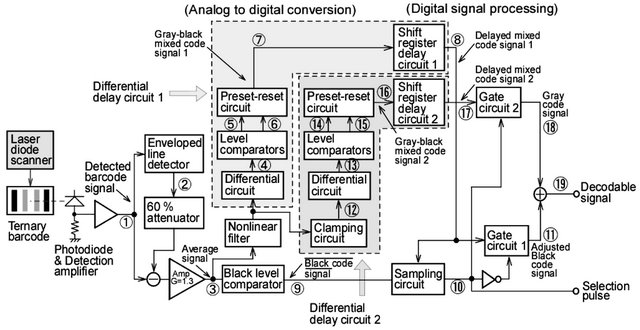
Figure 1. Schematic outline of the DBD TBDS.
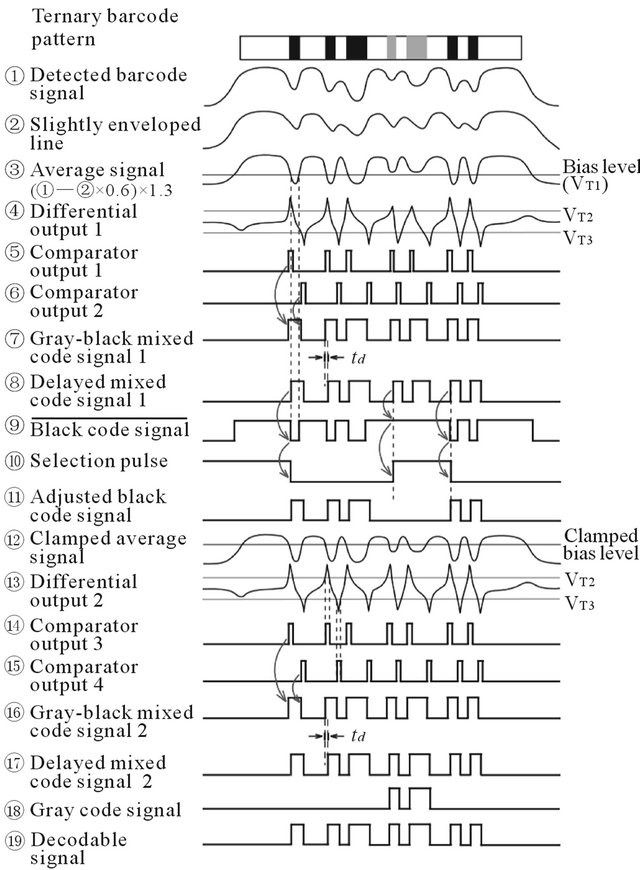
Figure 2. Operation principle waveforms.
nals is adjusted to nearly 0 V by lowering its averaged level using the clamping circuit. As a result of this adjustment, appropriate differentiation of the gray signals is carried out, creating a large differentiated signal, and consequently a small phase-delay for the gray signals is obtained. Though the bias level for black signals is changed to a higher level than the averaged level of the average signal by the clamp operation, there is hardly any phase delay because the black signals are large. Therefore, a gray-black mixed code signal with a nearly normal code width by the DBD method should be obtained.
3. Clamping and Differential Circuits
Figure 4 shows a configuration of clamping and differential circuits. The clamping circuit used consists of a coupling capacitor C, a resistor R for providing a ground bias level, a clamp diode D and a bias power supply Vbias for providing the clamp bias voltage Vbias [13]. In this circuit, higher level signals than Vbias + Vj (a junction potential of clamp diode: ~0.6 V) are clamped to a level below Vbias + Vj. Therefore, the bias level of the average signal is adjusted to an optimum level through the adjustment of Vbias. The adjusted average signal is differentiated by the differential circuit, which amplifies the
 (a)
(a)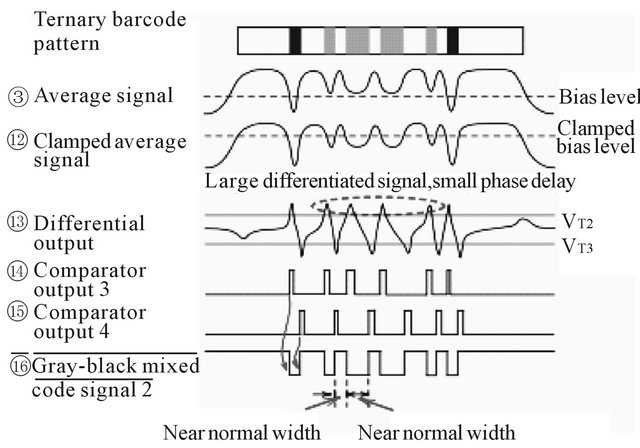 (b)
(b)
Figure 3. Substantial operation difference between the EDFPD (a) and DBD (b) methods.
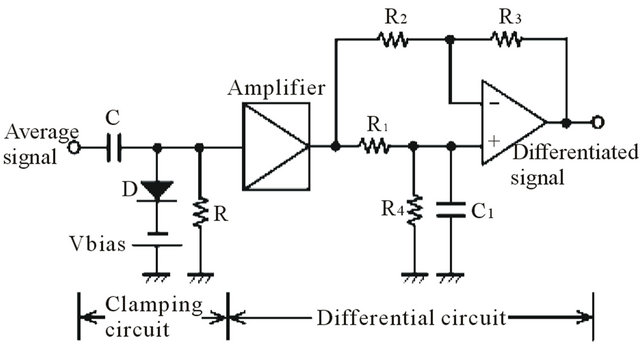
Figure 4. Configuration of the clamping and differential circuits.
difference between an original average signal and its integrated signal. The differentiated signal consists of a maximum of +10.5 V and a minimum of −10.5 V. The transfer function G of this differential circuit except for an amplifier is given by Equation (1). Since the resistance R4 is greatly large, it is ignored.
 (1)
(1)
4. Experimental Results
A prototype system for detecting a single-line four character (except for start and stop codes) ternary barcode has been developed. The differential circuit except for the amplifier has differential transfer function characteristics, which are calculated as gain characteristics of |G| from Equation (1), theoretically rising over 10 kHz as shown in Figure 5. The gain of the amplifier in the differential circuit was set to 9. The elements of the clamping circuit were set to C = 33 μF and R = 1 kΩ. Operating conditions of the comparator thresholds VT1, VT2, and VT3 were 0 V, 6 V, and −6 V.
The detection performance of the system with the clamp bias was closely examined. Figure 6 shows the detection signal processing waveforms when the clamp bias voltage Vbias was −0.4 V. Under this condition, the gray signal in the clamped average signal was biased to nearly 0 V. Figure 7" target="_self"> Figure 7 shows the clamping effect. We can see that the code width for gray bars of the gray-black mixed code signal in the clamp operation is extended and the code width for the white bars is contracted so that the code width of each gray-black mixed code signal is near the normal value. For rising gray signals, the code signal is a little delayed compared with the one without the clamp operation. This is because the rise in the clamped

Figure 5. Gain versus frequency for the differential circuit excluding the amplifier.
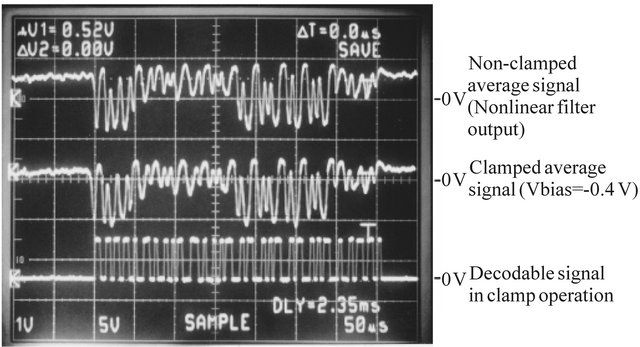
Figure 6. Detection signal processing waveforms.
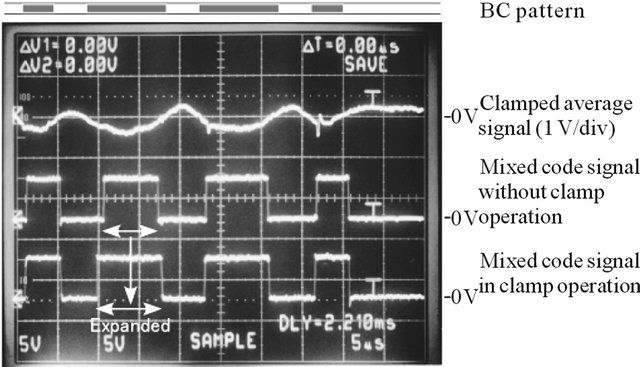
Figure 7. Clamping effect in the DBD method.
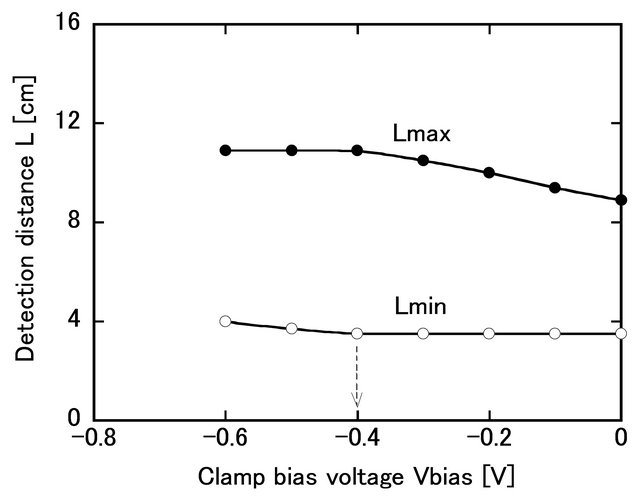
Figure 8. Detection distance versus clamp bias voltage. W = 0.25 mm. vs = 333 scans/sec.
average signal approaches the negative saturation level.
Figure 8 shows the detection distance versus clamp bias voltage for a BC of W = 0.25 mm. The detection range extends as  increases toward the negative level because an optimum bias for the gray signals is achieved. The detection range represents the difference between the maximum and minimum detection distances, which are the distances between the BC and the surface of the polygonal mirror. At a Vbias of near −0.4 V, the detection range reached a maximum. For a Vbias over −0.4 V, the detection range decreased because the bias level of the gray signals was close to the negative saturation level. Thus, the detection range for a BC with W = 0.25 mm was extended to a practical range of 7.4 cm by employing the DBD method of a clamp bias voltage Vbias = −0.4 V. Therefore, we can say that the clamp method is effective in increasing the detection range. Figure 9 shows the detection distance versus the minimum bar width. The usefulness of a DBD method using the clamp bias is seen for a barcode with a bar width narrower than 0.3 mm. The detection range of 7.4 cm for a barcode of W = 0.25 mm is 1.4 times that of the conventional EDFPD detection technique.
The possibility of high-speed detection was then examined. Figure 10 shows the detection distance versus scanning speed for a BC of W = 0.25 mm. It was established that a maximum scanning speed of 385 scans/sec, which is 7.7 times higher than the ~50 scans/sec achieved in conventional CCD cameras, was obtained for a practical detection range of more than 5 cm for a W of 0.25 mm.
5. Differential Operation Simulation
To evaluate the optimum voltage of clamp bias non-experimentally, dynamic operation simulation for the differential circuit through SPICE is thought to be effective. Here, the code width is estimated using a fall delay time td1 and a rise delay time td2, which will be obtained through dynamic operation simulation of the differential circuit. Figure 11 shows a simulation model waveform of the clamped output gray signal (gray signal part in the
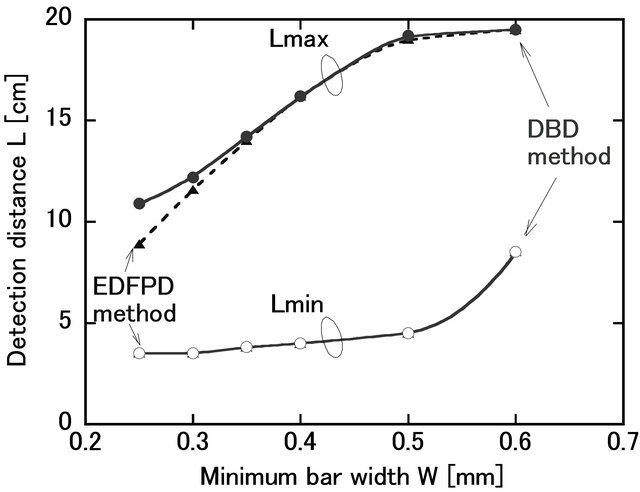
Figure 9. Detection distance versus minimum bar width. vs = 333 scans/sec. Vbias = −0.4 V.
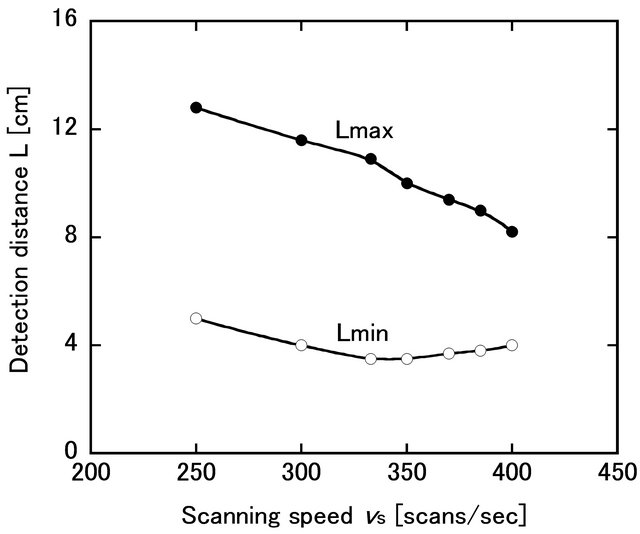
Figure 10. Detection distance versus scanning speed. W = 0.25 mm. Vbias = −0.4 V.
output signal of the clamping circuit), which is nearly consistent with the real operation waveform near the detection distance limit (L = 10 cm), a differential output and a code signal. The repetition cycle of the clamped output gray signal was set at 13.5 μsec. The definition of delay times td1 and td2 is from the clamped output’s rise beginning to the comparator threshold voltage −6 V and from its fall beginning to the comparator threshold 6 V as indicated in this figure. The differential output is obtained through a couple of two serial diodes connected in opposite direction behind the differential circuit shown in Figure 4, which is inserted to decrease its signal level to the comparator. A 10 kΩ load resistor was loaded on the output terminal of a couple of two serial diodes. A noninverting feedback type configuration consisting of the OP Amp (LM318) and four resistors with a gain of 9 was used for the amplifier. The same OP Amps were used in differential and amplification parts of the differential circuit. Simulation was carried out using SPICE in level 3 [14]. In simulation, the differential output waveform depending on the middle voltage of the clamped output corresponding to a bias level of the clamped average signal was observed. The code signal was obtained by comparing the differential output with the threshold voltages of −6 V and 6 V on the manual operation subsequent to the simulation. Figure 12 shows the delay
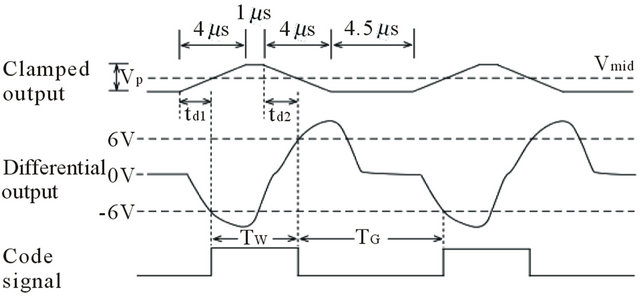
Figure 11. Simulation model waveform.
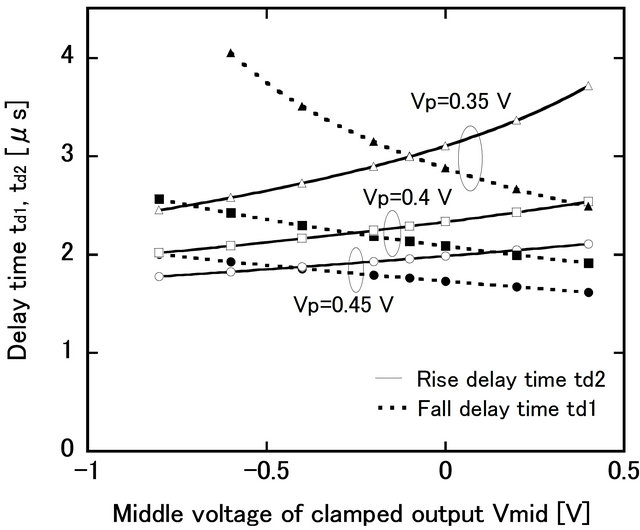
Figure 12. Delay time versus middle voltage of clamped output.
time versus middle voltage of clamped output. 0.45 V might as well be considered as an amplitude of the clamped output gray signal Vp, because clamped output gray signals are mostly operating with this amplitude near the detection distance limit. Under this condition, in the middle voltage of clamped output Vmid of 0.4 V, which is correspondent to the clamp bias voltage Vbias of 0 V (equivalent to the case of non-clamp bias), the large difference of 0.5 μsec between the delay times td1 and td2 is seen. The operation waveform at a Vmid of 0.4 V is shown in Figure 13(a). In this case, the ratio of a narrow white code width Tw to a wide gray code one TG is 1 to 1.4 (This means that it is impossible for the system to distinguish a narrow white code “0” from a wide gray code “1”). On the other hand, in the vicinity of the middle voltage of clamped output Vmid of −0.1 V, which corresponds to the clamp bias voltage Vbias of −0.4 V, the delay times td1 and td2 approach (The difference becomes only less than 0.2 μsec). The operation waveform at a Vmid of −0.1 V is shown in Figure 13(b). In this case, the ratio of code widths Tw to TG is 1 to 1.6 (This means that it is possible for the system to distinguish a na-
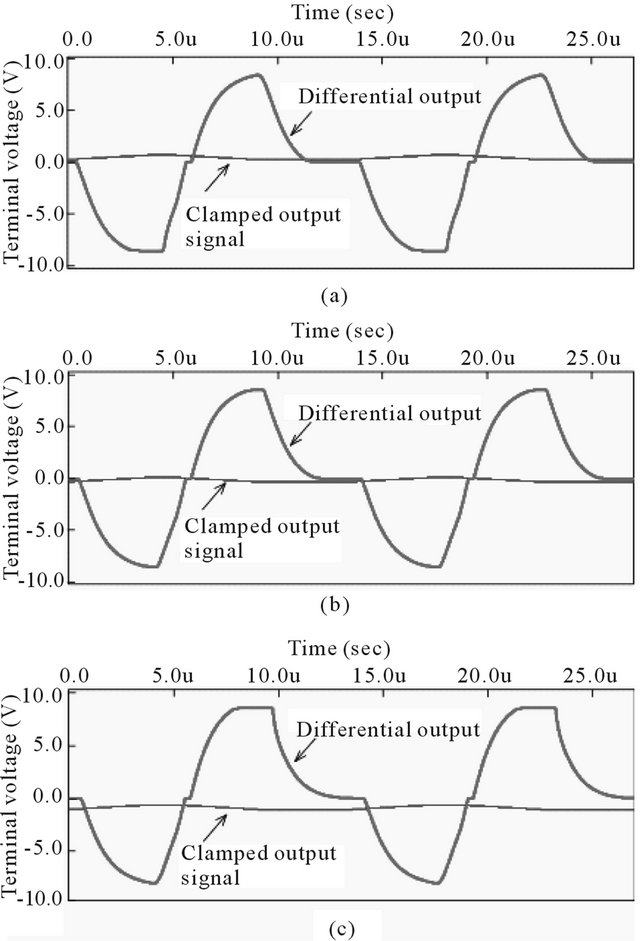
Figure 13. Differential output depending on the middle voltage of clamped output. Vmid is 0.4 V (a), −0.1 V (b), and −0.8 V (c). Vp = 0.45 V.
rrow white code “0” from a wide gray code “1”). Therefore, we can see that the Vmid of −0.1 V is suitable for detection, while that of 0.4 V is not. The previous experimental result of optimum clamp bias voltage Vbias (opt) of −0.4 V is nearly consistent with this simulation result.
Vp of gray signals in the actual clamped output waveform sometimes becomes 0.4 V near a wide white bar. When the Vmid is −0.1 V, even in clamped output gray signals with such different amplitudes, narrow and wide code widths in the code signal are enough to be distinguished. However, when a narrow gray signal with amplitude of 0.35 V subsequent to a wide gray signal is contained in this clamped output waveform, the delay times td1 and td2 become large (Figure 12). As a result, the code width for a narrow white bar adjacent to the wide gray bar becomes too wide (these bar widths cannot be distinguished properly). That is, this causes detection error. Thus, though the Vmid of −0.1 V is suitable even when Vp changes within the range of 0.4 - 0.45 V, it is not so when Vp locally changes to 0.35 V.
Though the Vmid of −0.4 V for Vp = 0.45 V seems most comfortable because of indicating nearly equal delay times, the comfortable voltage of Vmid becomes −0.2 V for Vp = 0.4 V. The optimum clamp bias voltage Vbias (opt) of −0.4 V (equivalent to Vmid = −0.1 V) in experiment was slightly shifted from these values. It is thought to be due to the slight deviation of the clamped output’s amplitude and rise and fall times. Especially, the deviation of Vp seems to be a significant factor for the shift of the optimum clamp bias voltage as observed in Figure 12.
An operation waveform at a Vmid of −0.8 V corresponding to the large negative clamp bias is also shown in Figure 13(c). It is clear that the fall delay time td1 becomes large (as a result a narrow gray width becomes large) and so seems to make the system difficult to detect the BC properly. Thus, it was confirmed that code width estimation through the dynamic operation simulation of the differential circuit using SPICE is effective in approximately searching for an optimum clamp bias voltage.
6. Conclusion
A novel ternary barcode detection system employing a dual-bias differential method, which is suitable for increasing the detection range at high scanning speeds, was presented. The new method was shown to be useful for increasing the detection range for ternary barcodes with a bar width not wider than 0.3 mm. The detection range of the system for minimum bar width W = 0.25 mm was extended to a practical detection range of 7.4 cm, which is 1.4 times that of the conventional envelope-differential fixed-period delay detection technique, because of the optimal bias of the gray bar signals by a clamping circuit for the optimal differential. By estimating gray and white code widths against the clamp bias through the dynamic operation simulation of a differential circuit using SPICE, the resultant ratio of estimated code widths were nearly consistent with the experimental results. Thereby, we can conclude that the dynamic simulation is effective for approximate estimation of the optimum clamp bias voltage. The system enabled detection with an improved scanning speed of over 7.7 times that of conventional CCD cameras. It is considered that the system will be suitable for the real-time identification of goods on production lines and in automated warehouses. Further studies should concern higher density ternary barcode systems with a narrower bar width of nearly 0.2 mm equivalent to the binary barcode scanners.
REFERENCES
- T. Kan, N. Ri, O. Shin and T. Tei, “Machine Recognizable Code and Its Encoding Decoding Method,” Japan Patent No. 3336311, August 2002.
- H. Endo and M. Takahashi, “Two-Dimensional Code and Two-Dimensional Code Reader and Program,” Japan Patent No. 4435851, January 2010.
- A. P. Gross and D. X. Rodriguez, “Color and Shape System for Encoding and Decoding Data,” US Patent No. 5869828, February 1999.
- J. Hiramoto, “Knowledge of Barcode and Two-Dimensional Code,” 5th Edition, Japan Industrial Publishing, Tokyo, 2001.
- T. Nagaya, T. Yamazaki, M. Hara and T. Nojiri, “TwoDimensional Code for High-Speed Reading,” Proceedings of the 52th Information Processing Society of Japan (IPSJ) General Conference, 6-8 March 1996, pp. 253-254.
- H. Wakaumi and C. Nagasawa, “A Ternary Barcode Detection System with a Pattern-Adaptable Dual Threshold,” Sensors and Actuators A: Physical, Vol. 130-131, 2006, pp. 176-183. doi:10.1016/j.sna.2005.12.017
- H. Wakaumi and C. Nagasawa, “A 2D Ternary Barcode Detection System with a Dual Threshold,” Proceedings of the 5th IEEE Conference on Sensors, Daegu, 22-25 October 2006, pp. 1511-1514.
- H. Wakaumi, “A Six-Line Ternary Barcode Detection System with a Dual Threshold Method,” International Journal of Mechatronics and Manufacturing Systems, Vol. 3, No. 3-4, 2010, pp. 261-273. doi:10.1504/IJMMS.2010.033187
- H. Wakaumi, “A High-Density Ternary Barcode Detection System Employing an Envelope-Differential Composite Method,” Proceedings of the 7th IEEE Conference on Sensors, Lecce, 26-29 October 2008, pp. 1076-1079.
- H. Wakaumi, “An Envelope-Differential Composite Method for a High-Density Ternary Barcode Detection System,” The IEICE Transactions on Fundamentals of Electronics, Communications and Computer Sciences, Vol. J94-A, No. 2, 2011, pp. 142-144.
- H. Wakaumi, “A High-Density Ternary Barcode Detection System Employing a Stable Fixed-Period Delay Method,” Optical Review, Vol. 18, No. 5, 2011, pp. 408-413. doi:10.1007/s10043-011-0078-z
- H. Wakaumi, “A Ternary Barcode Detectionn System Employing a Dual-Bias Differential Method,” The 13th Mechatronics Forum International Conference, Linz, 17-19 September 2012, pp. 399-403.
- T. Negishi, H. Nakane and E. Takada, “Fundamental Electronic Circuitry,” Corona Publishing, Tokyo, 1998.
- J. Englebert, T. Nguyen and C. Thurston, “B2 Spice A/D 2000 Japanese Manual,” 3rd Edition, Sora Computer Products, Tokyo, 2001.