Journal of Sensor Technology
Vol.2 No.1(2012), Article ID:17915,5 pages DOI:10.4236/jst.2012.21002
Investigation on Temperature Sensing of Nanostructured Zinc Oxide Synthesized via Oxalate Route
Nanomaterials and Sensors Research Laboratory, Department of Physics, University of Lucknow, Lucknow, India
Email: richadolly@rediffmail.com
Received December 26, 2011; revised January 10, 2012; accepted January 24, 2012
Keywords: Temperature Sensor; Activation Energy; Nanostructure; Resistance; Surface Morphology
ABSTRACT
A detailed study is reported of the synthesis and characterization of n-type ZnO nanomaterial and its application as temperature sensor. The ZnO nanomaterial has been synthesized through pyrolysis of the oxalate produced by a conventional precipitation method. It is synthesized by flash heating the oxalate at 450˚C for 15 min. Pellet of this material was prepared and used as a sensing element. The variations in resistance of sensing pellet at different temperatures were recorded. The relative resistance was decreased linearly with increasing temperatures over the range, 120˚C - 260˚C. The activation energy of ZnO calculated from Arrhenius plot was found 1.12 eV. Temperature response in terms of the relative variation, ∆R, of sensor resistance to a given temperature was measured. Scanning electron micrograph of the sensing element has been studied. Pellet of the ZnO is comprised of nanorods of varying diameters and different lengths. Diameter of ZnO nanorods varies from 75 to 300 nm. X-ray diffraction pattern of the sensing element reveal their nano-crystalline nature. Optical characterization of the sensing material was carried out by UV-visible spectrophotometer. By UV-Vis spectra, the estimated value of band gap of ZnO was found 4.7 eV.
1. Introduction
Nano sized zinc oxide due to the large band gap 3.37 eV and high exciton binding energy of 60 meV shows various useful properties and gives large and diverse range of growth of different type of morphologies such as nanosheets, nanocombs, nanobelts, nanowires and nanorings, which may be used in various applications [1-6]. It is one of the promising materials among metal oxides for use in different types of sensors [7-22]. As the temperature is an important parameter for measuring the different properties of materials. Because of various useful properties of ZnO, it behaves as good temperature sensing applications [23-26].
2. Experimental
2.1. Synthesis of Material
ZnO was prepared by flash thermolysis of zinc oxalate produced by a conventional precipitation method. In this method a sodium oxalate solution was mixed with a zinc sulphate solution at room temperature in the molar ratio 1:1. It yielded precipitate of zinc oxalate. This precipitate was filtered out and washed with deionized water till the sulphate and other impurities were completely removed. Its subsequent calcination at 450˚C for 15 min gave zinc oxide in powder form. The pellets of ZnO powder with 10% glass powder as a binder were produced by using hydraulic pressing machine (M.B. Instruments, Delhi) under the pressure of 616 MPa at room temperature (27˚C). Addition of glass powder improved the mechanical strength of the pellet.
2.2. Characterizations of n-Type ZnO
Scanning Electron Micrograph studies of ZnO nanomaterial in the form of pellet is shown in Figure 1. ZnO rods of varying diameters and lengths can be seen. Diameters of ZnO nanorods varied from 75 to 300 nm. X-Ray diffraction system (X-Pert, PRO, Netherland) with Cu-Kα source radiation having wavelength 1.54 Å was used for the characterization of the sample. The obtained XRD pattern (Figure 2) show the extent crystallization and the crystallite sizes of sensing materials were calculated using Debye-Scherrer’s formula. Major phase of ZnO exist for 2θ = 36˚ at the plane (101) as shown in Figure 2. The Average crystallite size calculated from Schrrer’s Formula is found to be 64 nm.
Optical characterization of the sensing element was done by using UV-visible spectrophotometer (Varian, Carry-50Bio). The band gaps estimated from the UV-Vis spectra as shown in Figure 3 of ZnO was 4.7 eV. The increase in band gap due to quantum confinement effect in nanoparticle.
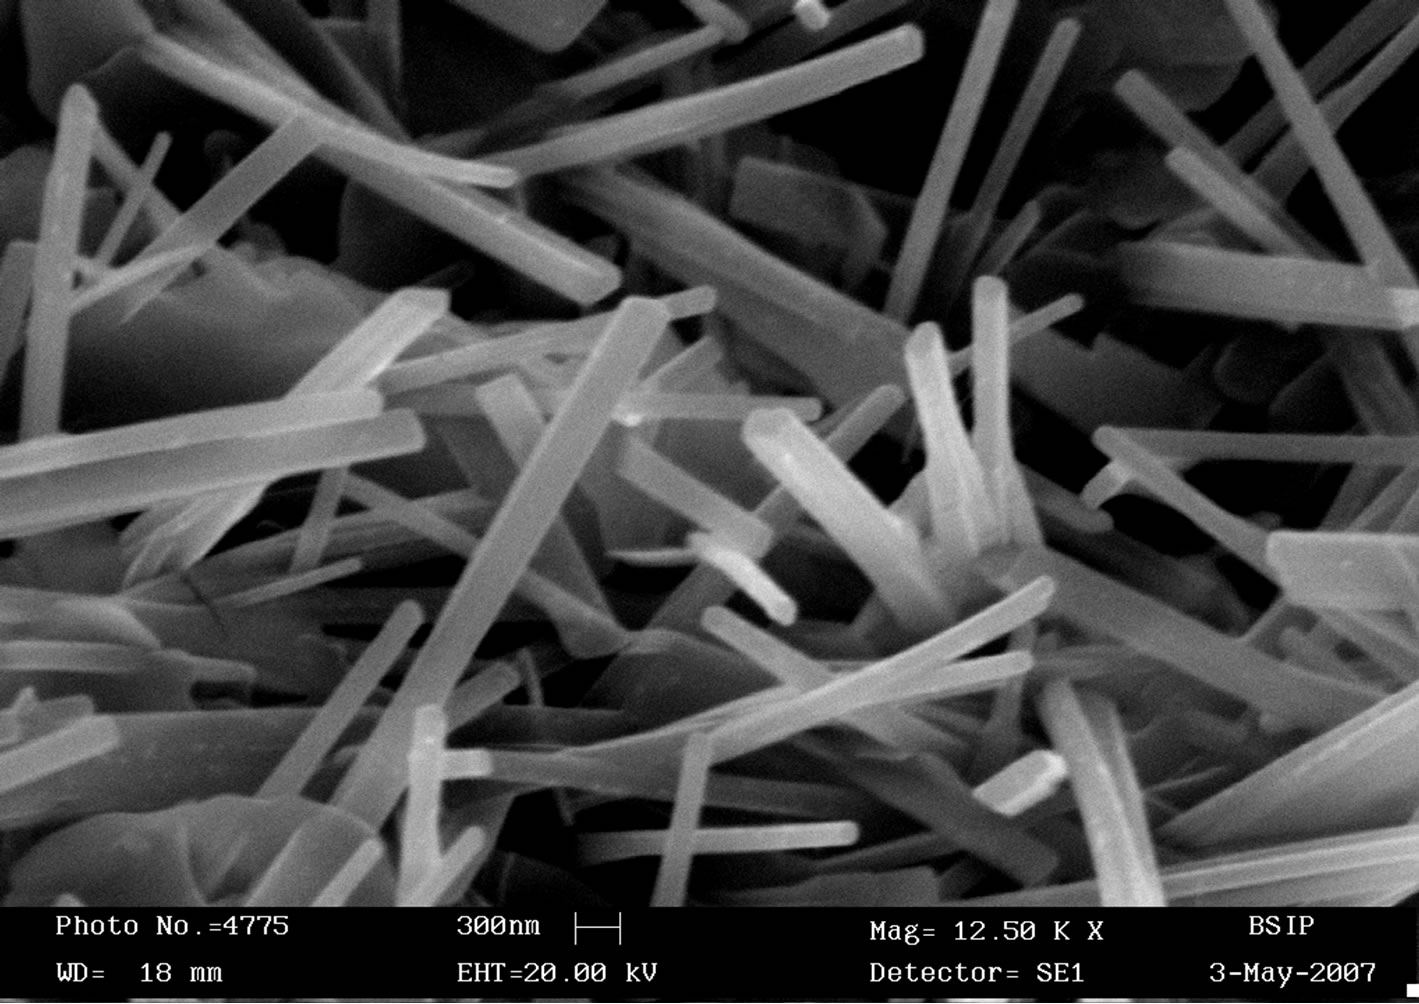
Figure 1. Scanning electron micrograph of ZnO in the form of pellet.
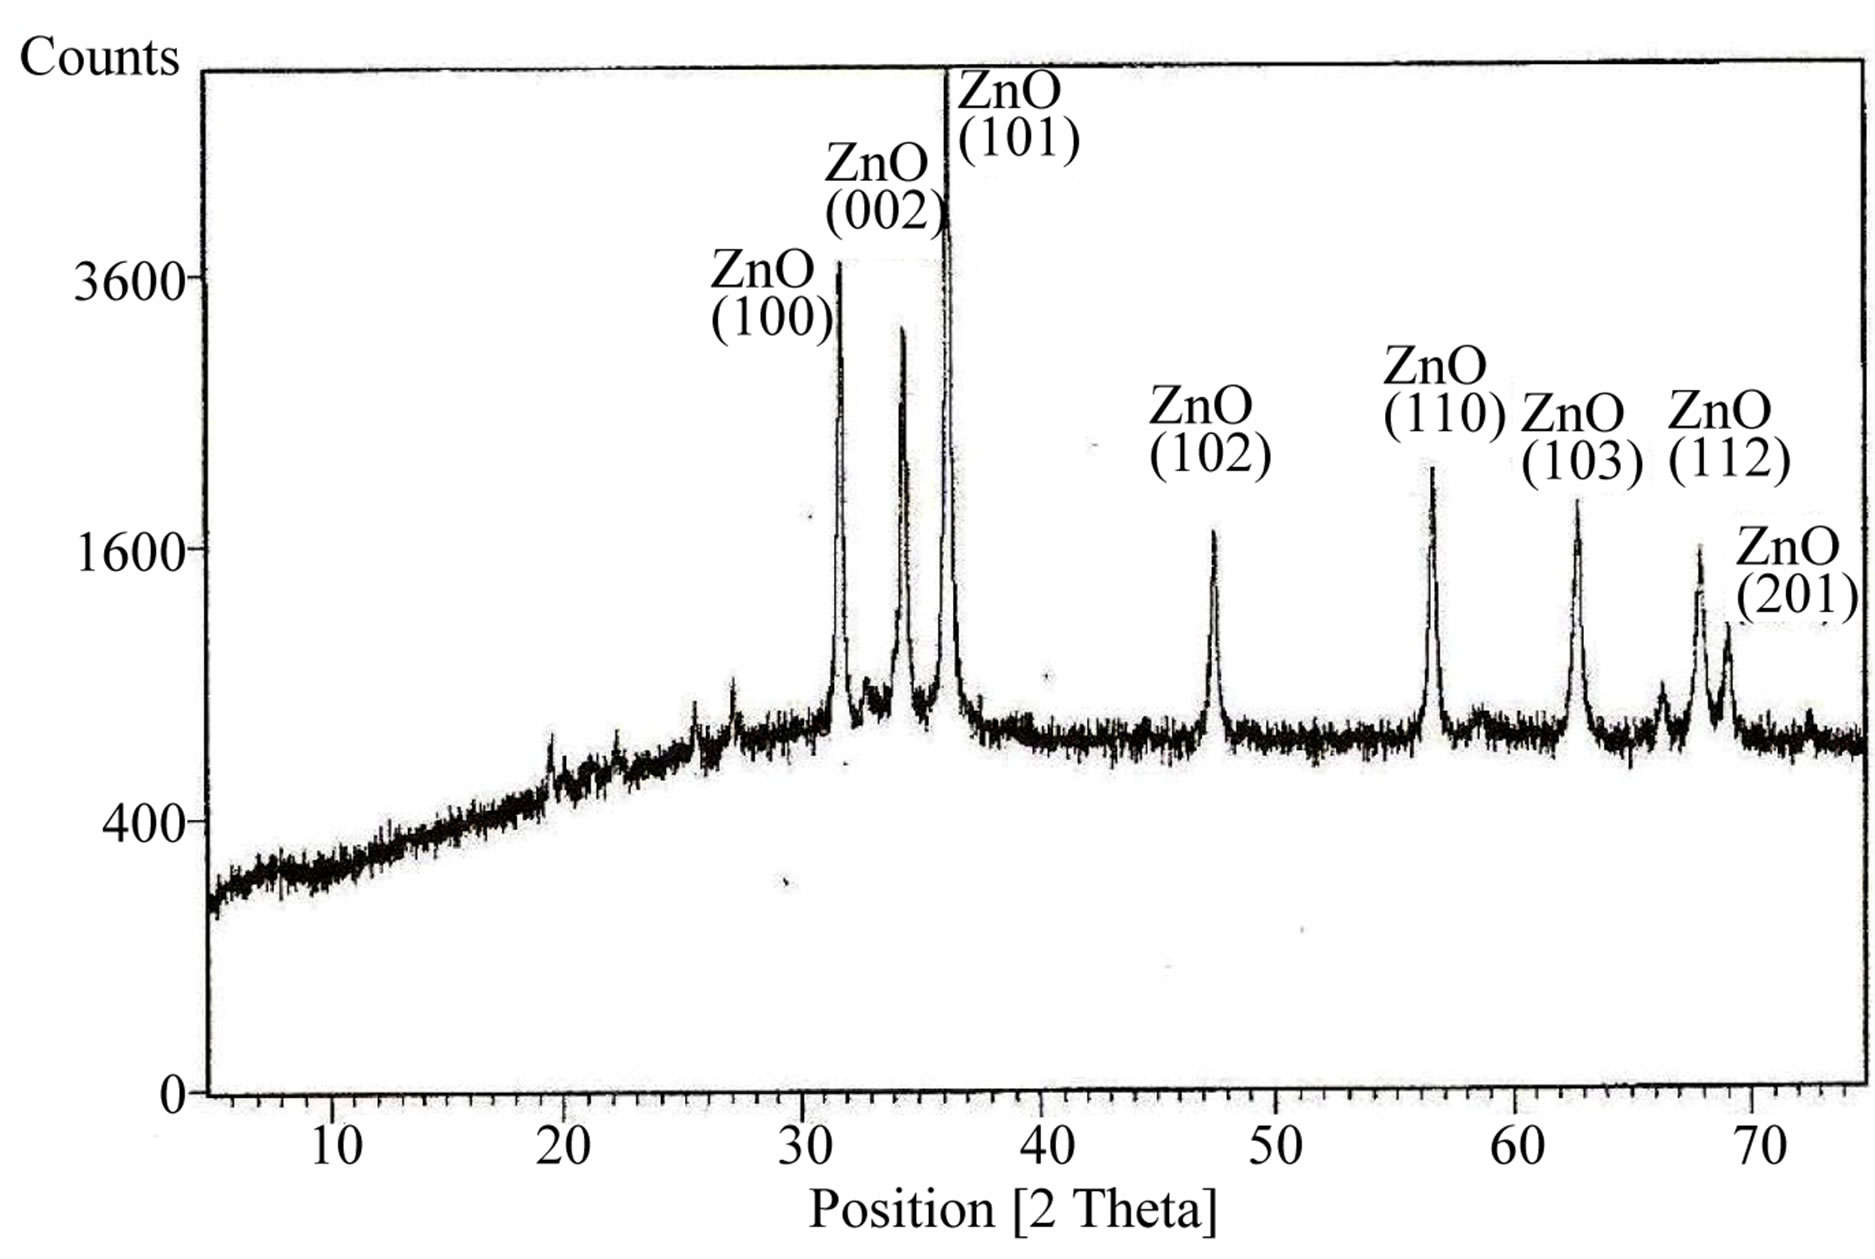
Figure 2. X-Ray diffraction of synthesized ZnO powder prepared at room temperature.
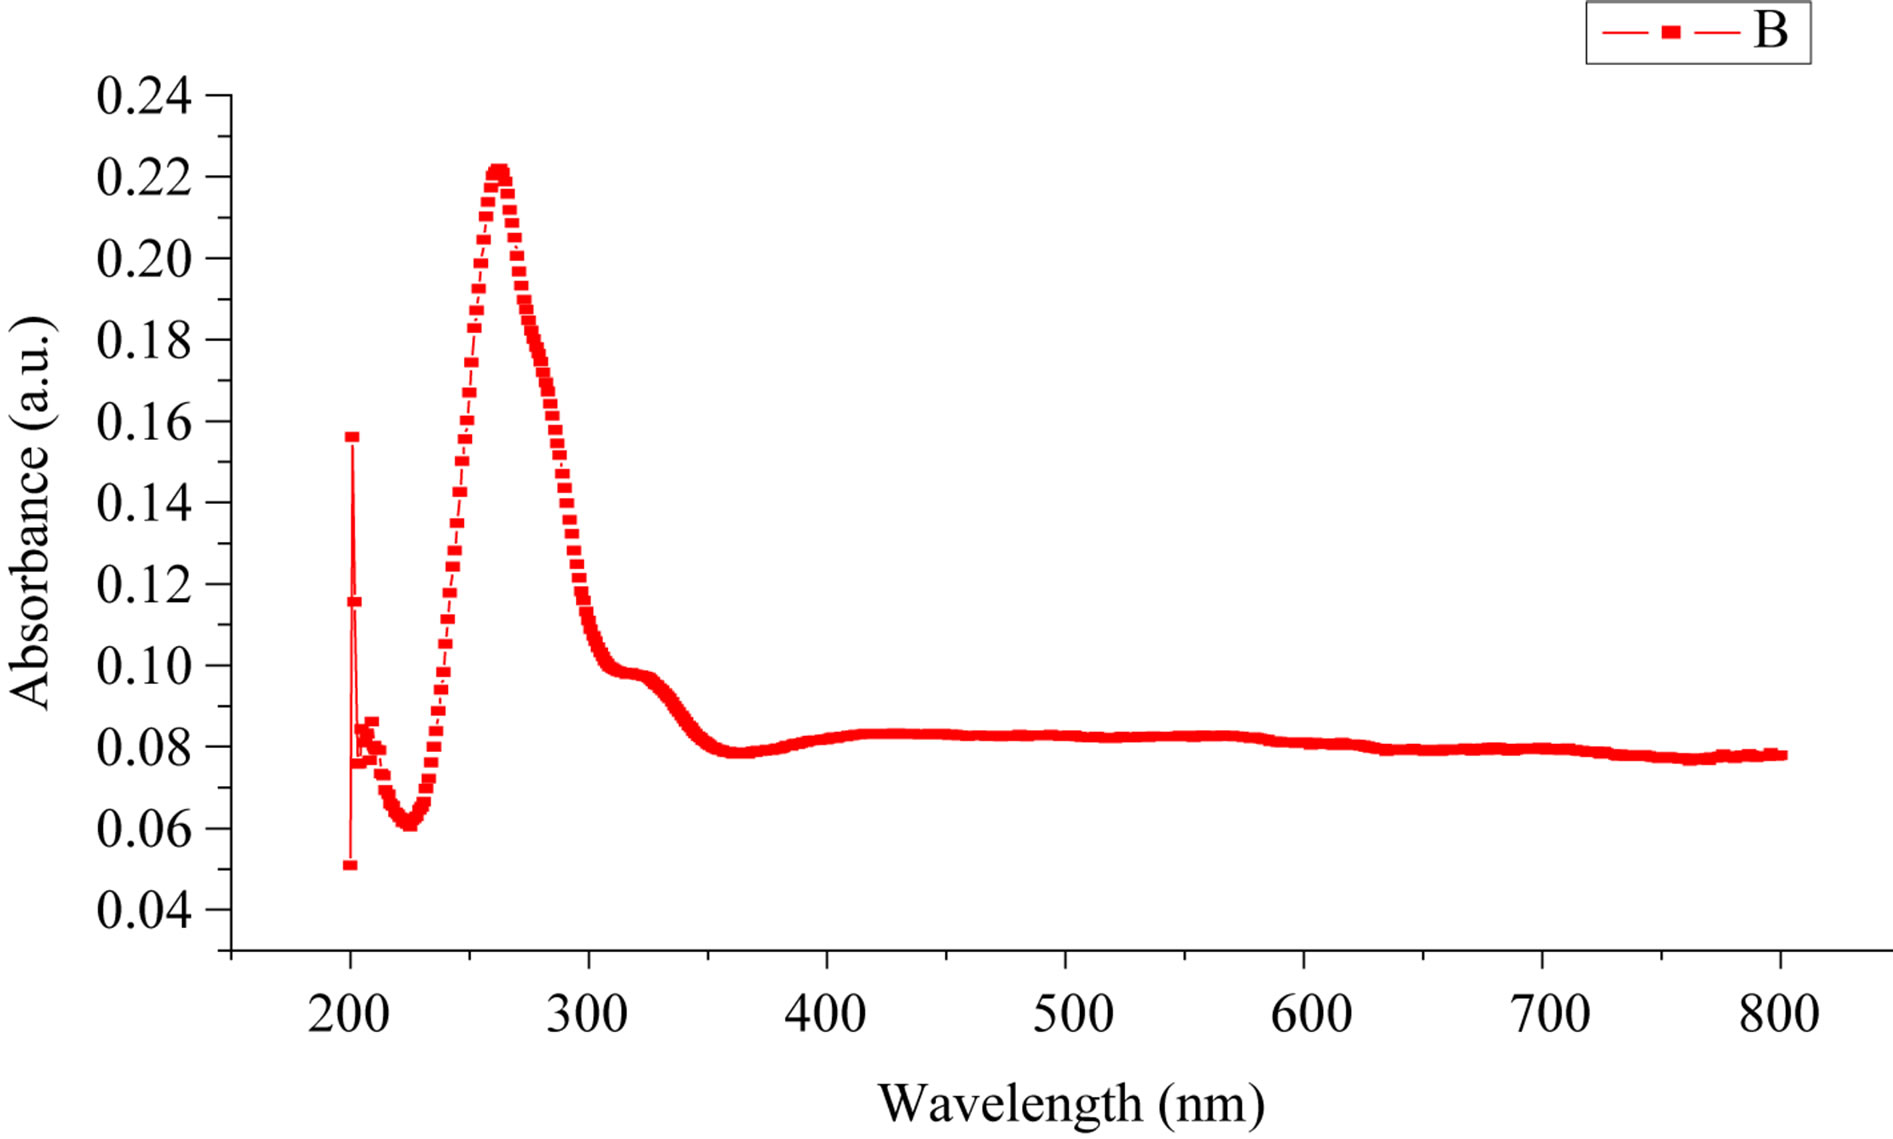
Figure 3. UV-Vis spectra of ZnO.
2.3. Experimental Procedure
The circular pellet having diameter 10 mm and thickness 4 mm was made by using hydraulic pressing machine (M.B. Instruments, Delhi) under the pressure of 616 MPa at room temperature. Further the pellet was put within Ag-Pellet-Ag electrode configuration as shown in the Figure 4 and this configuration was put inside the electrical furnace for temperature sensing and variation of resistance with different temperatures 120˚C, 140˚C, 160˚C, 180˚C, 200˚C, 220˚C, 240˚C, 260˚C were recorded. The used heating rate was 2˚C/minute.
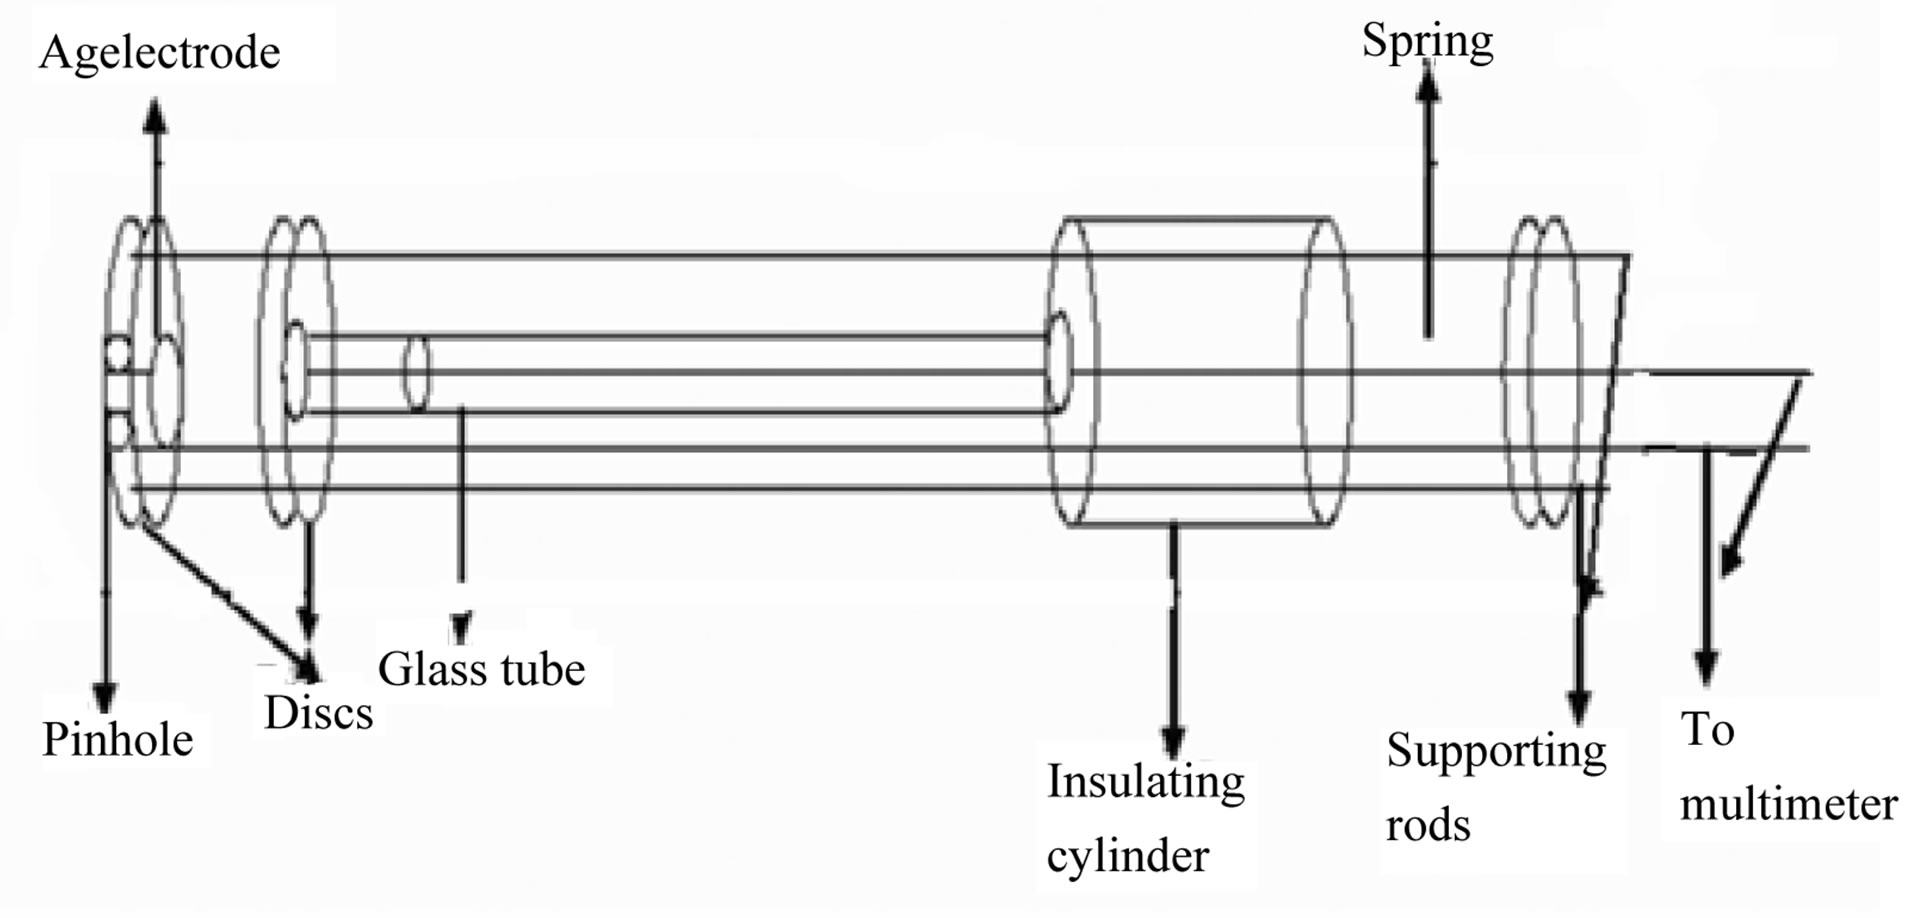
Figure 4. Sample holder (Ag-pellet-Ag electrode configuration).
The resistance of the sensing material decreases over the entire range of temperature as shown in Figure 5.
2.4. Temperature Sensitivity
The response of the sensing material to increasing temperature has been investigated. Temperature is in an important variable to document when measuring sensitivity. The relative resistance of the sample decreased linearly with increasing temperatures over range. The temperature response can be given in terms of relative variation, ∆R, of the sensor resistance to a given temperature,

where R0 is the initial resistance of the sensor and Rt is the resistance at different temperature. The calibration curves for the sensing material were obtained by plotting ∆R against the temperatures. Figure 6 shows the changes in ∆R against temperature. The sensitivity of sample is determined from the slope of ∆R.
2.5. Activation Energy by Thermal Resistance Method
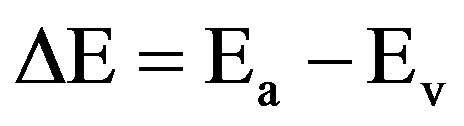
Activation energy (DE) measures the thermal or other form of energy required to raise electrons from the donor levels to the conduction band or to accept electrons by the acceptor levels Ea from the valence band respectively for nand p-type materials. Activation energy corresponds to the energy difference (Ec – Ed) and (Ea – Ev) respectively for nand p-type semiconductors as shown in Figures 7 and 8.
Activation energy by thermal resistance method can be measured from the variation of σ or ρ and conveniently of R with the temperature.
The temperature dependence of conductivity for a semi conducting material can be obtained using following simplified expressions:
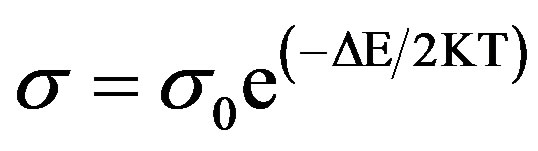
Since dimensions remain the same during small temperature variations, therefore, the equation can be simplified for resistance as
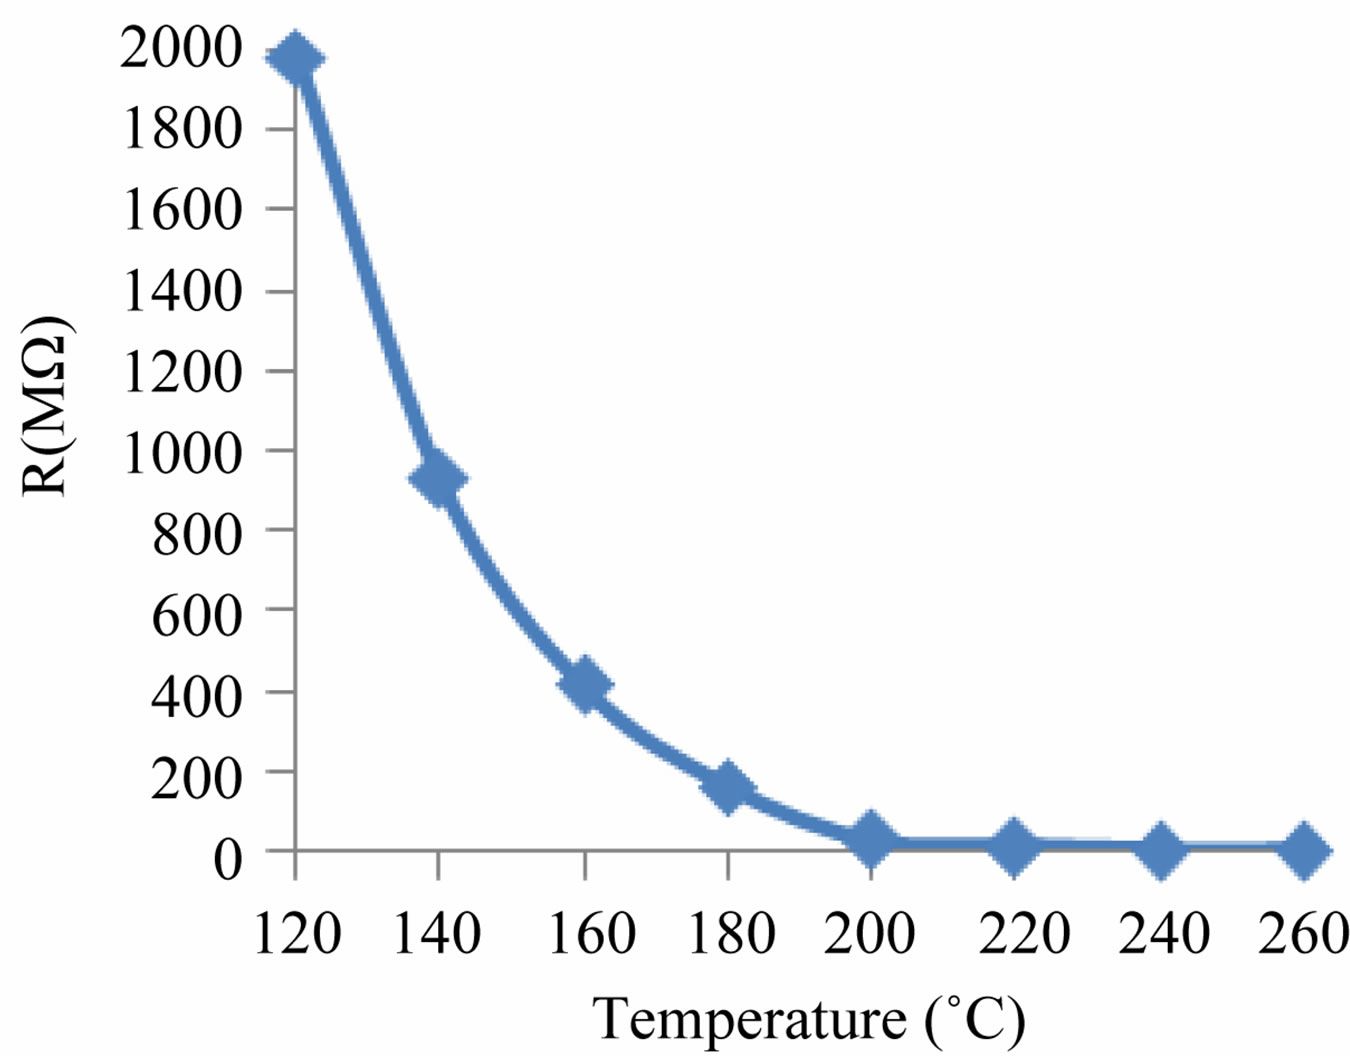
Figure 5. Variations in resistance with temperatures of ZnO sensing element.
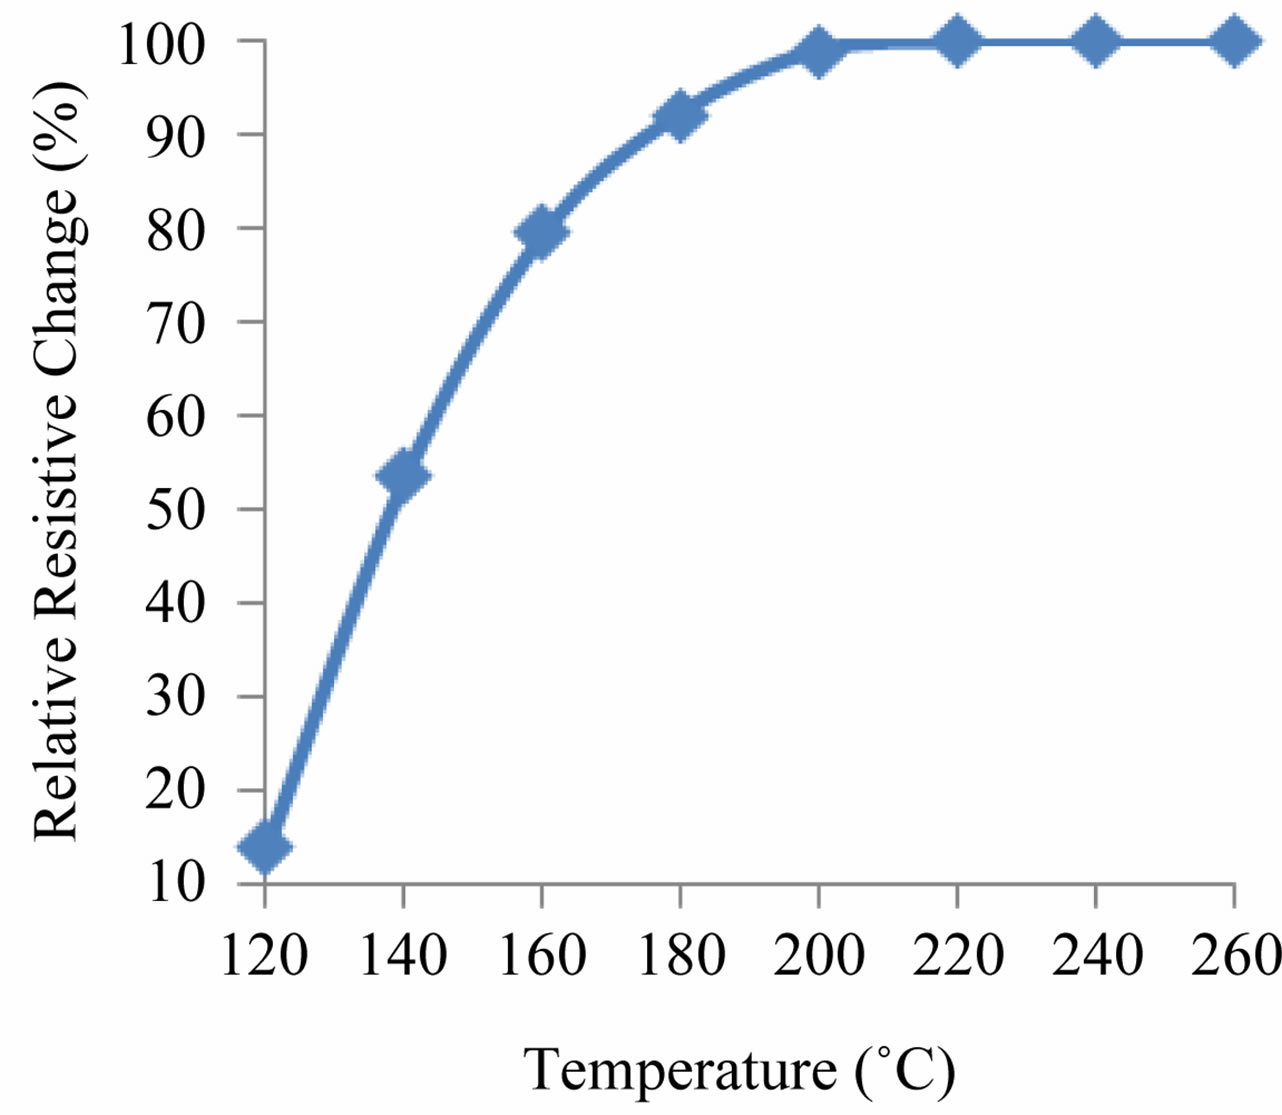
Figure 6. Relative resistive change in % against temperature.

Figure 7. Band diagram for activation energy in n-type semiconductor.
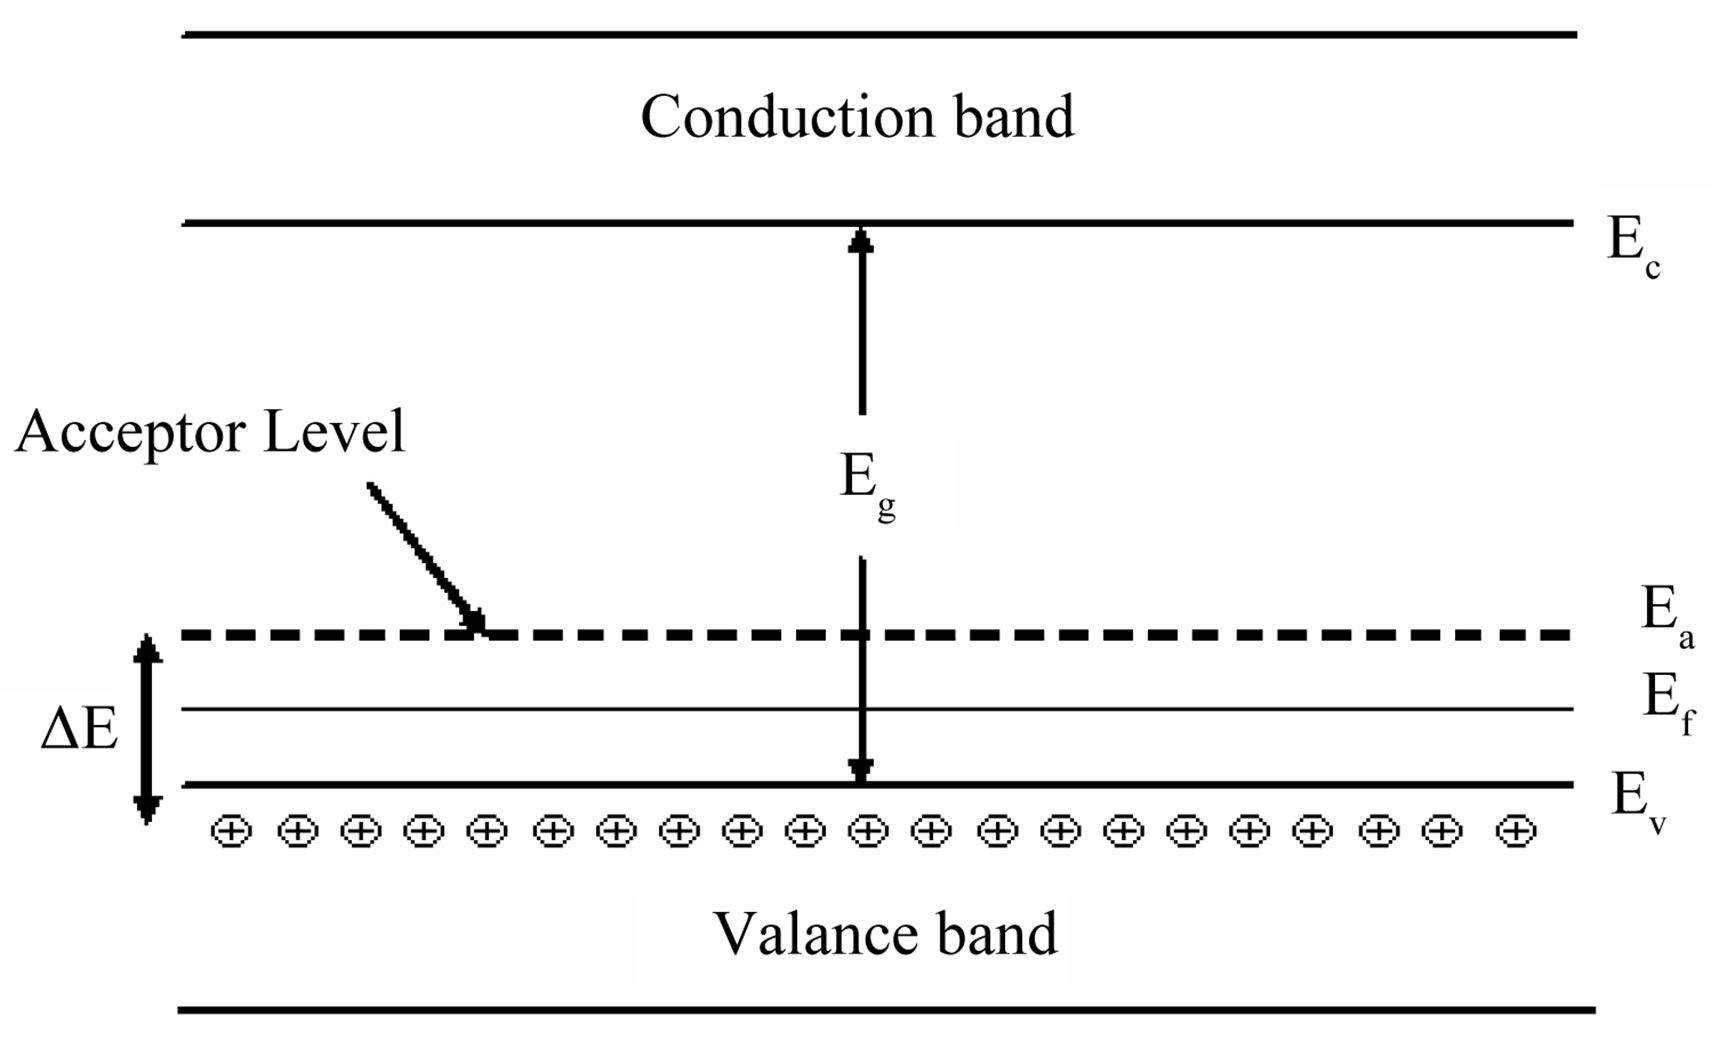
Figure 8. Band diagram for activation energy in p-type semiconductor.
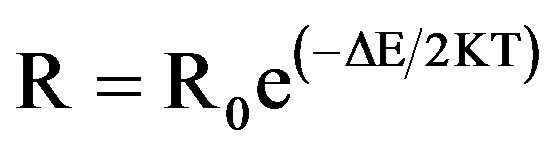
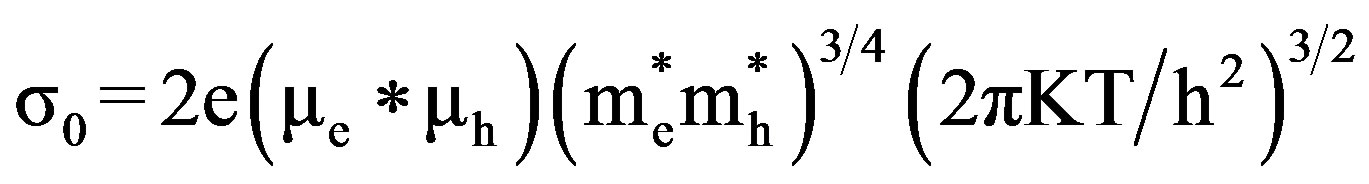
where σo, ρo or Ro are the pre-exponential factors and is given by 1) For p-type semiconductor,
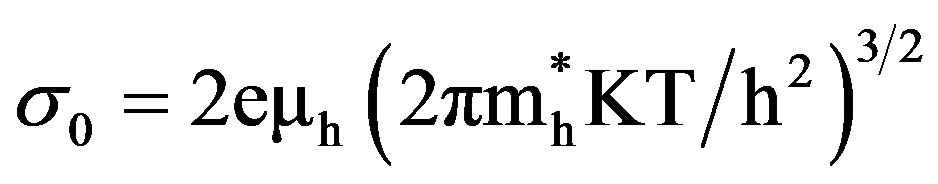
and activation energy for the excitation of acceptor atoms,
2) For n-type semiconductor,
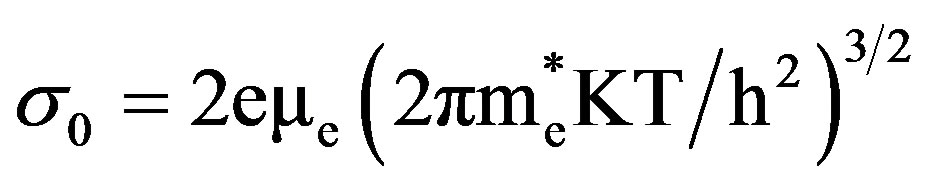
and activation energy for the excitation of donor atoms,
3) For intrinsic semiconductor
and activation energy,
Here ,
,  are effective masses and μe, μh are mobilities of electrons and holes respectively, Ec and Ev are energy values corresponding to bottom-edge of the conduction band and the top edge of the valence band respectively, Eg is the band gap of the semiconductor, T is the absolute temperature of the material and K is the Boltzmann constant.
The temperature resistance plot in the form of lnρ and (1/T), known as Arrhenius plot, has a slope of (DE/2K) according to equation
 [27]
[27]
By measuring the slope of Arrhenius plot of a linear zone, we have calculated the activation energy of nanostructured ZnO.
Figure 9 shows the variation of lnR as a function of inverse temperature (Arrhenius plot). The resistance variation of the ZnO can be ascribed to typical band conduction. It can be noted that a change in temperature will alter the resistance because both the charge of the surface species (O2, 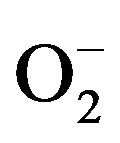 , O– or O2–) as well as their coverage can be altered in this process. Since the conduction process in metal oxide semiconducting materials depend heavily on grain boundaries therefore large and small particle sizes of materials are responsible for deviation from straight line behavior. In the overall conduction process a contribution arising from the participation of ZnO lower average particle size and another with higher average particle size i.e., the distribution of particle size dominates in thermally activated conduction process.
Figure 9. Arrhenius plot for the ZnO sensing element.
3. Results and Discussion
The physical property that defines a semiconductor is its decrease in its electrical resistance with increasing temperature. Therefore, Figure 5 show the semiconducting nature of these sensing materials. In this figures the decrease in resistance with the temperature must mainly regarded as due to the thermally activated mobility of the carriers rather than to a thermally activated generation of these. Basic principle based on change of electrical resistance with temperature and is available as negative temperature coefficient (NTC—resistance falls with rising temperature). NTC is the most usual type for temperature measurement, and the rate of change of resistance with temperature is very much higher than that of a resistance thermometer, providing high sensitivity within a small temperature span. This makes sensor very suitable for measuring temperatures around ambient and for medical applications.
The variations in temperature response of sensing element made of ZnO to a given temperatures have been shown in Figure 6. The results have shown that sensing element has the highest sensitivity to temperature, 0.40%/˚C. The energy transition in an investigated temperature interval (120˚C - 260˚C), which may be an electron excitation from valence band to an acceptor level, creates a hole in valence band for the conduction. Therefore this transition controls the R-T characteristics (Figure 9). The activation energy determined from the slope of resistance data was found 1.12 eV.
4. Conclusion
It was concluded that the laboratory model of the sensor fabricated using nanosized ZnO is a better sensing device for temperature because it has the highest average sensitivity 0.40%/˚C and most linear responses to the entire range of temperatures. Nano-structured ZnO was successfully synthesized by flash thermolysis of zinc oxalate. The material on heating above 450˚C gave nano-rods having diameter 75 - 300 nm which had good temperature sensing properties. The estimated value of activation energy for electrical conduction of charge carriers was found to be 1.12 eV. Thus, we can say that zinc oxide is promising materials for temperature sensing. Results are found to be reproducible and no ageing effects have been observed. Thus temperature sensor made of ZnO is cost effective, easy to fabricate and user friendly and can be used for both indoor and outdoor applications.
5. Acknowledgements
Dr. Richa Srivastava is highly grateful to University Grants commission, Delhi for Post Doctoral Fellowship (No. F.15-79/11 (SA-II).
REFERENCES
- S. L. Bai, J. W. Hu, et al., “Quantum-Sized ZnO Nanoparticles: Synthesis, Characterization and Sensing Properties for NO2,” Journal of Materials Chemistry, Vol. 21, No. 33, 2011, pp. 12288-12294. doi:10.1039/c1jm11302j
- J. Kim and K. Yong, “Mechanism Study of ZnO Nanorod-Bundle Sensors for H2S Gas Sensing,” Journal of Physical Chemistry C, Vol. 115, No. 15, 2011, pp. 7218- 7224. doi:10.1021/jp110129f
- X.-L. Yu, H.-M. Ji, H.-L. Wang, J. Sun and X.-W. Du, “Synthesis and Sensing Properties of ZnO/ZnS Nanocages,” Nanoscale Research Letters, Vol. 5, 2010, pp. 644-648. doi:10.1007/s11671-010-9528-y
- Q. Wei, G. Meng, X. An, Y. Hao and L. Zang, “Temperature Controlled Growth of ZnO Nanostructure: Branched Nanobelts and Wide Nanosheets,” Nanotechnology, Vol. 16, No. 11, 2005, pp. 2561-2566. doi:10.1088/0957-4484/16/11/016
- C. Xu, M. Kim, J. Chun and D. E. Kim, “The Selectively Manipulated Growth of Crystalline ZnO Nanostructures,” Nanotechnology, Vol. 16, No. 10, 2005, pp. 2104-2110. doi:10.1088/0957-4484/16/10/022
- L. Saad and M. Riad, “Characterization of Various Zinc Oxide Catalysts and Their Activity in the DehydrationDehydrogenation of Isobutanol,” Journal of the Serbian Chemical Society, Vol. 73, No. 6, 2008, pp. 997-1009. doi:10.2298/JSC0810997S
- S. K. Shukla, G. K. Parashar, P. Misra, B. C. Yadav, R. K. Shukla, A. Srivastava, F. Deva and G. C. Dubey, “On Exploring Sol-Gel Deposited ZnO Thin Film as Humidity Sensor: An Optical Fiber Approach,” Chemical Sensors, Vol. 20, 2004, pp. 546-547.
- X. Zhou, T. Jiang, J. Zhang, X. Wang and Z. Zhu, “Humidity Sensor Based on Quartz Tuning Fork Coated with Sol-Gel-Derived Nanocrystalline Zinc Oxide Thin Film,” Sensors and Actuators B, Vol. 123, No. 1, 2007, pp. 299- 305. doi:10.1016/j.snb.2006.08.034
- W. Wei, B. Suo, C. Nuanyang, M. Fei, W. Zhiyang, Q. Yong and X. Erqing, “Increasing UV Photon Response of ZnO Sensor with Nanowires Array,” Science of Advanced Materials, Vol. 2, No. 3, 2010 pp. 402-406. doi:10.1166/sam.2010.1103
- N. Kavasoglu and M. Bayhan, “Air Moisture Sensing Properties of ZnCr2O4,” Turkish Journal of Physics, Vol. 29, 2005, pp. 249-255.
- Y. Zhang, K. Yu, S. Ouyang, L. Luo, H. Hu, Q. Zhang and Z. Zhu, “Detection of Humidity Based on Quartz Crystal Microbalance Coated with ZnO Nanostructure Films,” Physica B: Condensed Matter, Vol. 368, No. 1-4, 2005, pp. 94-99. doi:10.1016/j.physb.2005.07.001
- L. Saad and M. Riad, “Characterization of Various Zinc Oxide Catalysts and Their Activity in the DehydrationDehydrogenation of Isobutanol,” Journal of the Serbian Chemical Society, Vol. 73, No. 10, 2008, pp. 997-1009. doi:10.2298/JSC0810997S
- B. C. Yadav, R. Srivastava, C. D. Dwivedi and P. Pramanik, “Moisture Sensor Based ZnO Nanomaterial Synthesized through Oxalate Route,” Sensors and Actuators B, Vol. 131, No. 1, 2008, pp. 216-222. doi:10.1016/j.snb.2007.11.013
- C. S. Rout, S. Harikrishna, S. R. C. Vivekchand, A. Govindaraj and C. N. R. Rao, “Hydrogen and Ethanol Sensors Based on ZnO Nanorods, Nanowires and Nanotubes,” Chemical Physics Letters, Vol. 418, No. 4-6, 2006, pp. 584-590. doi:10.1016/j.cplett.2005.11.040
- H. J. Lim, D. Y. Lee and Y. J. Oh, “Gas Sensing Properties of ZnO Thin Films Prepared by Microcontact Printing,” Sensors and Actuators A, Vol. 125, No. 2, 2006, pp. 405-410. doi:10.1016/j.sna.2005.08.031
- Z. P. Sun, L. Liu, L. Zhang and D. Z. Jia, “Rapid Synthesis of ZnO Nano-Rods by One-Step Room-Temperature, Solid-State Reaction and Their Gas-Sensing Properties,” Nanotechnology, Vol. 17, No. 9, 2006, pp. 2266-2270. doi:10.1088/0957-4484/17/9/032
- J. F. Chang, H. H. Kuo, I. C. Leu and M. H. Hon, “The Effect of Thickness and Operation Temperature of ZnO: Al Thin Film CO Gas Sensor,” Sensors and Actuators B, Vol. 84, No. 2-3, 2002, pp. 258-264. doi:10.1016/S0925-4005(02)00034-5
- J. Xu, Y. Chen, D. Chen and J. Shen, “Hydrothermal Synthesis and Gas Sensing Characters of ZnO Nanorods,” Sensors and Actuators B, Vol. 113, No. 1, 2006, pp. 526- 531. doi:10.1016/j.snb.2005.03.097
- N. Wu, M. Zhao, J. G. Zheng, C. Jiang, B. Myers, S. Le, M. Chyu and S. X. Mao, “Porous CuO-ZnO Nanocomposite for Sensing Electrode of High Temperature CO SolidState Electrochemical Sensor,” Nanotechnology, Vol. 16, No. 12, 2005, pp. 2878-2881. doi:10.1088/0957-4484/16/12/024
- Q. Zhang, C. Xie, S. Zhang, A. Wang, B. Zhu, L. Wang and Z. Yang, “Identification and Pattern Recognition Analysis of Chinese Liquors by Doped Nano ZnO Gas Sensor Array,” Sensors and Actuators B, Vol. 110, No. 2, 2005, pp. 370-376. doi:10.1016/j.snb.2005.02.017
- V. R. Shinde, T. P. Gujar and C. D. Lokhande, “LPG Sensing Properties of ZnO Fims Prepared by Spray Pyrolysis Method: Effect of Molarity of Precursor Solution,” Sensors and Actuators B, Vol. 120, No. 2, 2007, pp. 551- 559. doi:10.1016/j.snb.2006.03.007
- H. Karami, “Investigation of Sol-Gel Synthesized CdOZnO Nanocomposite for CO Gas Sensing,” International Journal of Electrochemical Science, Vol. 5, 2010, pp. 720-730.
- K. C. Dubey, K. P. Misra, A. Srivastava, A. Srivastava and R. K. Shukla, “Pulsed Laser Deposited Nanocrystalline Zinc Oxide Films as Temperature Sensor,” Proceeding of 13th National Seminar on Physics and Technology of Sensors, 2008, C-18-1-2.
- H. T. Wang, B. S. Kangand and F. Ren, “HydrogenSelective Sensing at Room Temperature with ZnO Nanorods,” Applied Physics Letters, Vol. 86, No. 24, 2005, pp. 243503. doi:10.1063/1.1949707
- J. H. He, S. Singamaneni, C. H Ho, Y. H. Lin, M. E McConney and V. V Tsukruk, “A Thermal Sensor and Switch Based on a Plasma Polymer/ZnO Suspended Nanobelt Bimorph Structure,” Nanotechnology, Vol. 20, No. 6, 2009, pp. 065502-065506. doi:10.1088/0957-4484/20/6/065502
- C. Sui, J. Xia, H. Wang, T. Xu, B. Yan and Y. Liu, “Optical Temperature Sensor Based on ZnO Thin Film’s Temperature-Dependent Optical Properties,” Review of Scientific Instruments, Vol. 82, No. 8, 2011, pp. 084901- 084903. doi:10.1063/1.3616361
- B. C. Yadav, S. Singh and A. Yadav, “Nanonails Structured Ferric Oxide Thick Film as Room Temperature Liquefied Petroleum Gas (LPG) Sensor,” Applied Surface Science, Vol. 257, No. 6, 2011, pp. 1960-1966. doi:10.1016/j.apsusc.2010.09.035