Advances in Molecular Imaging
Vol. 2 No. 2 (2012) , Article ID: 18703 , 9 pages DOI:10.4236/ami.2012.22003
DTI and Structural MRI Classification in Alzheimer’s Disease
1LIP6, Université Pierre et Marie Curie, Paris, France
2Université Pierre et Marie Curie, Paris, France
3Institute of Neurofunctional Imagery, Gif-sur-Yvette, France
4Department of Neurology, Pitié-Salpêtrière Hospital, Paris, France
5Research and Resource Memory Centre, Pitié-Salpêtrière Hospital, Paris, France
6e(ye)BRAIN, Ivry-sur-Seine, France
Email: lmesrob@yahoo.fr
Received February 21, 2012; revised March 19, 2012; accepted April 18, 2012
Keywords: MRI; DTI; Multimodal; Classification; Alzheimer’s Disease
ABSTRACT
In this paper, we propose a fully automated method to individually classify patients with Alzheimer’s disease (AD) and elderly control subjects based on diffusion tensor (DTI) and anatomical magnetic resonance imaging (MRI). We propose a new multimodal measure that combines anatomical and diffusivity measures at the voxel level. Our approach relies on whole-brain parcellation into 73 anatomical regions and the extraction of multimodal characteristics in these regions. Discriminative features are identified using different feature selection (FS) methods and used in a Support Vector Machine (SVM) for individual classification. Fifteen AD patients and 16 elderly controls were discriminated using mean diffusivity alone, combination of mean diffusivity and fractional anisotropy, and multimodal measures in the 73 ROIs and the overall accuracy obtained was 65.2%, 68.6% and 72% respectively. Overall accuracy reached 99% in multimodal measures when relevant regions were selected.
1. Introduction
Due to aging of the population, Alzheimer’s disease (AD) is increasingly becoming a crucial public health issue [1]. Early detection and diagnosis of AD is an important task, especially for identifying candidate patients for emerging therapies against amyloidosis [2]. AD is characterized by progressive gray matter (GM) loss which occurs presymptomatically in some neuroanatomical structures [3]. Thus, magnetic resonance imaging (MRI) measurements, primarily in the GM, could be sensitive markers of the disease and assist early diagnosis.
MRI studies in AD have demonstrated that volumetry of medial temporal lobe (MTL) anatomical structures, such as the hippocampus, the amygdala and the entorhinal cortex can be useful in the diagnosis of AD [4-7]. Recent studies on structural MRI have demonstrated that AD is also characterised by cortical thinning [8]. On the other hand, diffusion tensor imaging (DTI) allows in vivo investigation of the molecular motion of tissue water at a microscopic level in cerebral gray matter and white matter (WM).
The priniciple of DTI is to translate the diffusion into a MR signal loss. To construct the diffusion tensor, the diffusion properties of a subject are determined along at least six non colinear directions. Diagonalization of the diffusion tensor yields a basis for the set of diffusion probability ellipsoids. Different measures are derived from the diffusion ellipsoid as the mean diffusivity (MD) and the fractional anisotropy (FA). MD describes the local magnitude of diffusion regardless of direction. On the contrary, FA is used to characterize the degree of anisotropy of the diffusion ellipsoid. Indeed, in areas of dense white matter, diffusion is highly anisotropic.
As neurodegeneration is accompanied by a progressive loss of barriers that restrict water molecule motion, MD increases pathologically, whereas FA decreases. Accordingly, DTI studies in AD patients have shown abnormally increased MD and reduced FA in GM and WM including regions as the cingulate gyrus, the genu and the splenium of corpus callosum, hippocampus, amygdala and thalamus [9-15]. Thus, microarchitectural damage seems to be a sensitive marker of AD pathology. Moreover, it could be complementary to volumetric alterations [9]. Thus, there has been, recently, a growing interest for multimodal studies that combine information from anatomical MRI and DTI [8,10-12].
DTI measures (MD and FA) have been associated to different characteristics extracted from structural MRI as shape [16] and volume [9,12,17-19] of anatomical structures or cortical thickness [8,10,20,21]. Most of these studies focused on comparison of groups and few of them evaluated the combination of multimodal measures for discrimination between individual subjects. In [8] the authors reached perfect classification using different MRI modalities (metabolism PET, morphometry and DTI) in nine ROIs. Muller et al. [12] showed that DTI in the hippocampus was more sensitive than the hippocampal volume to discriminate MCI from healthy subjects. Kantarci et al. [17] and Zhang et al. [18] were interested in combination of hippocampal volume and MD or FA in some regions of interest (ROI) chosen a priori as the posterior cingulate gyrus. These studies, based on manually labeled ROI, present several limitations as the interrater variations and requirement of a priori definition of interested regions. Moreover, in AD, even though atrophy starts in the MTL, it is not confined to these regions and patients present with a distributed spatial pattern of atrophy.
In this paper, we propose a new method to automatically discriminate between patients with AD and elderly control subjects using both diffusivity and structural measures at the voxel level. Our approach is based on a parcellation of the MRI into 73 different regions in which different GM characteristics are estimated: distribution of GM concentration from the structural MRI [22], MD and FA measures from the DTI and multimodal measures combining the information from the two types of MRI at the voxel level. We also estimate the ratio between MD and FA measures at the voxel level in order to compare it to the multimodal parameter. We then perform the classification based on Support Vector Machine (SVM) [23] using all these parameters extracted from the 73 ROI space. We introduce a feature selection (FS) approach which aim is to identify regions contributing to the pattern of atrophy of AD. We perform and compare two different FS methods: a univariate and a multivariate approach. Moreover, we introduce a bootstrap [24] procedure in order to obtain more robust estimates of the classification results.
2. Materials and Methods
Our approach is composed of the following steps. Individual MR images are first parcellated into anatomical regions of interest (ROI) using registration with a labelled template (Section 2.4). DTI measures and concentration of GM are then extracted from each of these ROIs (Section 2.5). In addition to these standard MRI measures, we also propose a new multimodal measure that combines information from both structural and DTI MRI. The most discriminative regions are then identified using a univariate and a multivariate FS method (Section 2.6). Individual subjects are finally classified using a non-linear SVM (Section 2.7). Robust estimates of classification results are obtained using a bootstrap approach.
2.1. Subjects
The study was conducted in the Research and Resource Memory Center of the Pitié-Salpêtrière hospital (Pitié- Salpétriêre Hospital, Paris, France). The local ethics committee approved the study and written informed consent was obtained from all participants.
Two groups of subjects were included in this study: AD patients and healthy controls. All participants were evaluated by neurologists experienced in the care of patients with neurodegenerative diseases. AD patients fulfilled the National Institute of Neurological and Communication Disorders and Stroke/AD and Related Disorders Association (NINCDS-ADRDA) criteria for probable AD [25]. We only included patients living in the community and who had a score on the Clinical Dementia Rating Scale (CDR) ≥ 1 [26].
Healthy controls were visitors of unrelated patients in our unit, matched with AD patients for age and education level. They had no history of neurological or psychiatric disorders, no memory or cognitive disorders, and none took psychotropic drugs. They were also evaluated by the Mini Mental State Examination (MMSE) [27] and the Frontal Assessment Battery (FAB) [28]. Individuals who scored less than 28 out of 30 points for the MMSE or less than 16 out of 18 for the FAB were not included in this study. All healthy controls scored 0 at the CDR.
We did not include in this study (either in AD group or in the normal controls) subjects who presented: 1) clinical or neuroimaging evidence of focal lesions, including brain tumor, subdural hematoma, and CNS infection; 2) severe cortical or subcortical vascular lesions or stroke history; or 3) severe depression, as assessed by the Montgomery and Asberg depression rating scale [29] (patients or healthy controls that scored more than 16 out of 60 points were not included).
All participants were screened using a standardized neuropsychological battery that assessed a broad range of cognitive abilities commonly affected in AD. The total duration of the cognitive examination was approximately 2 hours and included various tests : the MMSE [27] and the Mattis Dementia Rating Scale (Mattis) [30] for global cognitive efficiency; the Free and Cued Selective Reminding test (FCSR) [31] for verbal episodic memory and face recognition memory task of Wechsler Memory Scale (WSM) [32] for visual episodic memory; spatial span and digit span task of WMS [32] for working memory; evaluation of instrumental functions included examination of limb praxis; visuospatial and visuoconstructive functions; language and visuoperceptual skills with recognition and naming pictures of objects and famous faces; visual knowledge about shape of objects with object’s decision task (test 10) of the BORB [33]; executive functions were assessed by the FAB [28] and the Frontal Score [34] including verbal fluency tests in one minute: animals names for category fluency and letter M for phonemic fluency [35].
2.2. MRI Acquisitions
In each subject, a T1-weighted volume MRI scan was acquired using the spoiled gradient echo sequence (SPGR) (TR/TE/flip angle: 23 ms/5 ms/35˚, 256 × 256 matrix; voxel size = 0.859 × 0.859 × 1.5 mm3) on a 1.5T scanner (General Electric, Milwaukee, WI, USA).
DTI scan was acquired using the echo-planar sequence (EPI) with 23 directions and b = 700 s/mm2 (TR/TE/flip angle: 6500 ms/85 ms/90°, 256 × 256 matrix; voxel size = 1.25 × 1.25 × 5 mm3). A reference scan with b = 0 (no diffusion gradient) was also acquired in each subject. DTI scan was limited to 20 slices due to technical limitations of the MRI scanner and so far the brain was partially imaged. However, we assured that the entire temporal lobe was scanned in all subjects.
2.3. MRI Preprocessing
For the DTI images, the eddy current correction was performed using BrainVISA (Institut Fédératif de Recherche IFR-49, Orsay, France, http://www.brainvisa.info/). Diffusion tensors were calculated and ADC and FA maps extracted (Figure 1). Then, we co-registered the b0 (no diffusion gradient) image with the structural SPGR image using the registration method of SPM2 (Statistical Parametric Mapping, University College London, UK). The transformation matrix was then applied to the ADC and FA images. The resulting images were superimposed over the original T1-weighted image for each subject and the registration was visually assessed by two trained radiologists.
Structural images were segmented in GM, WM and cerebrospinal fluid (CSF) using the segmentation module of SPM2 (Figure 2). DTI images were segmented following the method of Liu et al. [36]. Briefly, the ADC maps were segmented in CSF/non-CSF maps and the FA images in WM/non-WM maps. DTI GM maps were obtained by the intersection of non-CSF and non-WM maps. The final GM map resulted from the intersection of the DTI GM map and the structural GM map.
2.4. Brain Parcellation into 73 Regions Using AAL
The parcellation that we propose relies on the AAL introduced by Tzourio-Mazoyer et al. [37]. DTI images
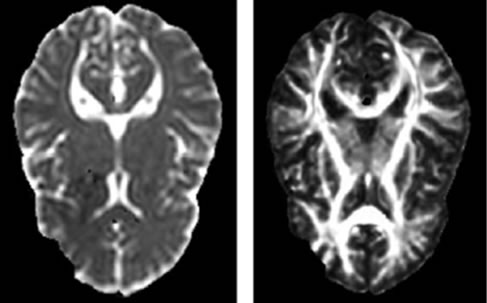
Figure 1. ADC (left) and FA (right) images.
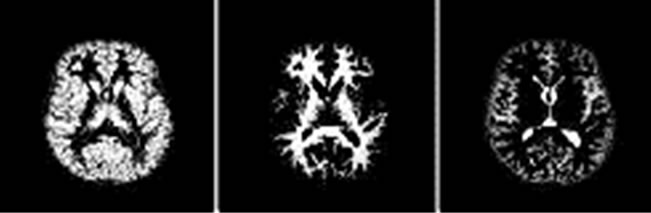
Figure 2. Structural MRI segmented in GM (left), WM (middle) and CSF (right) images.
were coregistered to anatomical MR images. Individual scans were segmented and normalised in the Montreal Neurological Institute (MNI) standard space using the segmentation and the spatial normalization modules of SPM2.
The technical limits of the DTI acquisition resulted in brains which were only partially acquired by the MRI. Therefore, for our analysis, we calculated a minimal brain volume common to all the subjects (Figure 3). The individual scans were first normalised in the MNI standard space using the EPI template and default parameters in SPM2. Binary masks were associated to the normalised images and their intersection was calculated. Then, the binary mask of common volume was mapped to the AAL and we retained ROIs which volume was preserved in the mask (i.e. in each subject) at least at 70% compared to the volume of the AAL ROI.
We excluded the precentral, postcentral and paracentral lobule regions, the frontal superior, middle and superior medial regions, the superior motor area, the parietal superior and the occipital inferior left regions (Table 1). As we did not have interest in cerebellum, the final atlas contained 73 ROIs from 90 ROIs in AAL.
2.5. Parameter Extraction
In each of the 73 ROIs, we calculated first the mean diffusivity (mean ADC). Then, the multimodal characteristics were calculated as the ratio between ADC and GM concentration in each voxel. Indeed, while GM concentration decreases in AD patients, ADC increases. Thus, the multimodal parameter increases in regions with brain atrophy and/or diffusion abnormality.
Another parameter which increases in the same way is the ratio between ADC and FA as the FA measurement decreases in AD patients. We assessed whether this DTI
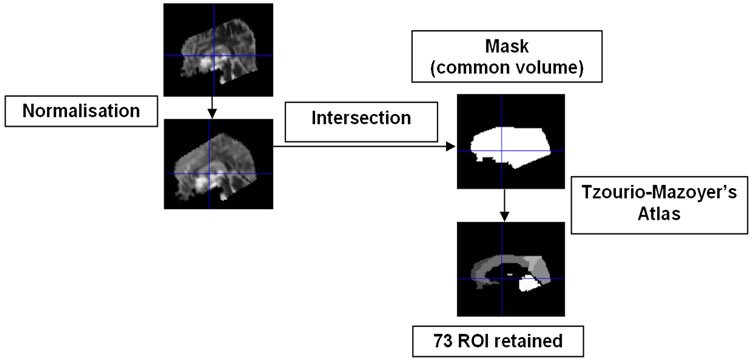
Figure 3. Workflow for the creation of common volume mask and brain parcellation in 73 ROIs.
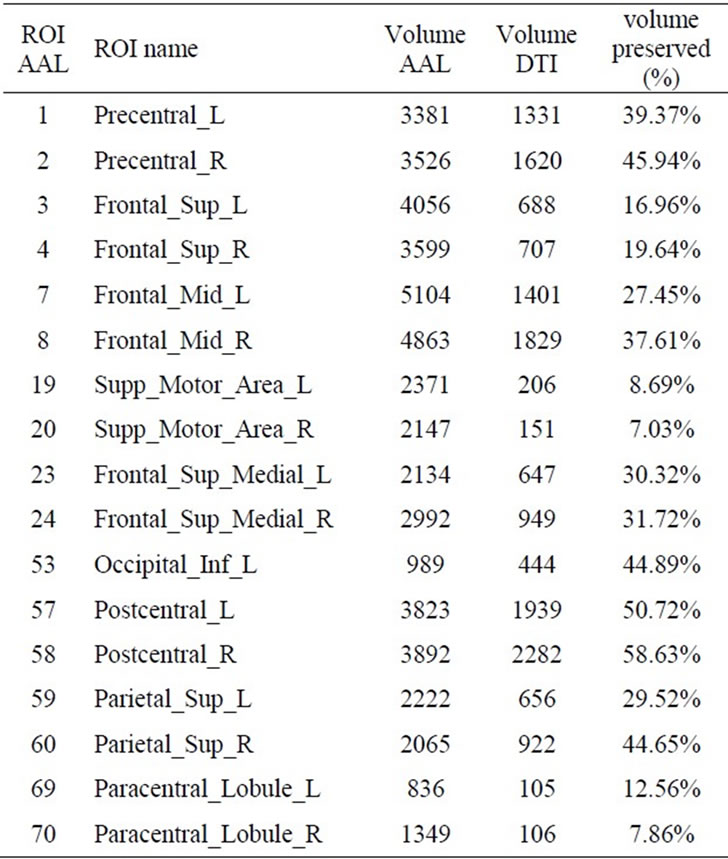
Table 1. Volume (in voxels) of the 17 ROIs AAL excluded from the study: full volume measured in the AAL atlas (column “Volume AAL”) and the acquired volume in the DTI scans measured in the mask of common volume (column “Volume DTI”). The last column shows the ratio (in %) of the DTI and AAL volumes for each of the excluded ROIs.
parameter classifies similarly to the multimodal parameter.
The mean of the multimodal measure and the mean of the DTI measure were then calculated for each of the 73 ROIs. The feature vector for each subject was thus constituted by the mean ADC, the mean DTI parameter (ratio of ADC and FA), the mean of the multimodal parameter (combination of ADC and GM concentration) for each of the 73 regions.
In the end, we compared the discriminative accuracy of the DTI and the multimodal measures with GM measures extracted from the anatomical MRI. We performed a histogram analysis of the distribution of the GM, WM and CSF in the 73 ROIs of the brain atlas [22].
2.6. Feature Selection
The aim of this step is to identify the most relevant features (or parameters) for the classification. We performed a univariate FS approach. The discriminating power of the feature parameter in each ROI was assessed by using a two-sample t-test. The probability distribution was generated by using a bootstrap method [24] (bootstrap is a generalization of the leave one out (LOO) method), working with the null hypothesis H0 that there is no difference between the two groups of subjects. To obtain a good estimation of the p value of the t-test, we performed the method with a large number of resamplings (5000). According to the p value, we determined the significance of the t-test for each ROI. Thus, the most significantly different ROIs (p < 10–2) were selected as being the most relevant for the discrimination.
We also performed a multivariate FS approach based on the SVM-Recursive Feature Elimination (SVM-RFE) [38] algorithm. The algorithm estimates at each step the features’ weights (using linear SVM) and rejects the features with the least weights keeping in the end the most relevant features. In order to determine the optimal number of features to select, we applied recursively the SVMRFE eliminating at each iteration only one feature and calculating the classification accuracy of the selected ones. To obtain a more robust FS, we embedded a randomization with 500 resamplings in this procedure. To this purpose, we drew without replacement approximately 75% of each group of subjects to obtain a training set. The remaining 25% of subjects were used as a test set. The procedure was repeated 500 times. We thus obtained the correct classification rate for the 500 drawings. Thus, for each level corresponding to the number of selected features, the eliminated feature was the most frequently chosen one within the different resamplings and the cross-validation (CV) error was estimated as the mean of the 500 samples’ CV errors. The level with the least CV error gave the optimal number of features and the set of the selected features.
In our application, the selected features correspond to MRI measurements in anatomical structures. The parameters extraction being based on the GM concentration and/or mean diffusivity in the ROI, we hypothesize that the FS step will identify brain structures altered by the neurodegenerative pathology.
2.7. Classification Method
Subjects’ classification was performed using nonlinear SVM [23] with radial basis function (RBF) kernel. To obtain robust estimates of the classification accuracy, a randomization with 5000 resamplings was added in the learning and cross-validation steps. The large number of samples insures that every subject’s data have participated in the cross-validation step. Here again, we drew without replacement approximately 75% of each group of subjects to obtain a training set and the remaining 25% were used as a test set. Accuracy was evaluated for every subset of data and global accuracy was evaluated as the mean of the 5000 resamplings.
The optimal values of the two SVM parameters—γ (width of the RBF) and C (error/trade-off parameter), were determined using a grid search. Using the bootstrap procedure for training and test selection, we performed classifications for the MRI dataset with (γ,C) varying along a grid, with a search range of [2–5, 210] for C and [2–10, 25] for γ. The value of (γ,C) that gave the best classification accuracy was then used to build the classifier.
3. Results
3.1. Participants
Fifteen AD patients (10 women, five men) and sixteen elderly controls (ten women, six men) were recruited. Clinical, cognitive and demographic characteristics of the participants are displayed in Table 2.
AD patients were compared to controls for sex, age, education level and neuropsychological scores using the two-sample t-test. There was no significant difference between groups for sex, age or education level. Neuropsychological assessment of AD patients showed cognitive decline in global efficiency, verbal episodic memory, verbal fluency and executive functions. Patients underperformed most significantly (p < 0.005) on the total free recall of the Free and Cued Selective Reminding test (FCSR), the Mattis test and the verbal category fluency test (Table 2).
3.2. Feature Selection with Multimodal Characteristics
The univariate FS method identified 15 ROIs with p value less than 10–2. The most significant ROIs included regions that have been previously reported to be affected in AD, such as the middle and posterior cingulate gyri, the precuneus, the thalamus, calcarine, frontal orbital areas and inferior temporal gyrus.
The SVM-RFE algorithm identified 15 regions from the 73 ROI as being the most relevant for the discrimination. Selected regions included (but not only) the hippocampus, the amygdala, the cuneus, the calcarine, the anterior cingulate gyrus, the thalamus, the inferior parietal and occipital regions and the polar temporal regions (Table 3). Interestingly, the set of selected regions with the multivariate approach included some regions that were estimated as non significantly different using the twosample t-test.
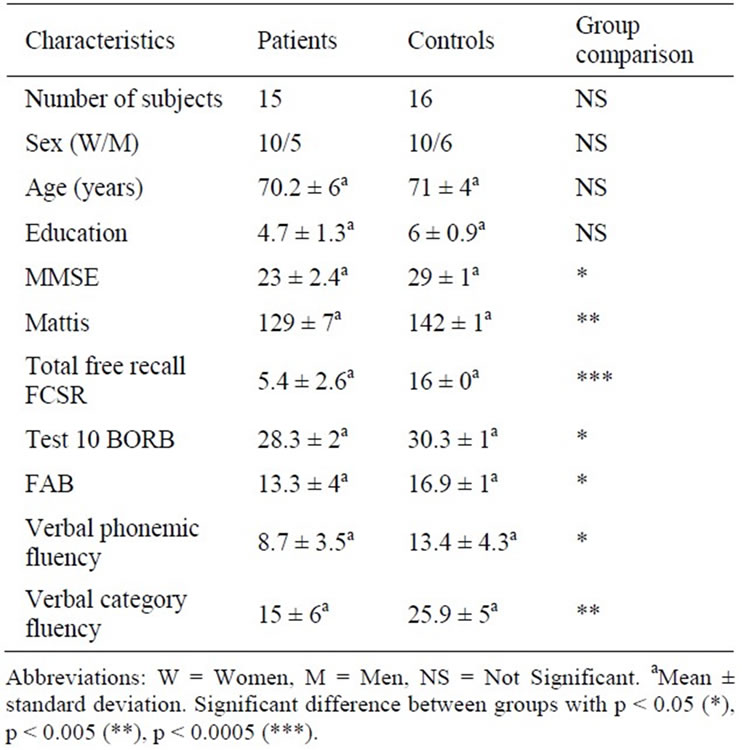
Table 2. Clinical characteristics of controls and patients with Alzheimer’s disease.
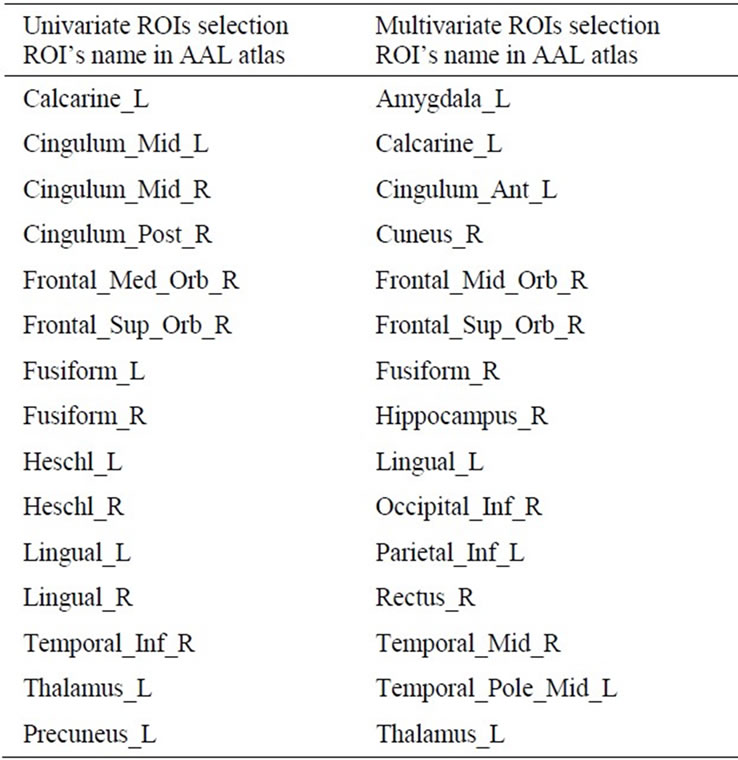
Table 3. Univariate and multivariate AAL’s ROIs selection. In bold the ROIs selected by both algorithms.
3.3. Classification
The results from the following classification experiments are summarized in Table 4:
• To assess the added value of our multimodal parameters, we compared the results obtained with these features to those obtained with the mean ADC and to those obtained with the combined ADC and FA measurements in each region.
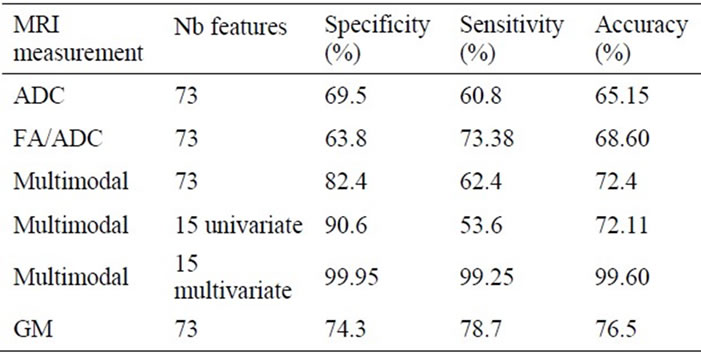
Table 4. Classification results obtained with different MRI measurements and different number of features.
• We compared the results obtained using all 73 regions to those obtained using only the regions selected by the univariate or the multivariate FS methods.
• We compared the results obtained using the different DTI measures to those obtained using the GM parameter.
Subjects were first discriminated using the mean diffusivity measures in the 73 ROIs. The specificity, the sensitivity and the overall accuracy were respectively 69.5%, 60.8% and 65.15%.
The combined DTI measures (ratio FA/ADC) discriminated better the subjects: 68.6% accuracy. However, the multimodal characteristics discriminated even better the subjects with 82% specificity and accuracy above 72%. Further classification using only the most relevant regions identified by the univariate FS approach did not improve the discrimination. On the contrary, the classification with regions selected with the multivariate FS method reached 99% accuracy.
The classification accuracy obtained with the GM parameters in the 73 ROIs was 76.5%, higher than any of the accuracies obtained with the DTI parameters and slightly better than that obtained with the multimodal parameter in the 73 ROIs. However, the classification with the multivariate parameter in the selected regions with the multivariate FS approach outperformed all the parameters.
4. Discussion
In this paper, we described the first multimodal study in brain GM using diffusivity and structural measures at the voxel level. We proposed a method to discriminate between patients with AD and elderly controls based on SVM classification, 73 ROI anatomical parcellation and different FS approaches.
Few studies [12,17,18] have demonstrated that the classification between AD or MCI patients and normal subjects could be improved by adding diffusion measures (ADC or FA) to the hippocampal volume. Zhang et al. [18] achieved 78% and 63% overall classification of AD and MCI patients using the hippocampal volume alone, and 91% and 74% respectively adding the measure of FA in the posterior cingulated gyrus. Muller et al. [12] showed that combining left hippocampal MD and left hippocampus volume in a logistic regression model reached 86% classification accurary. A more recent multimodal study [10] combined DTI measures (ADC and FA in white matter) and cortical thickness in different ROIs. The best classifiaction (AUC = 0.98) was obtained when cortical thickness and FA data from the left temporal region were combined. These results showed that combining structural and diffusion tensor measures improves the discrimination of patients and control subjects. However, these studies evaluated the discrimination power of only one parameter in each modality in a priori chosen ROIs.
Our method differentiated from these studies in several points: 1) the diffusivity and structural measures were extracted in the whole brain and not in a priori chosen ROIs; 2) we proposed a multimodal measure that combines GM concentration and ADC measures in each voxel; 3) we applied SVM and bootstrap procedure in order to obtain more robust estimates of the classification results and 4) we selected relevant regions for the discrimination between subjects using two different approaches.
The result of the classification obtained with GM is pretty low while compared to our previous study [22]. Actually in the study of Magnin et al. we have shown that using the 90 ROIs of the AAL atlas to classify healthy subjects from AD patients with a mean MMSE of 23.1%, the mean specificity was 96.6%, the mean sensitivity was 91.5% with an overall mean accuracy of 94.5%. The difference of the results with our current study, where we obtained a mean specificity of 74.3%, a mean sensitivity of 78.7% for an overall accuracy of 76.5%, cannot be explained by the method which is similar. The difference could be explained by the number of subjects: 16 patients with AD and 22 healthy aged control subjects in Magnin et al. for 15 patients with AD and 16 controls in the present study. If the number of participants seems close in the two studies the statistics power can vary with such a low number of subjects.
The most plausible explanation for difference in the results between the two studies is certainly to be found in the 17 ROIs which could not be included in the process. All the ROIs could not be used for the classification due to a problem of acquisition of the DTI images. Among these 17 missing ROIs, 11 of them (65%) were highlighted to be significantly different in GM concentration between healthy elderly subjects and AD patients with a similar cognitive level (MMSE = 23.5) in a previous VBM study [39]. These ROIs are the left and right superior frontal gyrus, the left and right middle frontal gyrus, the left and right supplementary motor areas, the left and right medial superior frontal gyrus, the left postcentral gyrus and the superior parietal gyrus. These ROIs which show a great difference of grey concentration between elderly healthy subjects and AD patients certainly influence the classification. Their absence from our classification certainly lowers the power of the process.
The results showed that combining FA and ADC measures didn’t improve significantly the classification accuracy (68.6% instead of 65.15% for ADC uniquely). This can be explained by the low anisotropy in grey matter regions. Indeed, FA is mainly measured in WM fibers where the motion of water molecules is constrained along the fibers and so far anisotropic.
More importantly, the multimodal measure classified the subjects better than the DTI measures separately or combined together. However, the best classification accuracy was obtained with the GM parameter separately, showing that adding the ADC measures to the GM measures decreases the discrimination between patients and controls instead of increasing it. So far, the multimodal measure is less sensitive than the GM parameter alone and the acquisition of DTI images is no needed for the discrimination of patients and controls when they are analysed in the GM areas only.
Our finding that GM measures classify better than DTI measures is consistent with a recent study [8] which combined brain metabolism (FDG-PET), morphometry (gray matter thickness), and DTI (FA in white matter). Here, only structural MRI measures helped explaining the differences between MCI patients and controls when all modalities were entered simultaneously in logistic regression models for most of the nine ROIs. However, when all modalities and all ROIs were used perfect classification accuracy (100%) was achieved. In another study [11], DTI (MD) and morphometry (deformationbased maps) biomarkers were equally accurate in distinguishing between AD patients and controls. The combination of modalities in Logistic Regression model resulted in a classification accuracy of AUC = 0.86 after leave-one-out cross-validation. However, the DTI biomarkers were obtained only in the white matter, so these results can’t be compared directly with our study where MD is measured uniquely in the grey matter.
The main interesting point in this study is the validation results obtained in the case of the multivariate selection of features. Actually, the classification accuracy above 99% implies that 1) multimodal analysis gives better results than unimodal analysis and 2) an selected set of ROIs improves the results of the classification. But this result should be used carefully: since the study was done on a limited set of data this results could be due to a local maxima with an overlearning effect. Therefore, it has to be confirmed with a study implying more data. If confirmed, these results indicate that choosing relevant ROIs may lead to achieve very high classification accuracy even with a less sensitive marker like the DTI images of the grey areas of the brain.
We introduced two FS approaches: a univariate approach based on the two-sample t-test and a multivariate approach based on the SVM-RFE algorithm. Though the selection was data driven and not based on prior knowledge, both methods selected regions previously reported to be early altered in the degenerative disease such as the hippocampus, amygdale, cuneus, cingulate gyrus, inferior parietal regions, inferior occipital regions and the temporal lobes. The FS provided increased classification accuracy with the multivariate approach (99% instead of 72.4%). Most of the regions selected with the SVM-RFE algorithm were significantly different (p < 10–2) between AD patients and controls but some were not. Thus, identifying a discriminating subset of features seems to be more robust and relevant for the classification than combining the most discriminating features identified with the univariate FS approach. It should be noted that the added value of the FS step might be accentuated by the fact that the subjects groups were relatively small. Future validations on larger groups are required to confirm the results of the present study.
One should take in consideration several limitations of this study: Firstly, not the entire brain has been scanned and so far seventeen cortical ROIs have been excluded from the study. The second limitation is the small sample size of the included subjects. Further validation is needed on more important groups of subjects. Finally, it will be interesting to include other biomarkers in the multimodal study such as measures from PET and CSF proteins [40].
5. Conclusions
In conclusion, we have introduced a method to automatically discriminate between patients with AD and elderly controls. We have proposed a new multimodal MRI measure combining brain GM concentration and mean diffusivity at the voxel level. The discrimination between AD patients and elderly controls reached 99% accuracy when relevant regions were selected. This result implies that 1) multimodal analysis gives better results than unimodal analysis and 2) a selected set of ROIs improves the results of the classification. Thus, combining measures from different MRI modalities improves classification accuracy and could be a useful tool to assist in the early diagnosis of AD.
REFERENCES
- C. P. Ferri, M. Prince, C. Brayne, et al., “Global Prevalence of Dementia: A Delphi Consensus Study,” Lancet, Vol. 366, No. 9503, 2005, pp. 2112-2117. doi:10.1016/S0140-6736(05)67889-0
- B. Dubois, H. H. Feldman, C. Jacova, et al., “Research Criteria for the Diagnosis of Alzheimer’s Disease: Revising the NINCDS-ADRDA Criteria,” The Lancet Neurology, Vol. 6, No. 8, 2007, pp. 734-746. doi:10.1016/S1474-4422(07)70178-3
- N. C. Fox, E. K. Warrington, P. A. Freeborough, et al., “Presymptomatic Hippocampal Atrophy in Alzheimer’s Disease. A Longitudinal MRI Study,” Brain, Vol. 119, No. 6, 1996, pp. 2001-2007. doi:10.1093/brain/119.6.2001
- C. R. J. Jack, R. C. Petersen, Y. C. Xu, et al., “Prediction of AD with MRI-Based Hippocampal Volume in Mild Cognitive Impairment,” Neurology, Vol. 52, No. 7, 1999, pp. 1397-1403.
- B. C. Dickerson, I. Goncharova, M. P. Sullivan, et al., “MRI-Derived Entorhinal and Hippocampal Atrophy in Incipient and Very Mild Alzheimer’s Disease,” Neurobiology of Aging, Vol. 22, No. 5, 2001, pp. 747-754 doi:10.1016/S0197-4580(01)00271-8
- P. J. Visser, F. R. Verhey, P. A. Hofman, et al., “Medial Temporal Lobe Atrophy Predicts Alzheimer’s Disease in Patients with Minor Cognitive Impairment,” Journal of Neurology Neurosurgery & Psychiatry, Vol. 72, No. 4, 2002, pp. 491-497
- A. T. Du, N. Schuff, J. H. Kramer, et al., “Higher Atrophy Rate of Entorhinal Cortex than Hippocampus in AD,” Neurology, Vol. 62, No. 3, 2004, pp. 422-427
- K. B. Walhovd, A. M. Fjell, L. Amlien, et al., “Multimodal Imaging in Mild Cognitive Impairment: Metabolism, Morphometry and Diffusion of the Temporal-Parietal Memory Network,” NeuroImage, Vol. 45, No. 1, 2009, pp. 215- 233. doi:10.1016/j.neuroimage.2008.10.053
- A. Cherubini, P. Peran, I. Spoletini, et al., “Combined Volumetry and DTI in Subcortical Structures of Mild Cognitive Impairment and Alzheimer’s Disease Patients,” Journal of Alzheimer’s Disease, Vol. 19, No. 4, 2010, pp. 1273-1282.
- L. Wang, F. C. Goldstein, E. Veledar, et al., “Alterations in Cortical Thickness and White Matter Integrity in Mild Cognitive Impairment Measured by Whole-Brain Cortical Thickness Mapping and Diffusion TensorImaging,” American Journal of Neuroradiology, Vol. 30, No. 5, 2009, pp. 893-899. doi:10.3174/ajnr.A1484
- U. Friese, T. Meindl, S. Herpertz, et al., “Diagnostic Utility of Novel MRI-Based Biomarkers for Alzheimer’s Disease: Diffusion Tensor Imaging and Deformation-Based Morphometry,” Journal of Alzheimer’s Disease, Vol. 20, No. 2, 2010, pp. 477-490.
- M. J. Muller, D. Greverus, C. Weibrich, et al., “Diagnostic Utility of Hippocampal Size and Mean Diffusivity in Amnestic MCI,” Neurobiology of Aging, Vol. 28, No. 3, 2007, pp. 398-403. doi:10.1016/j.neurobiolaging.2006.01.009
- S. E. Rose, A. L. Janke and J. B. Chalk, “Gray and White Matter Changes in Alzheimer’s Disease: A Diffusion Tensor Imaging Study,” Journal of Magnetic Resonance Imaging, Vol. 27, No. 1, 2008, pp. 20-26 doi:10.1002/jmri.21231
- S. Xie, J. X. Xiao, G. L. Gong, et al., “Voxel-Based Detection of White Matter Abnormalities in Mild Alzheimer Disease,” Neurology, Vol. 66, No. 12, 2006, pp. 1845- 1849. doi:10.1212/01.wnl.0000219625.77625.aa
- H. Cho, D. W. Yang, Y. M. Shon, et al., “Abnormal Integrity of Corticocortical Tracts in Mild Cognitive Impairment: A Diffusion Tensor Imaging Study,” Journal of Korean Medical Science, Vol. 23, No. 3, 2008, pp. 477- 483. doi:10.3346/jkms.2008.23.3.477
- M. Zarei, B. Patenaude, J. Damoiseaux, et al., “Combining Shape and Connectivity Analysis An MRI Study of Thalamic Degeneration in Alzheimer’s Disease,” NeuroImage, Vol. 49, No. 1, 2010, pp. 1-8. doi:10.1016/j.neuroimage.2009.09.001
- K. Kantarci, Y. Xu, M. M. Shiung, et al., “Comparative Diagnostic Utility of Different MR Modalities in Mild Cognitive Impairment and Alzheimer’s Disease,” Dementia and Geriatric Cognitive Disorders, Vol. 14, No. 4, 2002, pp. 198-207. doi:10.1159/000066021
- Y. Zhang, N. Schuff, G. H. Jahng, et al., “Diffusion Tensor Imaging of Cingulum Fibers in Mild Cognitive Impairment and Alzheimer’s Disease,” Neurology, Vol. 68, No. 1, 2007, pp. 13-19. doi:10.1212/01.wnl.0000250326.77323.01
- Y. Nakata, N. Sato, K. Nemoto, et al., “Diffusion Abnormality in the Posterior Cingulum and Hippocampal Volume: Correlation with Disease Progression in Alzheimer’s Disease,” Magnetic Resonance Imaging, Vol. 27, No. 3, 2009, pp. 347-354 doi:10.1016/j.mri.2008.07.013
- B. B. Avants, P. A. Cook, L. Ungar, et al., “Dementia Induced Correlated Reductions in White Matter Integrity and Cortical Thickness: A Multivariate Neuroimaging Study with Sparse Canonical Correlation Analysis,” NeuroImage, Vol. 50, No. 3, 2010, pp. 1004-1016. doi:10.1016/j.neuroimage.2010.01.041
- L. Wang, F. C. Goldstein, E. Veledar, et al., “Alterations in Cortical Thickness and White Matter Integrity in Mild Cognitive Impairment Measured by Whole-Brain Cortical Thickness Mapping and Diffusion Tensor Imaging,” American Journal of Neuroradiology, Vol. 30, No. 5, 2009, pp. 893-899. doi:10.3174/ajnr.A1484
- B. Magnin, L. Mesrob, S. Kinkingnéhun, et al., “Support Vector Machine-Based Classification of Alzheimer’s Disease from Whole-Brain Anatomical MRI,” Neuroradiology, Vol. 51, No. 2, 2009, pp. 73-83. doi:10.1007/s00234-008-0463-x
- C. Cortes and V. Vapnik, “Support-Vector Networks,” Machine Learning, Vol. 20, No. 3, 1995, pp. 273-297.
- B. Efron and R. Tibshirani, “An Introduction to the Bootstrap,” CRC Press, Boca Raton, 1993.
- G. McKhann, D. Drachman, M. Folstein, R. Katzman, D. Price and E. M. Stadlan, “Clinical Diagnosis of Alzheimer’s Disease: Report of the NINCDS-ADRDA Work Group under the Auspices of Department of Health and Human Services Task Force on Alzheimer’s Disease,” Neurology, Vol. 77, No. 7, 1884, pp. 939-944.
- J. C. Morris, “The Clinical Dementia Rating (CDR): Current Version and Scoring Rules,” Neurology, Vol. 43, No. 11, 1993, pp. 2412-2414.
- M. F. Folstein, S. E. Folstein and P. R. McHugh, “‘MiniMental State’: A Practical Method for Grading the Cognitive State of Patients for the Clinician,” Journal of Psychiatric Research, Vol. 12, No. 3, 1975, pp. 189-198.
- B. Dubois, A. Slachevsky, I. Litvan and B. Pillon, “The FAB: A Frontal Assessment Battery at Bedside,” Neurology, Vol. 55, No. 11, 2000, pp. 1621-1626.
- S. A. Montgomery and M. A. Asberg, “A New Depression Scale Designed to be Sensitive to Change,” British Journal of Psychiatry, Vol. 134, No. 4, 1979, pp. 382-389. doi:10.1192/bjp.134.4.382
- S. Mattis, “Dementia Rating Scale,” Psychological Assessment Resources, Odessa, 1988.
- E. Grober and H. Buschke, “Genuine Memory Deficits in Dementia,” Developmental Neuropsychology, Vol. 3, No. 1, 1987, pp. 13-36.
- D. Wechsler, “The Wechsler Intelligence Scale,” 3rd Edition, The Psychological Corporation, San Antonio, 1997.
- H. J. Riddoch and G. W. Humphreys, “Birmingham Object Recognition Battery,” Lawrence Erlbaum Associated Ltd., Mahwah, 1993.
- B. Pillon, N. Gouider-Khouja, B. Deweer, et al., “The Neuropsychological Pattern of Corticobasal Degeneration: Comparison with Progressive Supranuclear Palsy and Alzheimer’s Disease,” Journal of Neurology Neurosurgery & Psychiatry, Vol. 58, No. 2, 1995, pp. 174-179. doi:10.1136/jnnp.58.2.174
- F. Thuillard and G. Assal, “Données Neuropsychologiques Chez le Sujet Agé Normal,” In: M. Habib, Y. Joanette and M. Puel, Eds., Démences et Syndromes Démentiels. Approche Neuropsychologique, Masson, Paris, 1991, pp. 125-133.
- T. Liu, G. Young, L. Huang and S. T. Wong, “76-Space Analysis of Grey Matter Diffusivity: Methods and Applications,” NeuroImage, Vol. 31, No. 1, 2006, pp. 51-65. doi:10.1016/j.neuroimage.2005.11.041
- N. Tzourio-Mazoyer, B. Landeau, D. Papathanassiou, et al., “Automated Anatomical Labeling of Activations in SPM Using a Macroscopic Anatomical Parcellation of the MNI MRI Single-Subject Brain,” NeuroImage, Vol. 15, No. 1, 2002, pp. 273-289. doi:10.1006/nimg.2001.0978
- I. Guyon, J. Weston, S. Barnhill and V. Vapnik, “Gene Selection for Cancer Classification Using Support Vector Machines,” Machine Learning, Vol. 46, No. 1-3, 2002, pp. 389-422. doi:10.1023/A:1012487302797
- S. Kinkingnéhun, M. Sarazin, S Lehéricy, et al., “VBM Anticipates the Rate of Progression of Alzheimer Disease: A 3-Year Longitudinal Study,” Neurology, Vol. 70, No. 23, 2008, pp. 2201-2211. doi:10.1212/01.wnl.0000303960.01039.43
- D. Zhang, Y. Wang, L. Zhou, et al., “Multimodal Classification of Alzheimer’s Disease and Mild Cognitive Impairment,” NeuroImage, Vol. 55, No. 3, 2011, pp. 856-867. doi:10.1016/j.neuroimage.2011.01.008