Advances in Molecular Imaging
Vol.1 No.3(2011), Article ID:7867,7 pages DOI:10.4236/ami.2011.13006
Imaging of Insulitis in NOD Mice with IL-2-Gd-DTPA and 1.5 T MRI
1Department of Pediatrics, University of Turku and Turku University Hospital, Turku, Finland
2Medical Imaging Centre of Southwest Finland, Turku, Finland
3PET Centre, University of Turku and Turku University Hospital, Turku, Finland
4Department of Medicine, University of Turku and Turku University Hospital, Turku, Finland
5Department of Pediatrics, Central Hospital of Seinäjoki, Seinäjoki, Finland
E-mail: teemu.kalliokoski@utu.fi
Received July 28, 2011; revised September 2, 2011; accepted September 15, 2011
Keywords: IL-2, MRI, imaging, insulitis, NOD mice
Abstract
To explore the possibility to use 1.5 T MRI in imaging of accumulating gadolinium (Gd) into inflamed endocrine pancreas (insulitis), we compared intravenously delivered IL-2-Gd-DTPA and Gd-DTPA (Magnevist®) in phenotypically healthy 12 weeks old female non-obese diabetic (NOD) mice. At 1 to 48 h after the injection mice were sacrificed and the pancreas-to-background ratio was determined using MRI. In addition Gd concentration of the pancreas and plasma were measured. The pancreas-to-plasma ratio of Gd was 25-fold 24 h after the i.v. injection of IL-2-Gd-DTPA. At the same time the pancreas-to-background ratio measured with 1.5T MRI was 1.5-times higher in the NOD mice receiving IL-2-Gd-DTPA than Magnevist® (271 ± 37 vs. 183 ± 0,1, P = 0.04) indicating that sufficient differences may exist between IL-2-Gd-DTPA accumulating in the pancreas and in the surrounding tissues to support the use of MRI for imaging of pancreatic insulitis.
1. Introduction
Due to the restricted accessibility of the pancreas, direct analysis of events in the islets of Langerhans that precede development of autoimmune diabetes has been problematic. Methods of in vivo imaging of insulitis might increase understanding of the events that are necessary for the progression toward overt diabetes and help in defining potential molecular targets for prevention of autoimmunity and type 1 diabetes.
Non-obese diabetic (NOD) mouse spontaneously develops autoimmune insulin-dependent diabetes mellitus, which resembles human autoimmune type 1 diabetes [1]. Development of insulitis, characterized by accumulation of lymphocytes in and around the islets of Langerhans [2,3], is a prerequisite for autoimmune destruction of the beta cells and may in man precede clinical symptoms of insulin deficiency by months or years. Clinical diabetes in man is believed to develop when 80% - 90% of the insulin producing beta cells have been destroyed [4]. Insulitis in NOD mice begins at the age of 3 to 5 weeks, its extent then gradually increases until the age of 16 to 20 weeks [5], and by the age of 30 weeks, the cumulative incidence of diabetes reaches 60% - 90% in female NOD mice [6].
Interleukin 2 (IL-2) is produced by antigenor mitogen-activated T lymphocytes and plays a central role in the development of the immune response. IL-2 is thought to act on T cells through its receptor. IL-2 and its surface receptor (IL-2R) are essential components in the growth and proliferation of the effector cells of immunity [7]. Earlier reports have shown that up to 28% of islet-infiltrating CD4+ and CD8+ cells expresses IL-2R in the NOD mouse [8]. Recombinant IL-2 was labelled with Iodine-123 (123I) and then used to detect insulitis with scintigraphy [9,10]. These earlier studies demonstrated that 123I-labelled IL-2 administered i.v. accumulated specifically in the inflamed pancreas of NOD mice.
Magnetic resonance imaging (MRI) offers a technique that is capable of detecting small objects such as pancreatic islets [11]. T lymphocyte infiltration in the pancreas can be imaged by MRI after labelling of T cells with an imaging probe such as iron oxide nanoparticles [12] or Fluorine-19 (19F) [13]. Microvascular alterations that accompany insulitis in NOD mouse have been detected with iron oxide particles [14]. In this study, we have investigated the possibility to image insulitis in NOD mice using gadolinium diethylene triamine pentaacetic acid (Gd-DTPA) labelled IL-2 for MRI at 1.5 T.
2. Materials and Methods
Permission for the study was obtained from the ethics committees for experimental animals at Turku University.
2.1. IL-2-Gd-DTPA
IL-2 (Proleukin®, Chiron, Emeryville, CA, USA; 1 mg) was dissolved in 0.5 mL of aqua. Excess of buffers were removed by using NAP-10 Columns (Amersham, GE Healthcare, UK) followed by concentration to a volume of 0.5 mL using Centricon 10 centrifugal filter device (Amicon, Beverly, MA, USA). Isothiocyanate-activated diethylene triamine pentaacetic acid (ITC-DTPA) was dissolved in aqua and the concentration was measured spectrophotometrically. The ITC-DTPA (13.5-fold molar excess) was coupled to IL-2 (1.84 mg/mL) for 18 hours at +4˚C, pH 9.3. After the coupling, pH of the reaction mixture was reduced to 6.5 using HCl. 5-fold molar excess of Gadolinium3+ citrate was added compared to the amount of DTPA. After 2 hour incubation at +4˚C, the product was purified using Sephadex G-50 Column (GE Healthcare Bio-Sciences AB, Uppsala, Sweden). The resulting final product contained two Gd-DTPA molecules for each IL-2.
2.2. Data Analysis and Statistical Procedures
Statistical analysis was performed using SAS System for Windows release 8.0 (SAS, Cary, NC, USA). One-way analysis of variance (ANOVA) was used as a parametric method. P-values < 0.05 were regarded significant.
2.3. Animals
Total of 30 prediabetic female NOD mice were used in this study at the age of 12 weeks. Mice were purchased from M&B Laboratories (Ry, Denmark). Mice which were from different colonies to avoid interference between individuals were housed under standard conditions with free access to standard food and tap water. Before the experiment they fasted for 6 h but had free access to water.
2.4. Study Protocol
NOD mice were injected via the tail vein with 0.1 ml of IL-2-Gd-DTPA (136 µg/ml). Control NOD mice were injected with 0.2 mmol/kg (0.02 mmol/ml) of Magnevist® (Gd-DTPA, gadopentetate dimeglumine). Mice were sacrificed with CO2 at 1, 6, 12, 24 and 48 h after i.v. injection of contrast media. Imaging was performed at 1 h (n = 4), 6 h (n = 4), 12 h (n = 3), 24 h (n = 2) and 48 h (n = 3) after injection of IL-2-Gd-DTPA or at 1 h (n = 2), 6 h (n = 4), 12 h (n = 3), 24 h (n = 2) and 48 h (n = 3) after injection of Gd-DTPA. Blood sample was taken by cardiac puncture into heparinized tubes immediately after killing. Shortly after sacrifice mice were imaged with MRI. After the MRI, mice were dissected; pancreas was removed and chilled in liquid nitrogen for further analysis.
2.5. MRI
Images were obtained with Philips Gyroscan Intera 1.5 T Nova Dual MR scanner (Philips Medical Systems, Best, the Netherlands) using C3 circular coil. Two mice were imaged simultaneously by placing them inside the coil in the supine position, one below the other. The mice were laying over two bottles of physiological saline to assure visible signal. All mice were imaged using coronal and axial T1-weighted sequences (TR 19.5/TE 11.5) with matrix size 704 × 704. Slice thickness was 1.0 mm with no gap between the slices. Displayed field of view (DFOV) was 14.0 × 14.0 cm. Images and data were processed and analysed using Philips ViewForum workstation.
Abdominal organs such as liver, spleen and pancreas are highly visible with 1.5 T MRI. Region of interest (ROI) was manually drawn in the organ avoiding other tissues. The signal intensity (SI) of background was measured by placing ROI outside the mouse (dark background). SI was determined from ROIs placed on pancreas, liver and paraspinal muscle. Tissue-to-background ratio (ROI ratio) was calculated as SI of pancreas, liver or paraspinal muscle divided by SI of background.
2.6. Quantification of Gd in Plasma and Pancreas
Inductively Coupled Plasma Mass Spectrometry (ICPMS) is an analytical technique used for elemental determinations. It has superior detection capabilities, particularly for the rare-earth elements such as Gd. After the MRI pancreas and blood samples (n = 2 - 4 in each group) were used for measurement of Gd concentration in the tissue using ICP-MS as described [15].
3. Results
The purpose of these experiments was to explore the biokinetics and in vivo imaging potential of i.v. administered IL-2-Gd-DTPA in NOD mice in comparison to Gd-DTPA alone. A representative coronal MR image of a NOD mouse at 24 h after injection of IL-2-Gd-DTPA is given in Figure 1.
ROI ratios of pancreas, liver and paraspinal muscle as a function of time after injection of contrast media are shown in Figure 2. In general, ROI ratio of pancreas was app. 1.5-fold higher than those of liver or muscle. In pancreas of NOD mice, ROI ratio at 24 h after IL-2-GdDTPA injection was 1.5-fold higher as compared to GdDTPA (271 ± 37 vs. 183 ± 0.1, P = 0.04, n = 2 vs 2, respectively).
According to ICP-MS analysis, Gd concentration of plasma after IL-2-Gd-DTPA injection was low already at 1 h post injection and thereafter it nearly disappeared while showed biexponential curve in the pancreas. In pancreas, the Gd concentration showed modest increase at 1 h post injection. It then decreased shortly, but was high again at 12 h after injection (Figure 3). Gd concentration in control group peaked in plasma and pancreas at 1 h after i.v. injection of Gd-DTPA and thereafter decreased steadily to the base level at 6 h post injection in
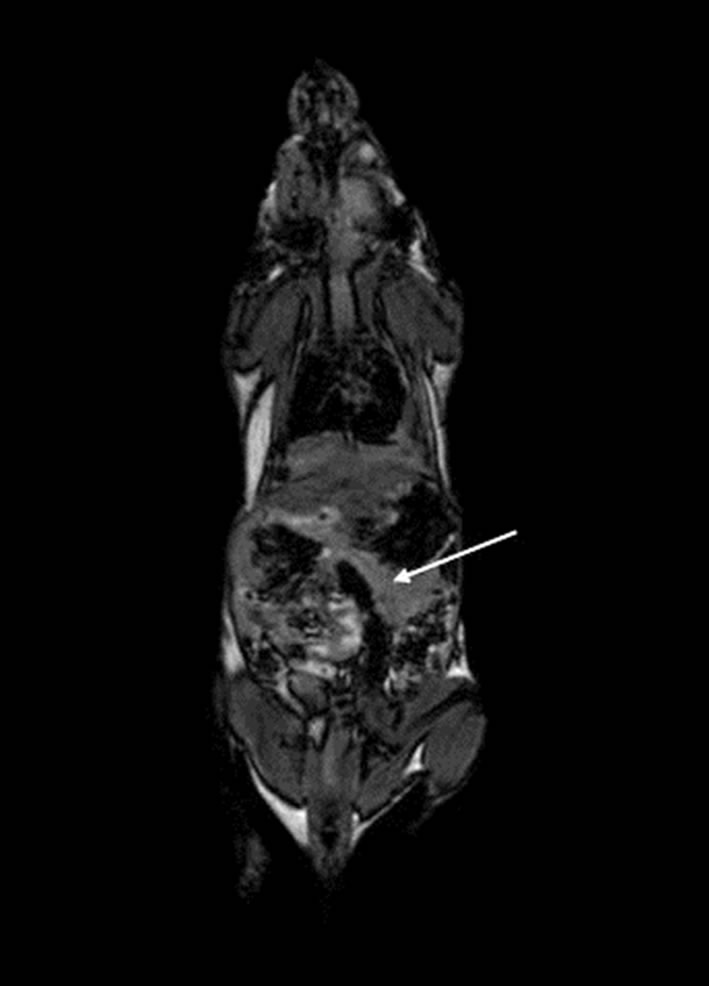
Figure 1. A representative coronal MR image of a NOD mouse at 24 h after injection of IL-2-Gd-DTPA. Abdominal organs such as spleen, liver and pancreas are visible with 1.5 T MRI. Pancreas has been marked with an arrow.
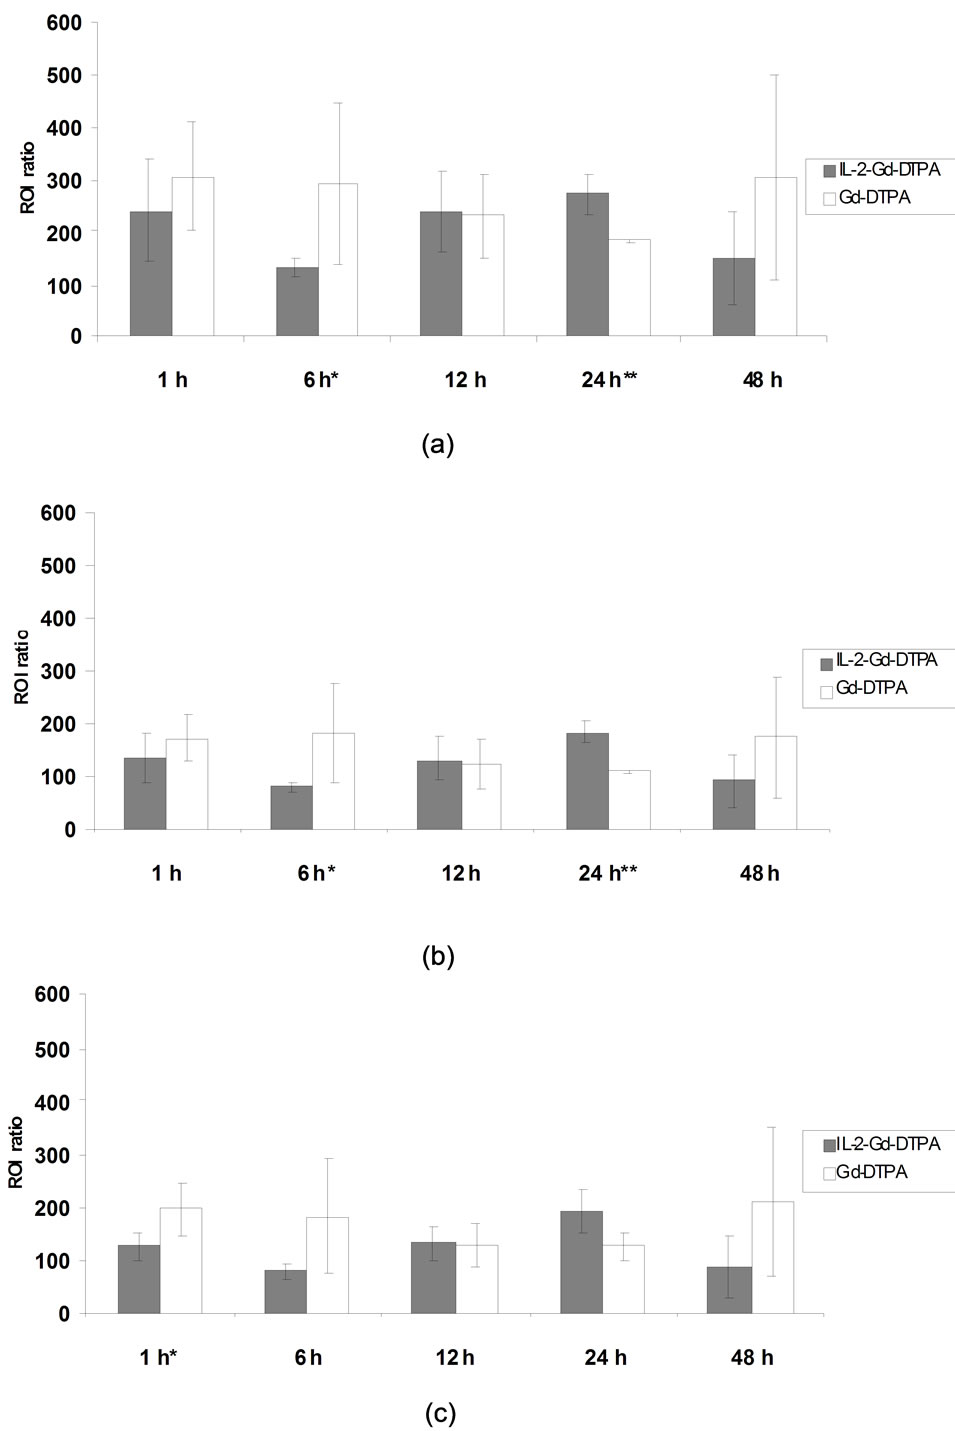
Figure 2. Tissue-to-background ROI ratio of 12-week-old NOD mice determined with 1.5 T MRI from ROIs placed in pancreas (a), liver (b) and paraspinal muscle (c) divided by background SI (as described in methods). ROI ratio of pancreas and liver was higher in mice injected with Gd-DTPA at 6 h post injection (P < 0.05*) compared to IL-2-Gd-DTPA. ROI ratio of paraspinal muscle was higher in mice injected with Gd-DTPA at 1 h post injection (P < 0.05*) compared to IL-2-Gd-DTPA. At 24 h ROI ratio of pancreas and liver were significantly higher in mice receiving IL-2-Gd-DTPA compared to control group (P < 0.05**).
plasma and at 12 h in the pancreas.
Gadolinium concentration in the pancreas divided by that of plasma (pancreas-to-plasma ratio) was calculated from ICP-MS results. In mice receiving IL-2-Gd-DTPA, the ratio peaked at 1 h post injection. It then decreased shortly, but started to increase at 12 h post injection reaching its highest value at 24 h after the i.v. injection (Figure 4). In mice receiving Gd-DTPA alone, pancreasto-plasma ratio was relatively low throughout the study. The pancreas-to-plasma ratio was 25-fold higher in mice receiving IL-2-Gd-DTPA compared to control group receiving Gd-DTPA alone at 24 h. However, due to low sample size (n = 2 vs 2, respectively) statistical significance was not reached.
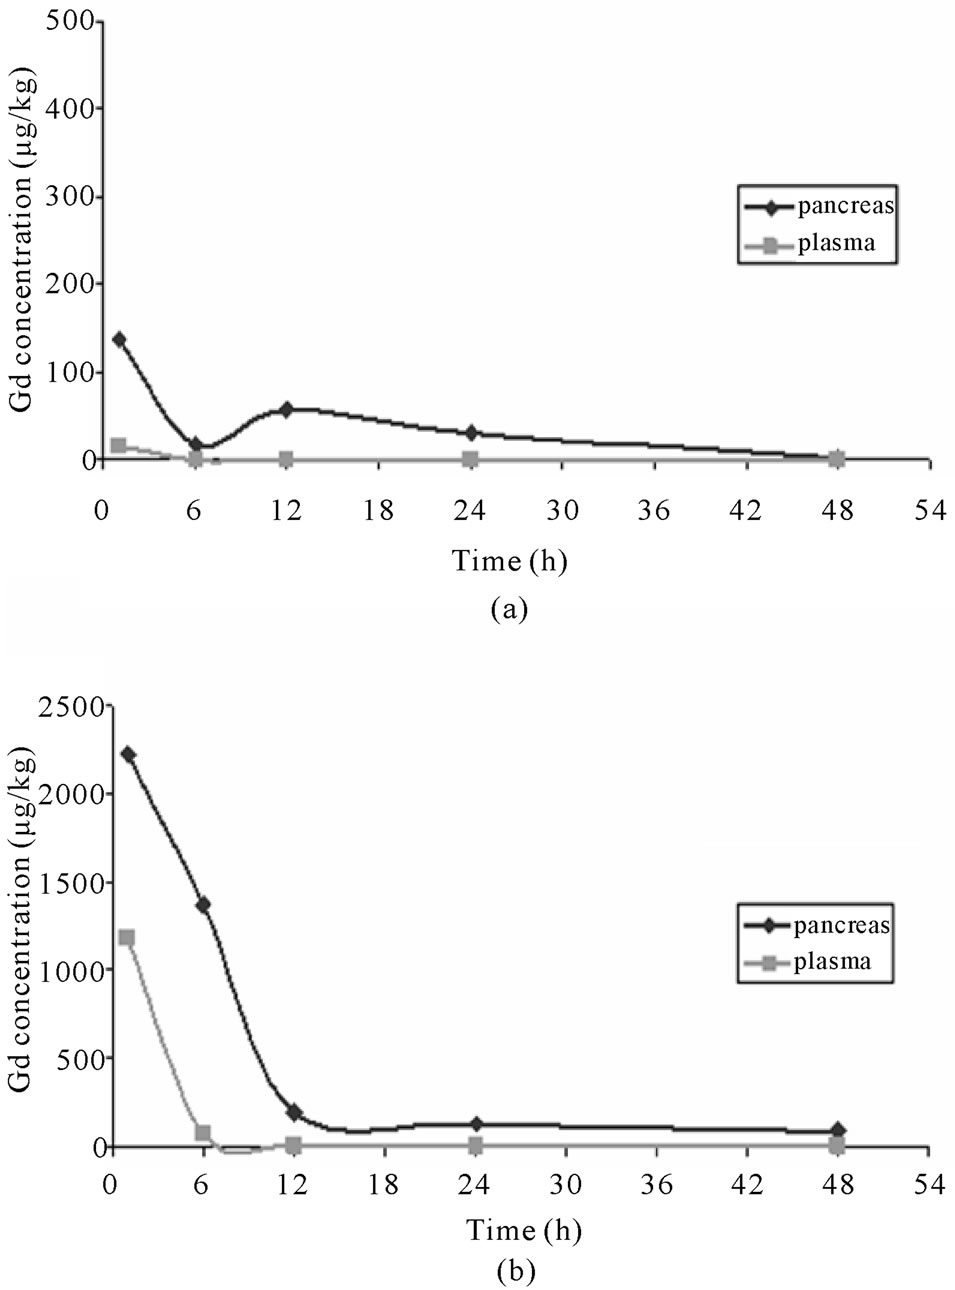
Figure 3. Graph illustrating the change of Gd concentration (µg/kg) defined by ICP-MS in pancreas (◊) and plasma (□) after IL-2-Gd-DTPA (a) and Gd-DTPA (b) i.v. injections.
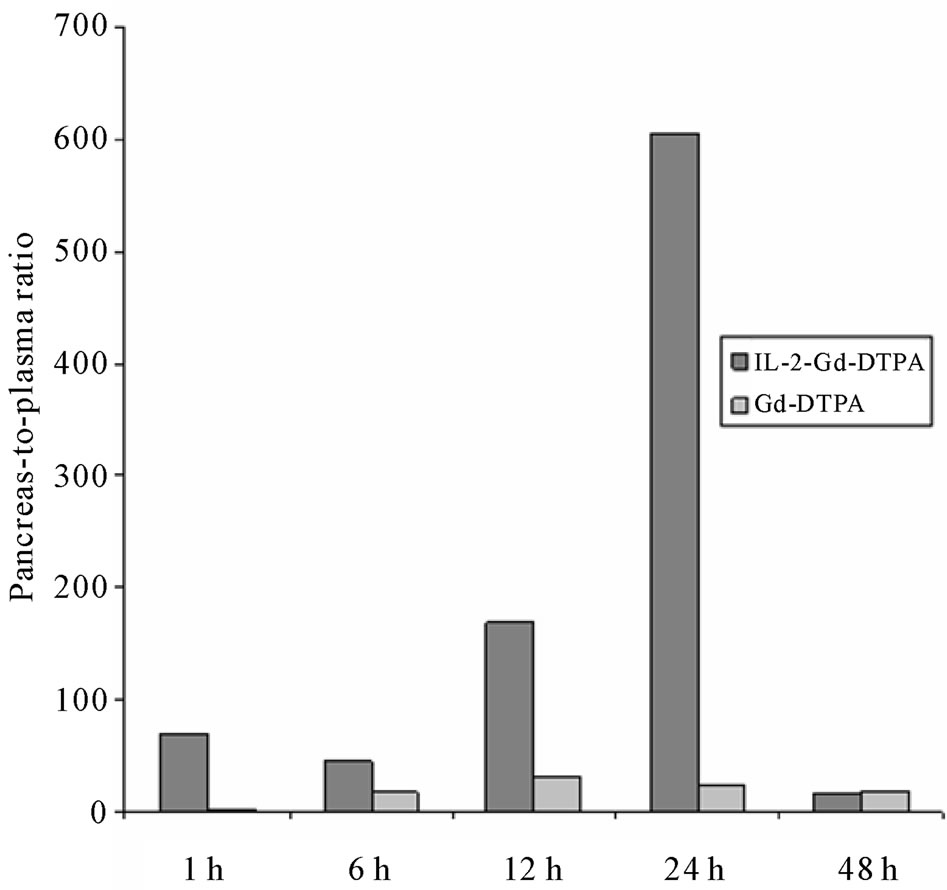
Figure 4. Pancreas-to-plasma ratio of Gd defined by ICP-MS at 1 to 48 h after injection of IL-2-Gd-DTPA or Gd-DTPA. The pancreas-to-plasma ratio was 25-fold higher in mice receiving IL-2-Gd-DTPA compared to control group receiving Gd-DTPA alone at 24 h. However, due to low sample size the statistical significance was not reached.
4. Discussion
This biodistribution and imaging study of intravenously injected IL-2-Gd-DTPA was performed in female NOD mice. Since there are no earlier studies on IL-2-GdDTPA pharmacokinetics, we compared the biodistribution of IL-2-Gd-DTPA to Gd-DTPA on 12-week-old NOD mice only. We showed that pancreas-to-plasma ratio after an i.v. injection of IL-2-Gd-DTPA in a prediabetic NOD mice led to higher values at 6 h to 48 h post injection than when Gd-DTPA was being injected.
Gd-DTPA was the first contrast medium approved for clinical use in MRI in 1980’s. Chelation of the Gd with DTPA results in a strongly paramagnetic, stable complex that is well tolerated in animals and humans. Excretion is predominately through the kidneys with greater than 90% recovery in 24 h, blood half life being about 20 min. In-vivo dose of 0.1 - 0.5 mmol/kg should produce a significant tissue enhancement. The intravenous LD50 of Gd-DTPA is 10 mmol/kg for rats. In vivo there is no evidence of dissociation of the Gd ion from the DTPA chelator [16].
Pharmacokinetic study in man has shown that the plasma level of Gd-DTPA declines steadily following a biexponential function. Signal intensity of the normal pancreas is usually greatest within 30 sec, i.e. first pass enhancement with a gradual reduction in signal over subsequent acquisitions [17]. This is a clear indication that the compound diffuses exclusively into the extracellular compartment of the body. Gd-DTPA is excreted almost exclusively by passive glomerular filtration through the kidneys, without secretion or reabsorption. There is no evidence suggesting in vivo metabolism of Gd-DTPA.
Continuous development has explored a variety of intelligent approaches for future molecular nuclear medicine imaging modalities. The conventional imaging technique using radiolabelled leukocytes is still the gold standard in nuclear medicine for the diagnosis of infection or inflammation. New multidisciplinary modalities, however, are being developed for more specific diagnostic imaging. These techniques can detect the pathological changes at a very early stage and are helpful in understanding the pathophysiology of different diseases.
Weissleder et al., first represented direct evidence that transgene expression can be visualized noninvasively by MR imaging in vivo [18]. These studies demonstrate that specific probes might be used to enhance tumour detection and imaging. However, inflammatory changes in pancreatic islets are difficult to image, owing to islets’ small size, distribution throughout the pancreas, and lack of inherent contrast from the surrounding pancreas. In addition, inflammation can be accompanied by a range of microvascular changes, including transient vasoconstriction, vasodilatation, increased blood flow and vascular leakage. All these changes may produce differences in signal intensity when measured by MRI. A resent study has explored an MRI–magnetic nanoparticle (MRIMNP) approach using long-circulating, phagotropic nanoparticles that extravasate from the leaky vessels into the surrounding tissue and are engulfed by infiltrating cells, particularly macrophages. MRI quantification of MNP accumulation was capable of distinguishing major disease landmarks in newly diagnosed adult type 1 diabetic patients [19].
IL-2 has increasingly been used to treat patients with cancers refractory to conventional treatments. Flu-like syndromes are frequent adverse events (AEs) but usually mild. Immediate hypersensitivity reactions have so far not been described [20]. Both renal and non-renal adverse reactions have been reported in the last few years following administration of Gd contrast media to patients with underlying kidney disease. It has been demonstrated that some gadolinium-based contrast agents may trigger the development of nephrogenic systemic fibrosis (NSF) [21,22]. Doses of IL-2 used as an imaging probe are only fractions of doses used for treatments. No AEs have been reported when radiolabelled IL-2 has been used.
In this study, ROI ratio measured by MRI from pancreas was app. 1.5-fold higher compared to liver and muscle when was injected i.v. to the NOD mice (Figure 2). In the pancreas of NOD mice the ROI ratio of IL-2- Gd-DTPA at 24 h was 1.5-fold (P = 0.04) higher than that of Gd-DTPA alone. Since signal intensity measurements with MRI are susceptible to errors do to multiple inflammatory and other chances in tissues, in this study, Gd concentration from plasma and pancreas was additionally measured using ICP-MS as described above. Administration of Gd-DTPA generated high Gd concentrations both in plasma and pancreas early then decreasing to the baseline level. Gd concentration in plasma after Gd-DTPA injection was 22 - 132-fold higher than after IL-2-Gd-DTPA. Gd concentrations in plasma and pancreas post IL-2-Gd-DTPA injection showed totally different behavior. Gd concentration was modest in plasma at 1 h post injection, but it nearly disappeared thereafter. In pancreas Gd concentration showed a rapid peak 1 h after injection. It then decreased but showed high values again 12 h post injection. This was striking, since throughout our study Gd concentration in plasma was very low. This same phenomenon has been observed earlier when IL-2 pharmacokinetics have been studied. Konrad et al. stated that recombinant IL-2 shows a rapid drop in serum level immediately after an i.v. bolus. The level then decreases with a half-life of 12.9 min, followed by a slower phase with a half-life of 85 min, lasting for 4 h after the bolus. The rapid drop has been explained by transport of IL-2 from the blood into the tissues [23]. Kidney is the major organ of elimination for IL-2 [24].
Earlier studies in insulitis have demonstrated increased accumulation of radiolabelled IL-2 in the inflamed pancreas of NOD mice [9,25] even though the distribution of lymphocytes expressing IL-2R is scattered in the pancreas [26]. We have previously shown with digital autoradiography that NOD mouse islets with active insulitis had markedly higher glucose uptake than surrounding exocrine pancreas [27]. All NOD mice with insulitis also had entirely intact islets, often several in the same tissue section. Measuring the signal intensity of whole pancreas will provide only an overall estimate of IL-2-Gd-DTPA content in the tissue. Weather the signal intensity of inflamed islets is markedly higher than in the whole pancreas can not be resolved using 1.5T MRI.
5. Conclusions
Our preliminary data indicate that IL-2-Gd-DTPA exhibits different pharmacokinetics than Gd-DTPA alone when injected i.v. into 12-week-old NOD mice. Pancreas-toplasma ratio of IL-2-Gd-DTPA reached its highest value at 24 h post injection. At the same time ROI ratio of pancreas-to-background measured by 1.5 T MRI shows higher values than after Gd-DTPA injection. Our results suggest, that sufficient differences may exist between IL-2-Gd-DTPA accumulating in the pancreas and in the surrounding tissues to support the use of MRI for imaging of pancreatic insulitis.
6. Acknowledgements
The study was supported by grants from Instrumentarium Research Foundation, Research Foundation of Orion Corporation, and Special Federal Research Fund for University Hospitals in Finland. The study was conducted within the Finnish Centre of Excellence in Molecular Imaging in Cardiovascular and Metabolic Research supported by the Academy of Finland, University of Turku, Turku University Hospital, and Åbo Akademi University.
The donation of IL-2 labelled Gd-DTPA by PerkinElmer Life Sciences is greatly appreciated. We thank Dr. Paul Ek (Åbo Academi, Turku, Finland) for performing ICP-MS analysis of gadolinium.
7. References
[1] P. Pozzilli, A. Signore, A. J. Williams and P. E. Beales, “NOD Mouse Colonies around the World—Recent Facts and Figures,” Immunology Today, Vol. 14, No. 5, 1993, pp. 193-196. doi:10.1016/0167-5699(93)90160-M
[2] E. F. Lampeter, A. Signore, E. A. Gale and P. Pozzilli, “Lessons from the NOD Mouse for the Pathogenesis and Immunotherapy of Human Type 1 (Insulin-Dependent) Diabetes Mellitus,” Diabetologia, Vol. 32, No. 10, 1989, pp. 703-708. doi:10.1007/BF00274528
[3] Y. Koide, T. Kaidoh, M. Nakamura and T. O. Yoshida, “Molecular Analysis of the Pathogenesis of Autoimmune Insulitis in NOD Mice,” The Tohoku Journal of Experimental Medicine, Vol. 173, No. 1, 1994, pp. 157-170. doi:10.1620/tjem.173.157
[4] G. S. Eisenbarth, “Type I Diabetes Mellitus. A Chronic Autoimmune Disease,” The New England Journal Medicine, Vol. 314, No. 21, 1986, pp. 1360-1368.
[5] A. Signore, E. Procaccini, A. M. Toscano, E. Ferretti, A. J. Williams, P. E. Beales, P. Cugini and P. Pozzilli, “Histological Study of Pancreatic Beta-Cell Loss in Relation to the Insulitis Process in the Non-Obese Diabetic Mouse,” Histochemistry, Vol. 101, No. 4, 1994, pp. 263- 269. doi:10.1007/BF00315913
[6] S. Makino, K. Kunimoto, Y. Muraoka, Y. Mizushima, K. Katagiri and Y. Tochino, “Breeding of a Non-Obese, Diabetic Strain of Mice,” Experimental Animals, Vol. 29, No. 1, 1980, pp. 1-13.
[7] N. Hatamori, K. Yokono, M. Nagata, K. Doi and S. Baba, “Interleukin 2/Interleukin 2 Receptor System in Type 1 Diabetes,” Diabetes Research and Clinical Practice, Vol. 7, Supplement 1, 1989, pp. S67-S72. doi:10.1016/0168-8227(89)90090-9
[8] P. Bedossa, A. Bendelac, J. F. Bach and C. Carnaud, “Syngeneic T Cell Transfer of Diabetes into NOD Newborn Mice: In Situ Studies of the Autoimmune Steps Leading to Insulin-Producing Cell Destruction,” European Journal of Immunology, Vol. 19, No. 10, 1989, pp. 1947-1951. doi:10.1002/eji.1830191028
[9] A. Signore, M. Chianelli, A. Toscano, L. Monetini, G. Ronga, C. C. Nimmon, K. E. Britton, P. Pozzilli and M. Negri, “A Radiopharmaceutical for Imaging Areas of Lymphocytic Infiltration: 123I-Interleukin-2. Labelling Procedure and Animal Studies,” Nuclear Medicine Communications, Vol. 13, No. 10, 1992, pp. 713-722.
[10] O. Rolandsson, T. Stigbrand, K. Riklundahlstrom, J. Eary and C. Greenbaum, “Accumulation of(125)Iodine Labeled Interleukin-2 in the Pancreas of NOD Mice,” Journal of Autoimmunity, Vol. 17, No. 4, 2001, pp. 281- 287. doi:10.1006/jaut.2001.0555
[11] J. Virostko, E. D. Jansen and A. C. Powers, “Current Status of Imaging Pancreatic Islets,” Current Diabetes Reports, Vol. 6, No. 4, 2006, pp. 328-332. doi:10.1007/s11892-006-0069-9
[12] A. Moore, J. Grimm, B. Han and P. Santamaria, “Tracking the Recruitment of Diabetogenic CD8+ T-cells to the Pancreas in Real Time,” Diabetes, Vol. 53, No. 6, 2004, pp. 1459-1466. doi:10.2337/diabetes.53.6.1459
[13] M. Srinivas, P. A. Morel, L. A. Ernst, D. H. Laidlaw and E. T. Ahrens, “Fluorine-19 MRI for Visualization and Quantification of Cell Migration in a Diabetes Model,” Magnetic Resonance Medicine, Vol. 58, No. 4, 2007, pp. 725-734. doi:10.1002/mrm.21352
[14] M. C. Denis, U. Mahmood, C. Benoist, D. Mathis and R. Weissleder, “Imaging Inflammation of the Pancreatic Islets in Type 1 Diabetes,” Proceeding of the National Academy Sciences of the United States of American, Vol. 101, No. 34, 2004, pp. 12634-12639.
[15] A. Khurana, J. F. Greene, Jr. and W. A. High, “Quantification of Gadolinium in Nephrogenic Systemic Fibrosis: Re-examination of a Reported Cohort with Analysis of Clinical Factors,” Journal of the American Academy of Dermatology, Vol. 59, No. 2, 2008, pp. 218-224. doi:10.1016/j.jaad.2008.04.010
[16] H. J. Weinmann, R. C. Brasch, W. R. Press and G. E. Wesbey, “Characteristics of Gadolinium-DTPA Complex: A Potential NMR Contrast Agent,” American Journal of Roentgenology, Vol. 142, No. 3, 1984, pp. 619-624.
[17] J. Brailsford, J. Ward, A. G. Chalmers, J. Ridgway and P. J. Robinson, “Dynamic MRI of the Pancreas—Gadolinium Enhancement in Normal Tissue,” Clinical radiology, Vol. 49, No. 2, 1994, pp. 104-108. doi:10.1016/S0009-9260(05)83450-6
[18] R. Weissleder, A. Moore, U. Mahmood, R. Bhorade, H. Benveniste, E. A. Chiocca and J. P. Basilion, “In Vivo Magnetic Resonance Imaging of Transgene Expression,” Nature Medicine, Vol. 6, No. 3, 2000, pp. 351-355. doi:10.1038/73219
[19] J. L. Gaglia, A. R. Guimaraes, M. Harisinghani, S. E. Turvey, R. Jackson, C. Benoist, D. Mathis and R. Weissleder, “Noninvasive Imaging of Pancreatic Islet Inflammation in Type 1A Diabetes Patients,” The Journal of Clinical Investigation, Vol. 121, No. 1, 2011, pp. 442- 445. doi:10.1172/JCI44339
[20] T. Vial and J. Descotes, “Clinical Toxicity of Interleukin-2,” Drug Safety, Vol. 7, No. 6, 1992, pp. 417-433. doi:10.2165/00002018-199207060-00004
[21] P. Marckmann, L. Skov, K. Rossen, J. G. Heaf and H. S. Thomsen, “Case-Control Study of Gadodiamide-Related Nephrogenic Systemic Fibrosis,” Nephrology Dialysis Transplantation, Vol. 22, No. 11, 2007, pp. 3174-3178. doi:10.1093/ndt/gfm261
[22] H. S. Thomsen and P. Marckmann, “Extracellular Gd-CA: Differences in Prevalence of NSF,” European Journal of Radiology, Vol. 66, No. 2, 2008, pp. 180-183. doi:10.1016/j.ejrad.2008.01.024
[23] M. W. Konrad, G. Hemstreet, E. M. Hersh, P. W. Mansell, R. Mertelsmann, J. E. Kolitz and E. C. Bradley, “Pharmacokinetics of Recombinant Interleukin 2 in Humans,” Cancer Research, Vol. 50, No. 7, 1990, pp. 2009- 2017.
[24] J. H. Donohue and S. A. Rosenberg, “The Fate of InterLeukin-2 after in Vivo Administration,” The Journal of Immunology, Vol. 130, No. 5, 1983, pp. 2203-2208.
[25] A. Signore, A. Picarelli, A. Annovazzi, K. E. Britton, A. B. Grossman, E. Bonanno, B. Maras, D. Barra and P. Pozzilli, “123I-Interleukin-2: Biochemical Characterization and in Vivo Use for Imaging Autoimmune Diseases,” Nuclear Medicine Communications, Vol. 24, No. 3, 2003, pp. 305-316. doi:10.1097/00006231-200303000-00011
[26] A. Signore, A. Cooke, P. Pozilli, G. Butcher, E. Simpson and P. C. L. Beverley, “Class-II and IL-2 Receptor Positive Cells in the Pancreas of NOD Mice,” Diabetologia, Vol. 30, No. 11, 1987, pp. 902-905.
[27] T. Kalliokoski, O. Simell, M. Haaparanta, T. Viljanen, O. Solin, J. Knuuti and P. Nuutila, “An Autoradiographic Study of [(18)F]FDG Uptake to Islets of Langerhans in NOD Mouse,” Diabetes Research and Clinical Practice, Vol. 70, No. 3, 2005, pp. 217-24. doi:10.1016/j.diabres.2005.04.008