Advances in Internet of Things
Vol.3 No.2(2013), Article ID:30832,7 pages DOI:10.4236/ait.2013.32004
Integrating RFID Technology with Intelligent Classifiers for Meaningful Prediction Knowledge
School of Information and Communication Technology, Griffith University, Gold Coast, Australia
Email: P.Darcy@griffith.edu.au, S.Tucker@griffith.edu.au, B.Stantic@griffith.edu.au
Copyright © 2013 Peter Darcy et al. This is an open access article distributed under the Creative Commons Attribution License, which permits unrestricted use, distribution, and reproduction in any medium, provided the original work is properly cited.
Received January 8, 2013; revised February 15, 2013; accepted February 23, 2013
Keywords: Radio Frequency Identification; Classifier; Prediction; Neural Network; Bayesian Network
ABSTRACT
Radio Frequency Identification (RFID) is a wireless technology that has been designed to automatically identify tagged objects using a reader. Several applications of this technology have been introduced in past literature such as pet identification and luggage tracking which have increased the efficiency and effectiveness of each environment into which it was integrated. However, due to the ambiguous nature of the captured information with the existence of missing, wrong and duplicate readings, the wide-scale adoption of the architecture is limited to commercial sectors where the integrity of the observations can tolerate ambiguity. In this work, we propose an application of RFID to take the reporting of class attendance and to integrate a predictive classifier to extract high level meaningful information that can be used in diverse areas such as scheduling and low student retention. We conclude by providing an analysis of the core strengths and opportunities that exist for this concept and how we might extend it in future research.
1. Introduction
Radio Frequency Identification (RFID) has become an integral part of a wide array of business applications ranging from pet identification to stock tracking at retail stores. The architecture involves attaching a large group of items which is intended to be tracked by the user with a unique identifying tag. This tag is then read wirelessly within certain proximity by a reader to determine which items are within the vicinity of the device. The observations captured in this process are then passed from the device into a middleware system that will filter out any anomalies detected at this stage. The middleware will then pass the information onto the data warehouse where the observations will be stored for later use such as data mining.
Some potential problems that occur due to RFID include anomalous readings and meaningless low-level observations. Anomalies that persist include false-negatives, readings that are meant to be present but are not false-positives, readings that exist in the data warehouse but are not meant to be present. Regarding the observations, due to the nature of the records being the tag identification number, reader identification and timestamp, without high level transformations performed on the data, the data cannot provide the user with meaningful context-specific information that can be used in business processes. For example, an observation of a tag at a specific time and location has little meaning but once it is known that it belongs to an employee taking a break from work, the information provides a higher level of meaningful information for the user. The problem of low-level information is compounded by the issues of false-negative and false-positive anomalies which reduces the overall integrity of the information.
In this research, we propose a concept that uses the information captured from tags used in a university lecture and various other instances of context-specific information to accurately predict the future attendance of students in the class. In particular, this system will not only provide lecturers with meaningful information not available from traditional attendance records, but will also be able to forecast the highest and lowest attended classes ahead of time thereby allowing lecturers to tailor their schedules accordingly. Finally, by incorporating a probabilistic approach in the system architecture, the anomalies that usually lower the overall integrity of the system will be countered to a certain degree. We have also identified two core opportunities that can enhance the system specifically by integrating the student’s personal attendance history to further tailor the report on a case-by-case basis, and by integrating multiple-class averages to analyse the overall student year and to apply that to the prediction model.
The remainder of this paper is structured as follows: Section 2 will contain the relevant background information required for this research including a brief introduction to RFID, Bayesian and Neural Networks. Section 3 provides an analysis of already existing methodologies that use RFID Technology to find the attendance of people or objects. In Section 4, we introduce our core concept by discussing the motivation, architecture and assumptions. Section 5 contains our preliminary analysis of the system and we will conclude this paper by summarising the contents and suggesting future work we intend to pursue in Section 6.
2. Background
Wireless and automatic systems such as Radio Frequency Identification (RFID) allow users to effortlessly capture large amounts of data with relative ease. Unfortunately, the captured readings are not utilised to their full potential of applications due to anomalies such as false-positive/false-negatives and the low-level nature of the observations. To counter the negative issues associated with RFID-enabled environments, intelligent classifiers can be employed to reduce the ambiguity of the captured information. Two such intelligent approaches include Bayesian and Neural Networks that use probabilistic approaches to determine the conclusion which has the highest chance of being accurate.
2.1. Radio Frequency Identification
Radio Frequency Identification (RFID) refers to technology comprised of tags and readers to uniquely identify large quantities of items automatically and wirelessly [1]. As seen in Figure 1, a tag which is either Passive, Semi-Passive or Active [2,3] is attached to an object that is desired to be tracked. Wireless readers will then interrogate all tags within certain proximity and then transmit all found tags through the middleware. The middleware is used to filter out any found anomalies such as collisions on the air interface [4] so that the readings processed further have a higher level of integrity. All the collected data are then stored within a data warehouse which is then used for further analytical techniques such as data mining or event extraction [5].
2.2. Intelligent Classifiers
When given a large set of information extracted from real-world observations, the data are prone to being unreliable due to various factors making it difficult to discover meaningful information or to predict future trends.

Figure 1. A high-level representation of the data transfer among the various components of the RFID system.
For example, in a RFID scenario, false negative or false positive [6] readings may occur due to the environment. To counter this consequence, intelligent and probabilistic techniques can be employed to correct certain anomalies [7] or to produce predictions which deterministic approaches may not be able to consider. Two such approaches include using a Bayesian Network which examines the probability of all inputs or using a Neural Network which operates similarly to the human brain.
2.2.1. Bayesian Networks
Bayesian Networks refer to a network designed to find the highest probable solution to any given problem. This is usually performed by determining the product of evidence found in a situation and comparing it with other possible causes until the greatest probable outcome has been discovered. The mathematical equation is a formula designed to express the process utilised in determining the percentage of likelihood of a cause being true. As seen in Equation (1), the probability from X1 to Xn is equal to all the products on which Xi is dependent [8].
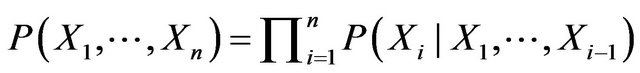 (1)
(1)
When representing a naïve Bayesian Network in a program, the probabilities are stored in a table structure containing the percentage or weight of the conclusion being correct when an observation is found to either be true or false. For each conclusion, a percentage of likelyhood is found from multiplying the weights in the cells that match up with the observations with the highest achieving conclusion being returned. The weights of the Bayesian Network can be created in a static table or dynamically such as having the network trained with a genetic algorithm to find the optimal weights of the system [9].
2.2.2. Neural Networks
As seen in Figure 2, an Artificial Neural Network is a
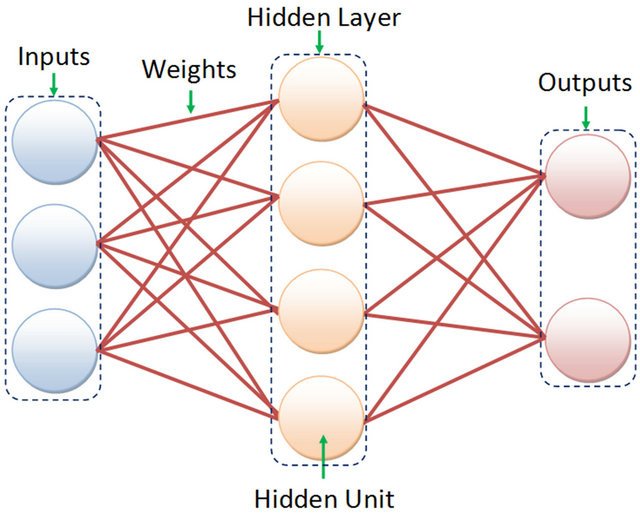
Figure 2. A high-level interpretation of how a neural network is designed with its three main layers: the input, hidden and output layers.
classifier designed to emulate the learning behaviour of the brain. It does this by creating a fixed amount of Neurons which are trained to deliver a certain output when fed various inputs. The Artificial Neural Network consists of three main layers: the Input Layer, Hidden Layer(s) and the Output Layer [10]. The processes include receiving inputs which are modified at a central sum area. The Neuron will then apply an activation function such as the hard limiter or sigmoidal functions.
When attempting to configure the Neural Network weights, one method that exists is to utilise training algorithms. Two dominant training algorithms that have been proven to excel in network training are the Back-Propagation Algorithm [11,12] and the Evolutionary Neural Network [13,14]. Back-Propagation relies on the concept of training the network by propagating error back through the network via modifying the weights after the output has been calculated. Evolutionary Neural Network training algorithm in contrast to Back-Propagation utilises the theory of genetic evolution to train the network weights. Similar to the genetic algorithm process of training a Bayesian Network, all the weights are added into a chromosome as genes to be manipulated according to the fittest output obtained.
3. Related Work
In previous studies and system architectures, Radio Frequency Identification technology has been integrated into various applications to track the attendance of people in an enclosed environment. These include hardware integrations in Schools [15,16], Asset Tracking [17] and bus tours [18]. None of these studies however have utilised the captured data to accurately predict the current or future presence of missing items. We believe that within a scenario where it is crucial to know the amount of students attending a class, the ability to predict an estimate attendance count can greatly benefit the user.
4. Proposed Methodology
The following section will introduce the core concepts of the proposed methodology. We will do this by first discussing the motivation behind the development of the concept. This will be followed by an in-depth analysis of the various components of our approach including the physical hardware, inputs, processes and outputs of the system. Finally, we will then discuss any assumptions we identified to ensure that the system is used in its intended environment.
4.1. Motivation
The primary motivation behind this research is finding an effective use of information captured from the average attendance of university classes. This has leaded us to considering a way of extracting the data to improve retention of students in classes across the university semester. A common problem with university classes are students who are not retained for the entirety of the university year. We believe that providing a predictive model that can highlight the trend of the class attendance will significantly help instructors to tailor their teaching approach to those lectures.
Additionally, by providing the students with the tags, student engagement and interaction will be encouraged as they will have a common event they can discuss with each other. Furthermore, by optionally having their name displayed on the screen and projector as they scan their tag, it may act as an ice-breaker for the class allowing students to determine each other’s names. Although this activity may not be applicable to students in second year classes and above who have already worked together for a year, we believe that first year students will benefit greatly from this. Furthermore, as the interaction between students increase, it should improve the retention rate as we believe that students encourage each other throughout the semester.
4.2. Architecture
As seen in Figure 3, the architecture of our concept contains four distinct core components. The first component is the physical hardware that includes the RFID tags used by the students to scan into the readers which are used by the lecturers. The reader will then transmit the information to the website used to record the information. The website will then store the information in the centralised database which will then be accessed by the intelligent classifiers. The Bayesian and Neural Networks will ex-
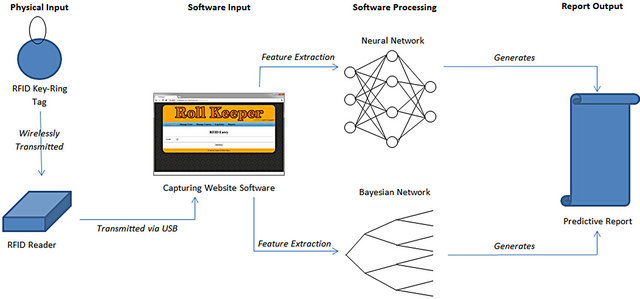
Figure 3. A high-level diagram describing the data flow of the information in the proposed concept.
tract a feature set from the database including various pieces of information gained from the system. This information can then be processed to generate a predictive report based on the likelihood of the amount of people present in the future week’s classes or if a specific person will be present during a particular week.
4.2.1. Physical Hardware
The physical hardware involved in this system includes many RFID tag keyrings which are distributed to each individual student and a RFID reader to capture these reading. The student’s tags will have a unique identification number that will align to their respective name and university student number stored on a centralised database. During the class, lecturers would have the students lining up to scan in as being present in the class with the Low-Frequency USB-powered reader. From our preliminary testing of the system, we have found that the scanning process takes less than one minute on average to record the attendance of approximately 20 students. Alternatively, other means of tag technology could be used instead of the keyring such as swipe cards which allow for the possibility in financial cost reduction.
4.2.2. Capturing Software
The capturing software consists of a website which interacts with the RFID reader to pass the identifier of the tag and current timestamp into the data warehouse. This requires the lecturer to select the correct subject and week at which point the system will then have a single form element for the identification number and a button on the site to process the data. Being that the reader automatically returns the tag id and then “enter” from the keyboard, the system will run seamlessly as the individuals walk up and swipe their tags over it. It will then store all the information entered (current timestamp, tag id, lecture, week) into their respective places in the data warehouse for further analytical processing.
4.2.3. Feature Extraction
The Feature Set Extraction will consist of the software capturing relevant information we believe will determine if the student will be present in the coming week. This includes:
• The week number: From our previous observations, we have found that there is a trend in student absences for most classes following certain weeks, for example, the week directly after a semester break. We believe that due to this factor, the week number for the currently observed week should be included in the Feature Set.
• The location of the class: We believe that the physical location of the building where the class takes place may influence the decision to attend, for example, if the class was on one side of the campus and a class previous to this was on the opposite end of campus. Since the location will most likely not be changed throughout the semester, the location will be a static variable unless changed manually.
• The size of the class: With a large amount of people present in the class, individuals would not be noticed as being absent by the lecturer. In contrast, a smaller class of fewer than 15 people, it would be harder for the lecturer not to notice an absent student. While the class size may have minor variations throughout the semester (late enrolments or students dropping the course), this variable will most likely be static throughout the semester.
• The time of the class: As some university classes are run at 8:00 am and the university is located close to the Central Business District of the city, we believe that issues such as traffic gridlock would play a significant role in discouraging students from attending class. Similarly to the previous two items, this value will be a static throughout the semester unless the class time is changed.
• The average time the student stays: In the given scenario, a student would have to scan twice to be considered attending that class. This would allow us to determine how long a student is present in the lecture each week. For example, a student may not stay for the entire duration of the class in the event they left early before a general class discussion towards the end or during a break. We could then capture each week’s time and extrapolate an average time which may play a factor in the regular attendance. Similarly to the week number, this variable would change periodically.
Additionally, we have had thoughts of extending this input information to incorporate multiple-class data, for issues such as scheduling conflicts, and the historical information of the class and the individual students. Once this information has been obtained from the data warehouse, it is processed as the input nodes for the Bayesian and Neural Networks.
4.2.4. Intelligent Classifiers
Once the feature extraction has been performed, all of the extracted information will be passed directly into the Bayesian and Neural Networks. Using the weights that have already been trained by using Back-propagation a Genetic Algorithm, the system will return a set of outputs that will correspond with each individual student in the class. Therefore, the amount of returned values will be equal to the number of students in class which will then give the user an adequate estimate of the amount of students present within the class for that specific week. Eventually, we would like to modify the structure to incorporate historical information from other semesters and possibly the student’s individual attendance record to predict the trend of attendance for the entire semester rather than the sequentially following week.
4.2.5. Predictive Reports Generated
Finally, the Bayesian and Neural Networks will return the information regarding the whole class or the individual to the user. This will be accessible as an option on the website to allow the lecturers to have access to the information dynamically and anywhere the user has access to an internet connection. Eventually, we would like to increase its user friendliness by adding various features such as highlighting the students the system predicts will not be present.
4.3. Assumptions
Regarding the practical use of the system, we have to make three core assumptions that need to be in place to ensure the predictive analysis reports provide the highest integrity. First, we have to assume that the readings obtained from the students are correct and truly reflect the people present at the lecture. For example, if one student brings in a friend’s tag to scan for both of them, the system will count this second tag as being present for every week even though this will not be the case. Second, we assume that the data input by the convenor at the start of each semester to be factual and will be updated if any changes do occur. Without this information being accurate, the historical information of other lectures taking place at the same place or location will not be useful for later iterations of the course. The final assumption we make for this concept is that the information will be recorded each time class is run. This is important for the system to extrapolate linear regressive information from the data such as a consistent decline in students after a certain date such as the mid-semester exam.
5. Analysis
In the following section, we will provide all information regarding the implementation of the technology. This includes the environment of the system including the physical hardware needed and the software required to process the data. We will then provide the core strengths and opportunities the system has been found to possess from our preliminary implementation of the system.
5.1. Environment
The physical RFID reader we have been using for this research is a USB-powered low cost system that plugsand-plays directly into the computer functioning in the same way a keyboard does. The tags and the reader both operate at 125 Khz making it necessary for students to be within approximately 5 cm of the device to be scanned and, concurrently, ensuring their privacy. The web-based system used to manage the input data has been successfully tested and runs on the Firefox and Chrome browsers. The application has been written and implemented on Linux, Apache, MySQL and PhP (Lamp) stack, Debian GNU/Linux distribution Release 6 “Wheezy” has been used as the Operating System. The client systems used in the process of capturing attendance has had Windows XP with Service Pack 3 as its Operating System. The prediction tool will be written in PhP and integrated into the current web application as an option to be chosen for the lecturers and convenors.
5.2. Concept’s Strengths
The main strength of this concept is that the predictive analysis will provide intelligent information not originally considered by the lecturer of the course. As an example, if it is known that after a mid-semester break, a large amount of students will not likely attend class, the staff member can restructure that week’s lecture to have crucial information for the course to retain students who are prone to being absent. Additionally, knowing the weeks that most students attend or miss a week in hindsight will allow the convenors to structure the course in such a way that would be tailored to most students, for example, introducing and discussing the assignment in an earlier week when the majority of the class is present. Finally, we believe that be incorporating a predictive model over traditional deterministic methodologies, a level of ambiguity crucial for the system to cope with false-negative and false-positive anomalies present in the observation data sets will be provided.
5.3. Concept’s Opportunities
We have also discovered several opportunities which we would like to pursue in future work after the implementation of the system is complete. The two core opportunities include incorporating multiple-class information categorised by certain characteristics and using historical information relative to the students to further enhance the prediction of their attendance. By using the predictive analysis over multiple-classes, we could incorporate extra information for that specific category. This includes categorising the students based on the department or university, age group of the students or specific classes/ lecturers. Furthermore, we believe that, if this approach was run over long periods of time, a trend could emerge from a student’s behaviour over their time at university. This could additionally be used on a case-by-case scenario to improve specific student retention. From the incorporation of this extra information not originally designed in the initial approach, we believe that the predictions determined by the classifiers will increase in accuracy thereby providing staff with greater opportunities to encourage and help students through their university tuition.
6. Conclusions
In this research, we have proposed an extension to a RFID-enabled attendance recording system that would provide lecturers and convenors information about students that was previously not possible. We believe that by using this information, the users can significantly enhance their teaching experience. The primary motivation of this concept was to take the observations from the automatic attendance system and incorporate intelligent approaches to turn the observations into high level meaningful predictive analysis information. This resulted in the presented concept outline in this research that incurporates the both Bayesian and Neural Networks. We have identified that the main strength of this concept include bringing information to the lecturers about the students not originally found from standard analysis of attendance records. Additionally, the system is able to identify the classes that students are most likely to attend or miss allowing lecturers to tailor the course around these constraints. Finally, by incorporating a probabilistic approach to predict the attendance, we believe that the system will be able to handle the ambiguity due to the anomalies present in the majority of RFID applications.
Regarding future work, we first intend to completely implement the concept described in this paper with the preliminary information we gained from the previous integration of the system. As discussed previously, we believe that the incorporation of average class information over multiple courses and personal histories of student attendance will enhance the integrity of the system. We would also like to incorporate other probabilistic classification techniques such as a Support Vector Machine or Hidden Markov Model and to investigate the potential of integrating deterministic approaches such as Non-Monotonic Reasoning into the classification approach as well.
Another possible future research area we would like to explore would involve integrating Near Field Communication (NFC) technology. This will not only allow the integration of NFC tags but also Smart Phones as the readers that may provide additional sensor readings. It would then be possible to extract sensor information regarding the environment such as the geographical location or temperature which can then be incorporated into the feature set input. For each class, we would also like to incorporate a second scan of the students as they leave the room therefore adding extra information to the intelligent classifiers. Coupled with the scan at the beginning of class, this will determine how long the students attend the class and if they only stay for a certain portion of the class. Finally, while we have applied this technology in an education environment for a local university, we do believe that this approach can be applied to a wide-array of domains that require large amounts of people to attend specific events.
REFERENCES
- S. S. Chawathe, V. Krishnamurthy, S. Ramachandran and S. E. Sarma, “Managing RFID Data,” Proceedings of the Thirtieth International Conference on Very Large Data Bases, Vol. 30, 2004, pp. 1189-1195.
- P. Darcy, B. Stantic and A. Sattar, “A Novel Integrated Classifier for Handling Data Warehouse Anomalies,” Advances in Databases and Information Systems (ADBIS 2011), Vienna, 20-23 September 2011, pp. 98-110.
- R. Derakhshan, M. E. Orlowska and X. Li, “RFID Data Management: Challenges and Opportunities,” IEEE Conference on RFID, Brisbane, 26-28 March 2007, pp. 175- 182.
- P. Pupunwiwat and B. Stantic, “Resolving RFID Data Stream Collisions Using Set-Based Approach,” The Sixth International Conference on Intelligent Sensors, Sensor Networks and Information Processing (ISSNIP 2010), Gold Coast, 7-10 December 2010, pp. 61-66.
- P. Darcy, P. Pupunwiwat and B. Stantic, “The Fusion of Pre/Post RFID Correction Techniques to Reduce Anomalies,” Intelligent Sensor Networks: Across Sensing, Signal Processing, and Machine Learning, CRC Press, New York, 2012. doi:10.1201/b14300-28
- P. Darcy, B. Stantic and A. Sattar, “Applying a Neural Network to Recover Missed RFID Readings,” Australasian Computer Science Conference (ACSC 2010), Brisbane, 18-22 January 2010, pp. 133-142.
- P. Darcy, B. Stantic and A. Sattar, “X-CleLo: Intelligent Deterministic RFID Data and Event Transformer,” Journal of Personal and Ubiquitous Computing, Vol. 16, No. 3, 2011, pp. 259-269.
- M. Singh and M. Valtorta, “Construction of Bayesian Network Structures from Data: A Brief Survey and an Efficient Algorithm,” International Journal of Approximate Reasoning, 1995, pp. 259-265.
- P. Darcy, B. Stantic and A. Sattar, “Augmenting a Deferred Bayesian Network with a Genetic Algorithm to Correct Missed RFID Readings,” Malaysian Joint Conference on Artificial Intelligence (MJCAI 2009), Kuala Lumpur, 14-16 July 2009, pp. 106-115.
- W. S. Mcculloch and W. Pitts, “A Logical Calculus of the IdeasImmanent in Nervous Activity,” Bulletin of Mathematical Biophysics, Vol. 5, No. 4, 1943, pp. 115-133. doi:10.1007/BF02478259
- D. Rumelhart, G. Hinton and R. Williams, “Learning Representations by Back-Propagating Errors,” Nature (London), Vol. 323, 1986, pp. 533-536.
- M. Blumenstein, X. Y. Liu and B. Verma, “An Investigation of the Modified Direction Feature for Cursive Character Recognition,” Pattern Recognition, Vol. 40, No. 2, 2007, pp. 376-388. doi:10.1016/j.patcog.2006.05.017
- J. Holland, “Adaptation in Natural and Artificial Systems,” University of Michigan Press, Massachusetts, 1975.
- A. Rooij, R. Johnson and L. Jain, “Neural Network Training Using Genetic Algorithms,” World Scientific Publishing Co., Inc, River Edge, 1996.
- AT&T, “RFID Tags Help Schools Keep Tabs,” 2008. http://www.corp.att.com/edu/docs/k12rfid2.pdf
- C. Des Marais, “Texas School Uses RFID Badges to Track Student Locations,” 2012. http://www.pcworld.com/article/2011352/texas-school-uses-rfidbadges-to-track-student-locations.html
- G. Bhanage, Y. Zhang, Y. Zhang, W. Trappe and R. Howard, “Roll Call: The Design for a Low-Cost and Power Efficient Active RFID Asset Tracking System,” The International Conference on Computer as a Tool, Piscataway, 9-12 September 2007, pp. 2521-2528.
- W. Wang, C. Chang and C. Huang, “A Study on RFID Combined with Network Technology for Collective Management of Tour Bus Tourists,” Service Systems and Service Management (ICSSSM), Shanghai, 2-4 July 2012, pp. 547-550.