Journal of Behavioral and Brain Science
Vol.4 No.8(2014), Article
ID:49361,10
pages
DOI:10.4236/jbbs.2014.48037
Quantitative Objective Assessment of Websites by Neurocode-Tracking in Combination with Eye-Tracking
Wilfried Dimpfel1, Andrè Morys2
1Justus-Liebig-University Giessen c/o NeuroCode AG, Wetzlar, Germany
2Web Arts AG, Bad Homburg v. d. Höhe, Germany
Email: w.dimpfel@neurocode-ag.com, andre.morys@web-arts.com
Copyright © 2014 by authors and Scientific Research Publishing Inc.
This work is licensed under the Creative Commons Attribution International License (CC BY).
http://creativecommons.org/licenses/by/4.0/


Received 30 June 2014; revised 16 August 2014; accepted 28 August 2014
ABSTRACT
Assessment of websites remains a definite challenge within advertisement research. In order to gather objective information, one possibility exists in using Eye-Tracking. This method allows for determination of where and how long particular areas of a website are fixed. However, longer fixation values do not necessarily reflect higher attention or even memorizing of the content. It could also mean that the content is too complicated. Therefore more information can be obtained by addition of quantitative analysis of brain electricity. Following the changes of the frequency content of electric brain activity has been recently introduced as “Neurocode-Tracking”. In the present study, quantitative assessment of websites has been performed by the combination of Neurocode-Tracking with Eye-Tracking. Fast dynamic quantitative EEG recording with a time resolution of nearly 3 images/second provided electric power values according to frequency analysis in 17 brain regions (electrode positions). Particular values represented changes of electric brain activity, which were interpreted to represent visual perception, mental activation, concentration, stimulation, memory and tension according to earlier experience. Eye-Tracking was performed in a conventional manner by defining special areas of interest for detection of fixation lengths and time to first awareness. Ten male subjects (aged 36 ± 4.4 years) entered the study. They were asked to view Internet landing pages of five bank institutions: ComDirect, DKB, INGDiBa, Postbank and Targo-Bank. According to Eye-Track analysis, ComDirect was recognized to have the shortest time-to-awareness with respect to conditions, bonus, faces and application or address form. With respect to region of interest “service”, INGDiBa showed the shortest time-to-awareness. Neurocode-Tracking provided best results for INGDiBa with respect to mental activation and concentration. Stimulation and memory values were headed by Targo-Bank. Lowest tension was observed by the landing page of the Postbank. In summary, the combination of NeurocodeTracking and Eye-Tracking provided much more information than any one of the methods used in separate. We therefore recommend this combination for the assessment and optimizing of Internet websites.
Keywords:Neurocode-Tracking, Eye-Tracking, Quantitative EEG, Internet Surfing, CATEEM

1. Introduction
During the last years, the expression “Neuromarketing” has entered the field of market research. It suggests a combination of brain research with market research. However, the word “Neuromarketing” is ill-defined and obviously misused in many cases. The question therefore arises how brain research might contribute to, for example, advertisement research. A common methodological approach in this field consists in using an EyeTracker in order to follow the glances of a subject when watching TV commercials or during internet surfing. The camera following the eye movements provides information of when, where and how long an area of interest is fixed by the subject. But interpretation of such data is discussed controversially. Longer fixation of an area does not necessarily mean higher attention, but could also mean that the matter is depicted in a too complicated manner. This would be negative. Additional information is needed. It might be provided by analysing electric brain activity concomitantly with using the Eye-Tracking methodology. Quantitative assessment of electric brain activity based on frequency analysis has been reported earlier [1] [2] . By special processing of the frequency data succeeding in quantitative brain maps, various states of cognition and emotion have been described and named “Enkephaloglyphs” [3] . A combination of Eye-Tracking and EEG has been used during natural reading [4] . Meanwhile, even very short epochs of 364 ms duration of the electroencephalogram (EEG) are accessible for frequency analysis and were reported as Neurocode-Tracking in combination with Eye-Tracking [5] . The present investigation aimed at the proof of the concept of using this new methodology for assessment of websites during Internet surfing. Ten male subjects (aged 36 ± 4.4 years) entered the study. They were asked to view Internet landing pages of five banking institutions. Parameters of assessment were surrogate parameters like visual perception, focused attention, memory, mental activation and tension, which were based on changes of frequency contents in particular brain regions observed during earlier experiments.
2. Method
Ten male subjects aged 36 ± 4.4 years participated in this pilot proof of concept study. They all were internet users. They were tested for alcohol and were not allowed to have coffee or to smoke before and during the experiment. After giving informed consent, subjects were asked to surf at predefined landing pages and registration forms of 5 different banking institutions: ComDirect, DKB, INGDiBa, Postbank and Targo-Bank. Websites were presented by anEye-Tracking device (Tobii GmbH, Frankfurt, Germany). For the duration of the web-surfing on one page a so-called Heat-Map was constructed. After definition of particular areas of interest (ROI’s), time to awareness was calculated by the evaluation program. The definitions of areas of interest are given in Figure 1.
Neurocode-Tracking was performed at the same time (neo-CATEEM, MEWICON CATEEM-Tec GmbH, Schwarzenberg, Austria).The Electroencephalogram [6] was recorded according to the international 10:20 system [7] from 17 electrode positions, amplified, digitized after Hanning filtering and analysed for frequency content using Fast-Fourier-Transformation. The frequency spectrum was divided into six ranges: Delta: 1.375 - 4.125 Hz; Theta: 4.125 - 6.875 Hz; Alpha 1: 6.875 - 9.625 Hz; Alpha 2: 9.625 - 12.375 Hz; Beta 1: 12.375 - 17.875 Hz; Beta 2: 17.875 - 34.375 Hz. This special frequency bands allowed for analysis of epochs of 364 ms duration [8] . An electro-oculogram was recorded together with the EEG and served for artefact rejection with respect to eye blinks, which otherwise lead to false delta values. Functional brain maps were achieved by transforming spectral power values into spectral colours and additive colour mixture according to the so-called RGB mode like in TV [9] . An example of the documentation of Neurocode-Tracking is given in Figure 2. For evaluation of differences between websites data from Eye-Tracking and Neurocode-Tracking were averaged for the time of viewing of each website (1 min for the landing page, 0.5 min for registration page). Finally, a questionnaire was asked to be filled out for subjective impressions. For statistical purposes the two-tailed non-parametric “Vorzeichentest” was used [10] .
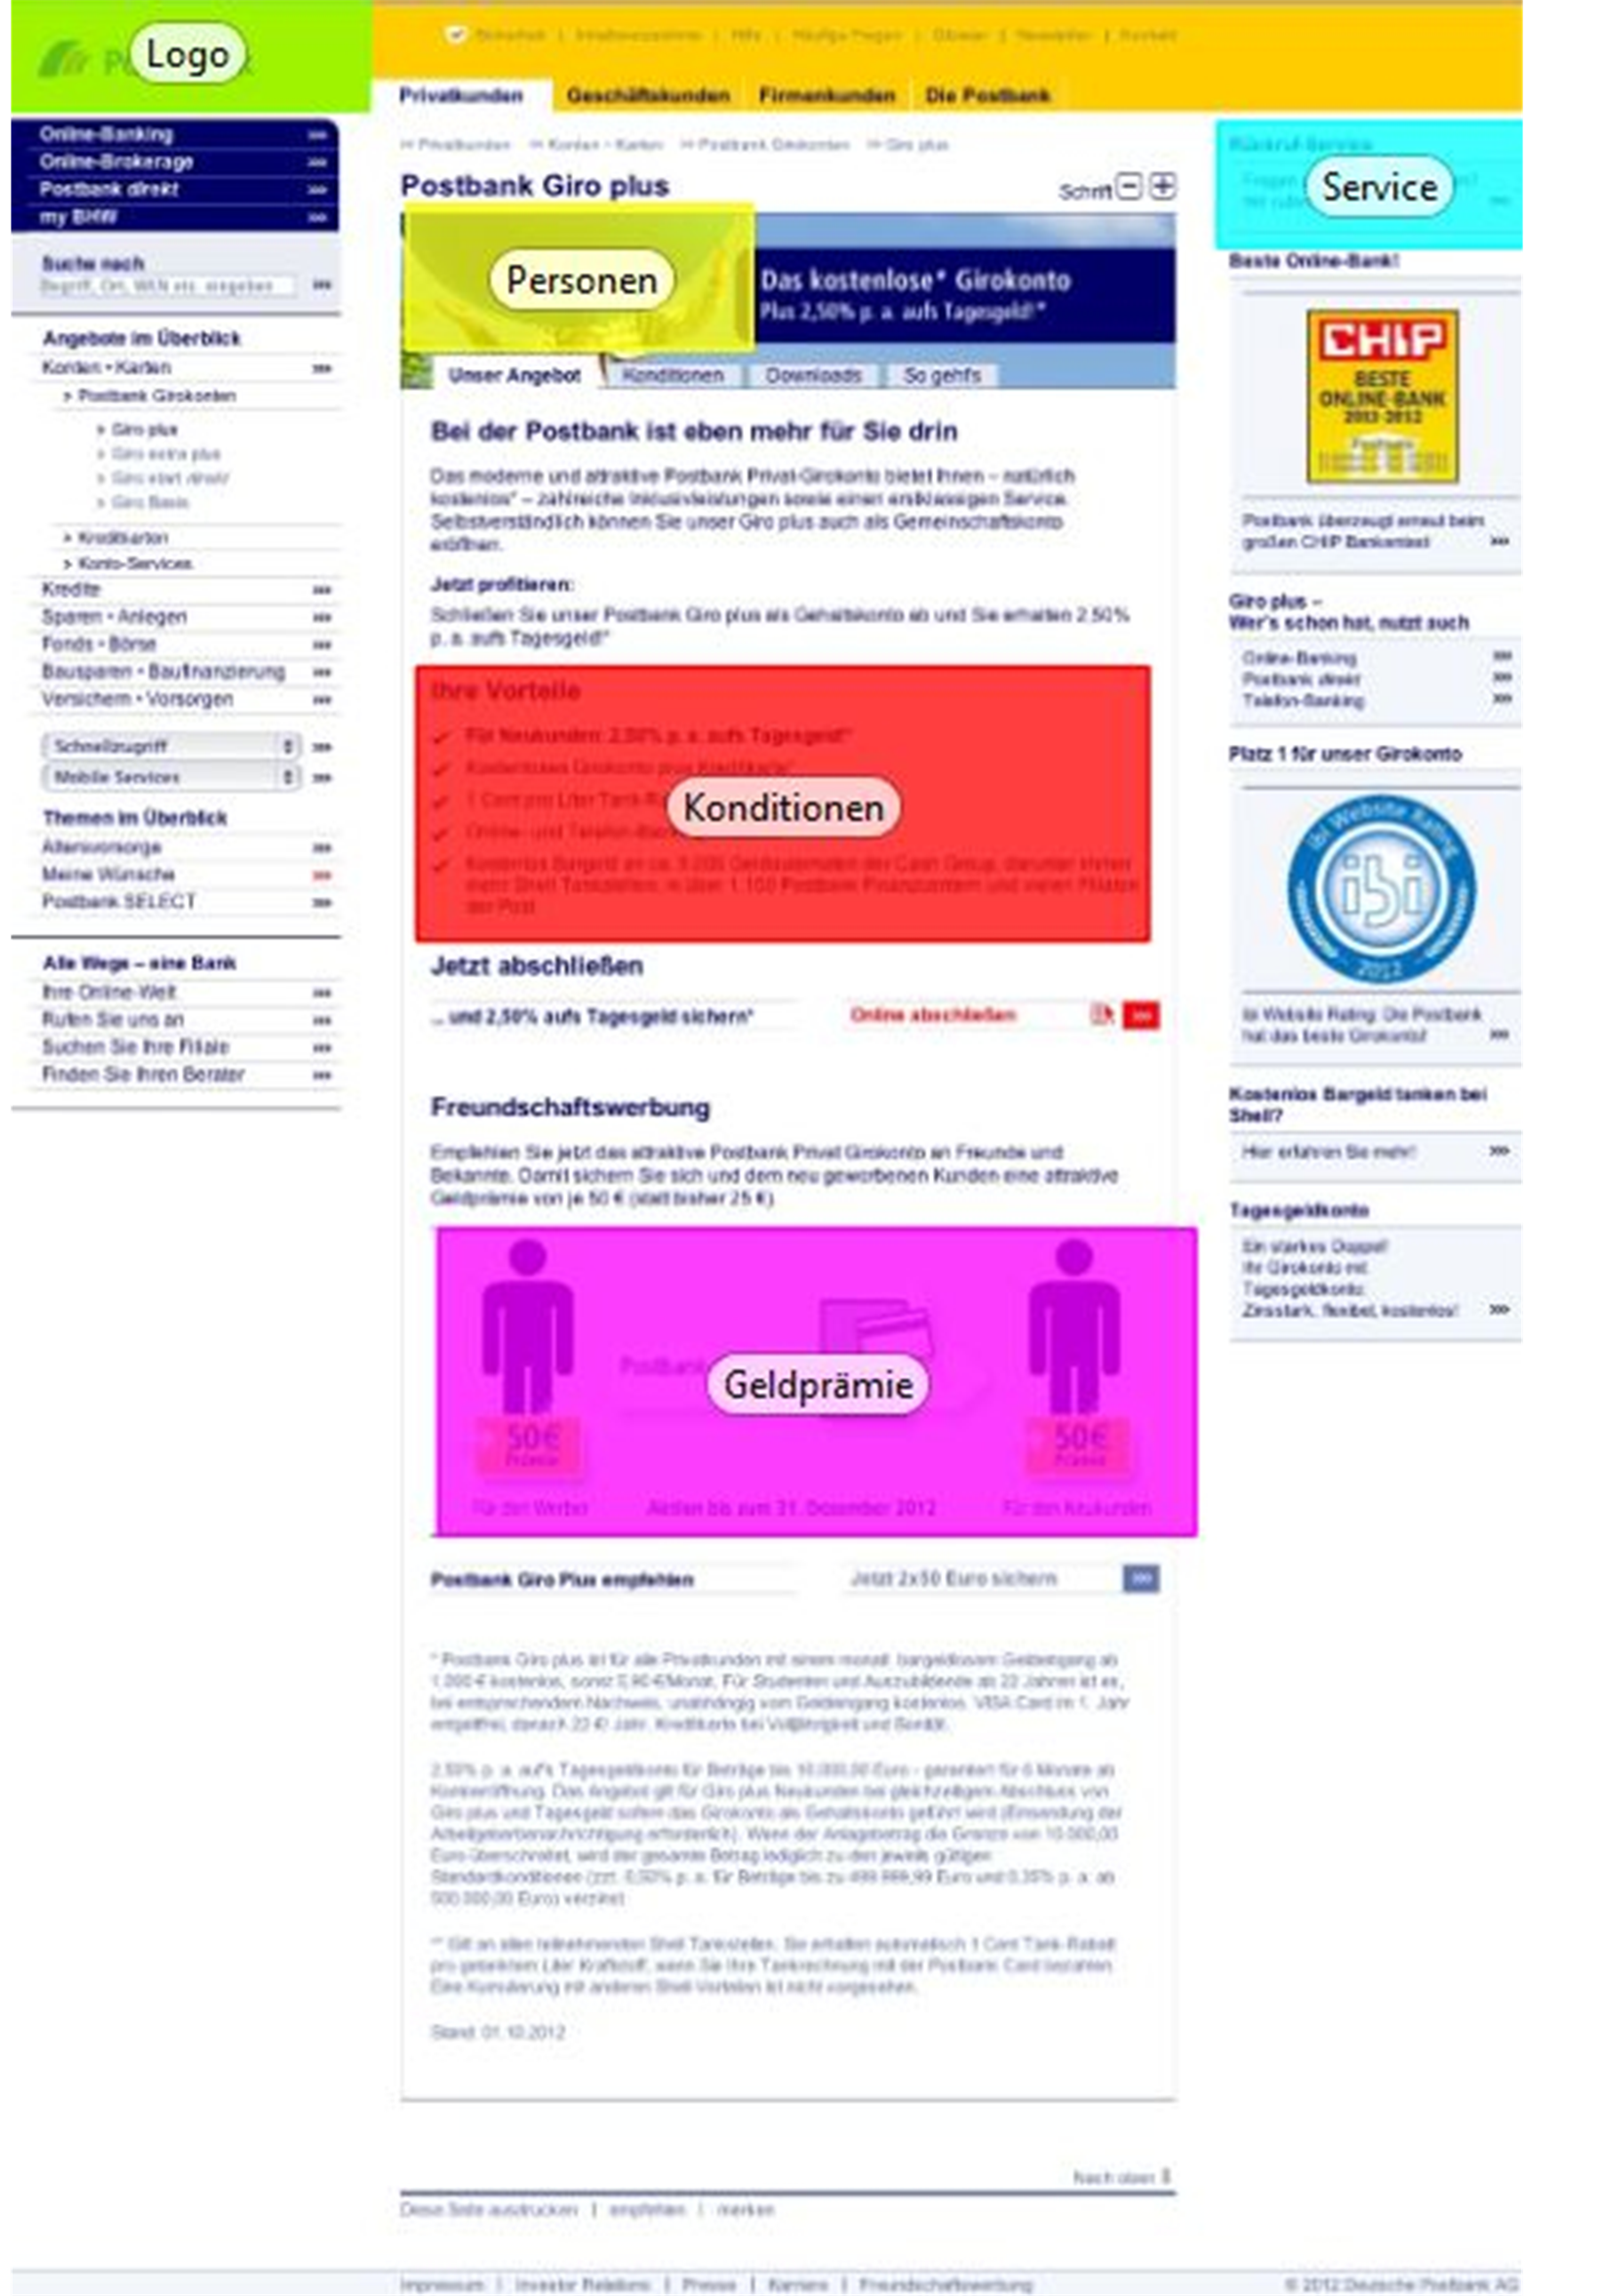
Figure 1. Definition of areas of interest for further analysis of fixation times and time-to-awareness analysis.

Figure 2. Documentation of are presentative enkephaloglyph obtained from fast dynamic quantitative EEG recording (Neurocode-Tracking) showing 364 ms of the raw signal on the left side (verticalenlightment) and brain mapping (upper right). Bar chart (middle lower part) depicts focal alpha2 activity (green bar) within the right temporal lobe (Position T6) indicating a memory process. Glance from Eye-tracking (right of the bar chart) is marked by a very small red spot on the website (middle upper part at first written line). Right from this a time course of frequency changes is depicted for electrode position F7 (marked yellow on the raw signal on the left side). Delta power is marked red, theta orange, alpha1 yellow, alpha2 green, beta1 turquoise and beta2 blue. Numbers in the lower right corner represent % regional power for each frequency range.
3. Results
The presentation by the Eye-Tracking device was started with a gong for synchronisation purposes between Eye-Tracking and Neurocode-Tracking. After this, a fixation cross was presented for one minute providing a reference for the EEG recording condition “eyes open”. Classic evaluation of eye-tracking data provides information where subjects have concentrated their glances over time. The result is documented as a so-called “HeatMap”. Figures 3-7 show such maps for the five different landing pages. With respect to the ComDirect bank 3 “hot spots” were achieved: 1) “Kostenloses Bargeld mit der Girocard”, 2) “50€ wenn Sie uns mögen”, and 3) “Preise und Konditionen” (Figure 3). With respect to the DKB bank attention was obviously focussed on the logo in the left upper corner (Figure 4). Most attention at visit of the INGDiBa website was given at the heading of “Kostenlos”, which means “free of charge”. Heat-map is shown in Figure 5. A different pattern of focused attention was detected with respect to the landing page of the Postbank. Here, subjects concentrated on the heading of “Vorteile”, which means “advantages” (Figure 6). Finally, the Heat-map of the Targo-Bank provided information on particular interest to the heading of “Aktiv Konto”. The resulting Heat-map is depicted in Figure 7. Thus, Heat-maps are insofar interesting as they provide information on particular preferences of the visitor of the website. Every bank obviously used different “Eye catcher” slogans in order to catch attention of the internet visitor.
Another way to look at Eye-Tracking data is to determine the time which passed before a particular region of interests was detected by the visitor for the first time (Table 1). With respect to “conditions” and “service” INGDiBa clearly succeeded in the shorter times, whereas with respect to “Geldprämie” ComDirect bank was most successfully.
Looking now at the results from Neurocode-Tracking one can see clear differences in mental activation between just looking at a fixation cross and visiting the landing pages of the bank portals. Results are depicted as functional brain maps in Figure 8. Strongest activation is observed for the website of INGDiBa.
In order to quantify the results from Neurocode-Tracking electric power was determined with respect to particular brain regions and frequencies. Based on extensive earlier experience these spectral signatures were transformed into psychological states. For example high concentration is reflected by high theta power in
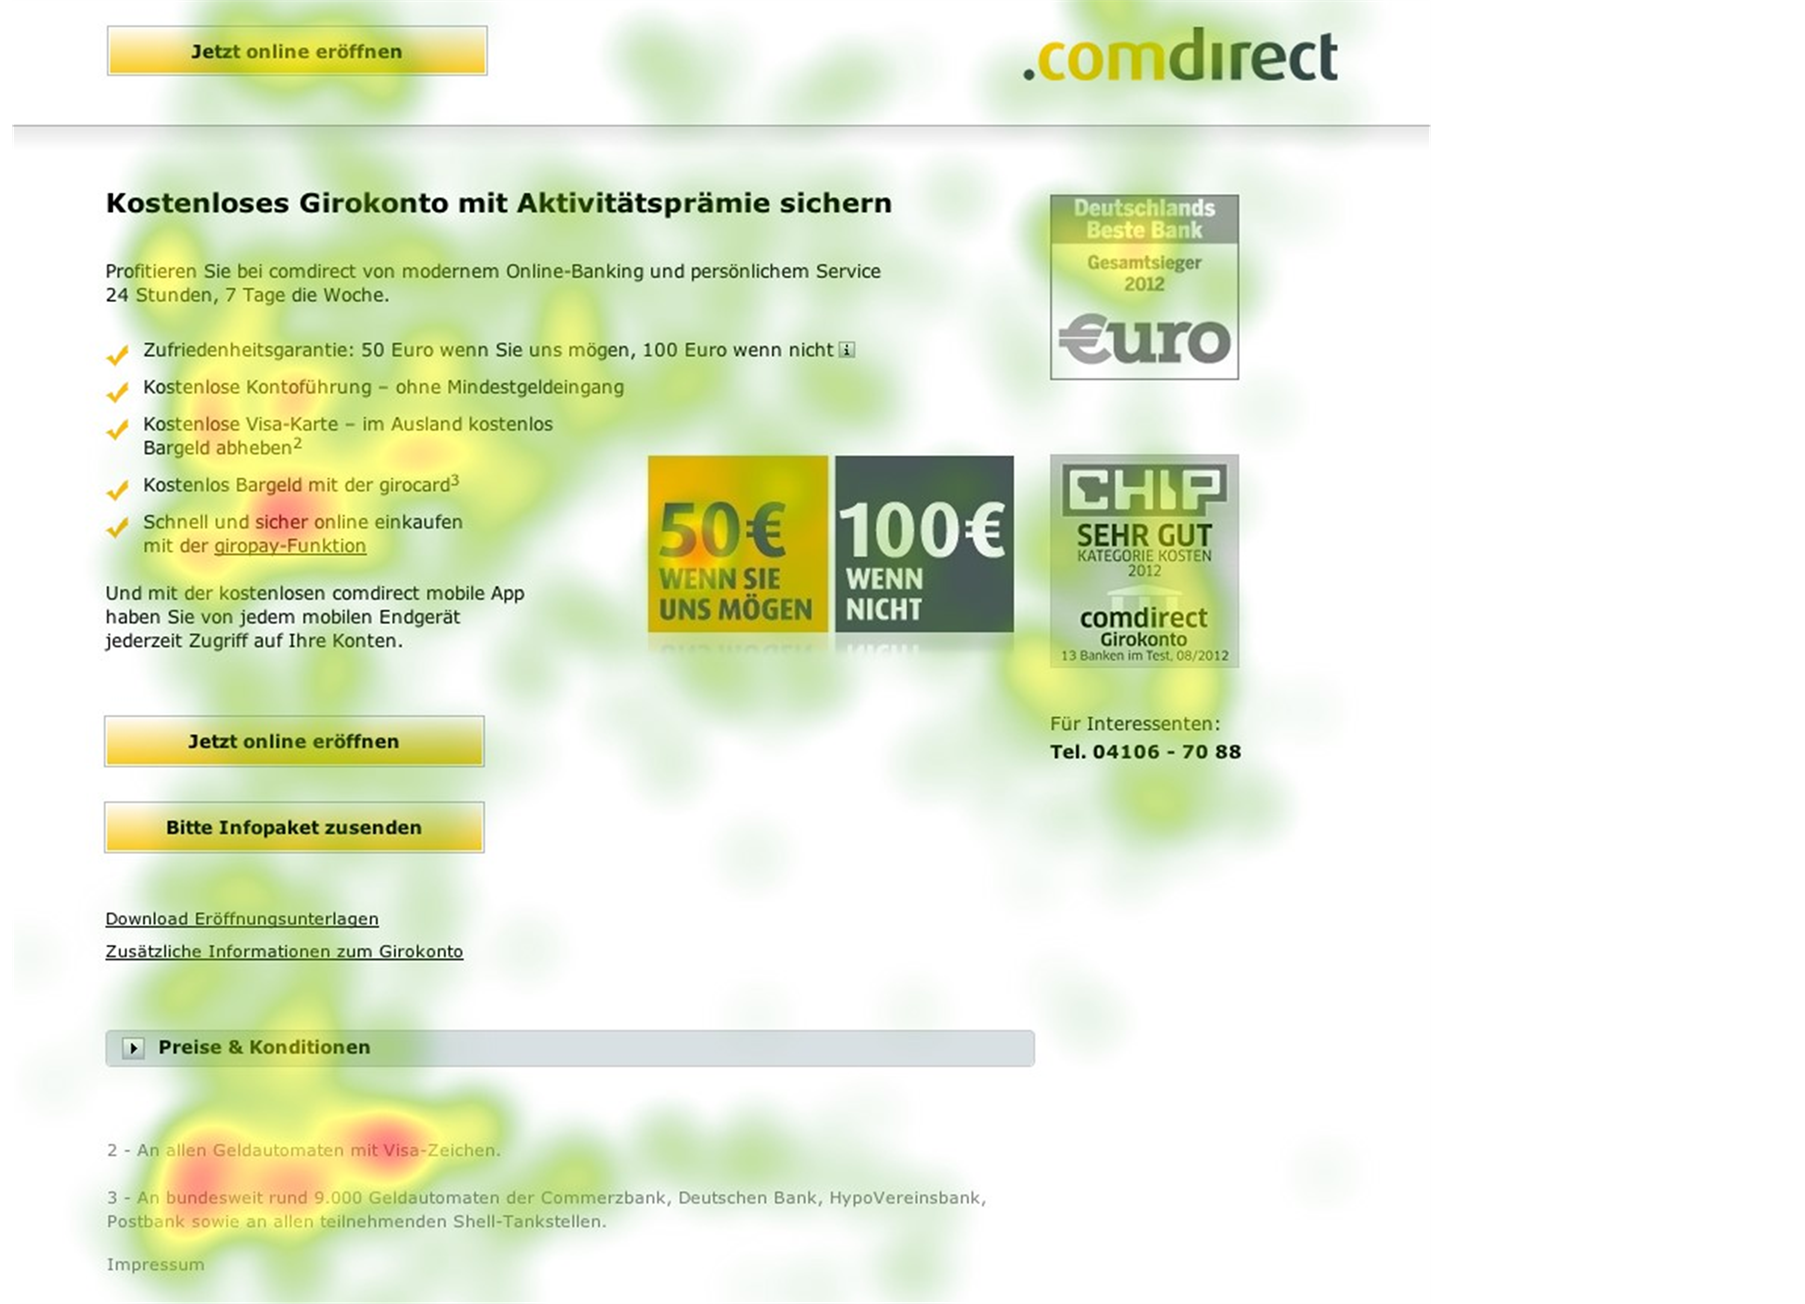
Figure 3. Heat-map of the ComDirect landing page. Highest fixation is documented as red spot.
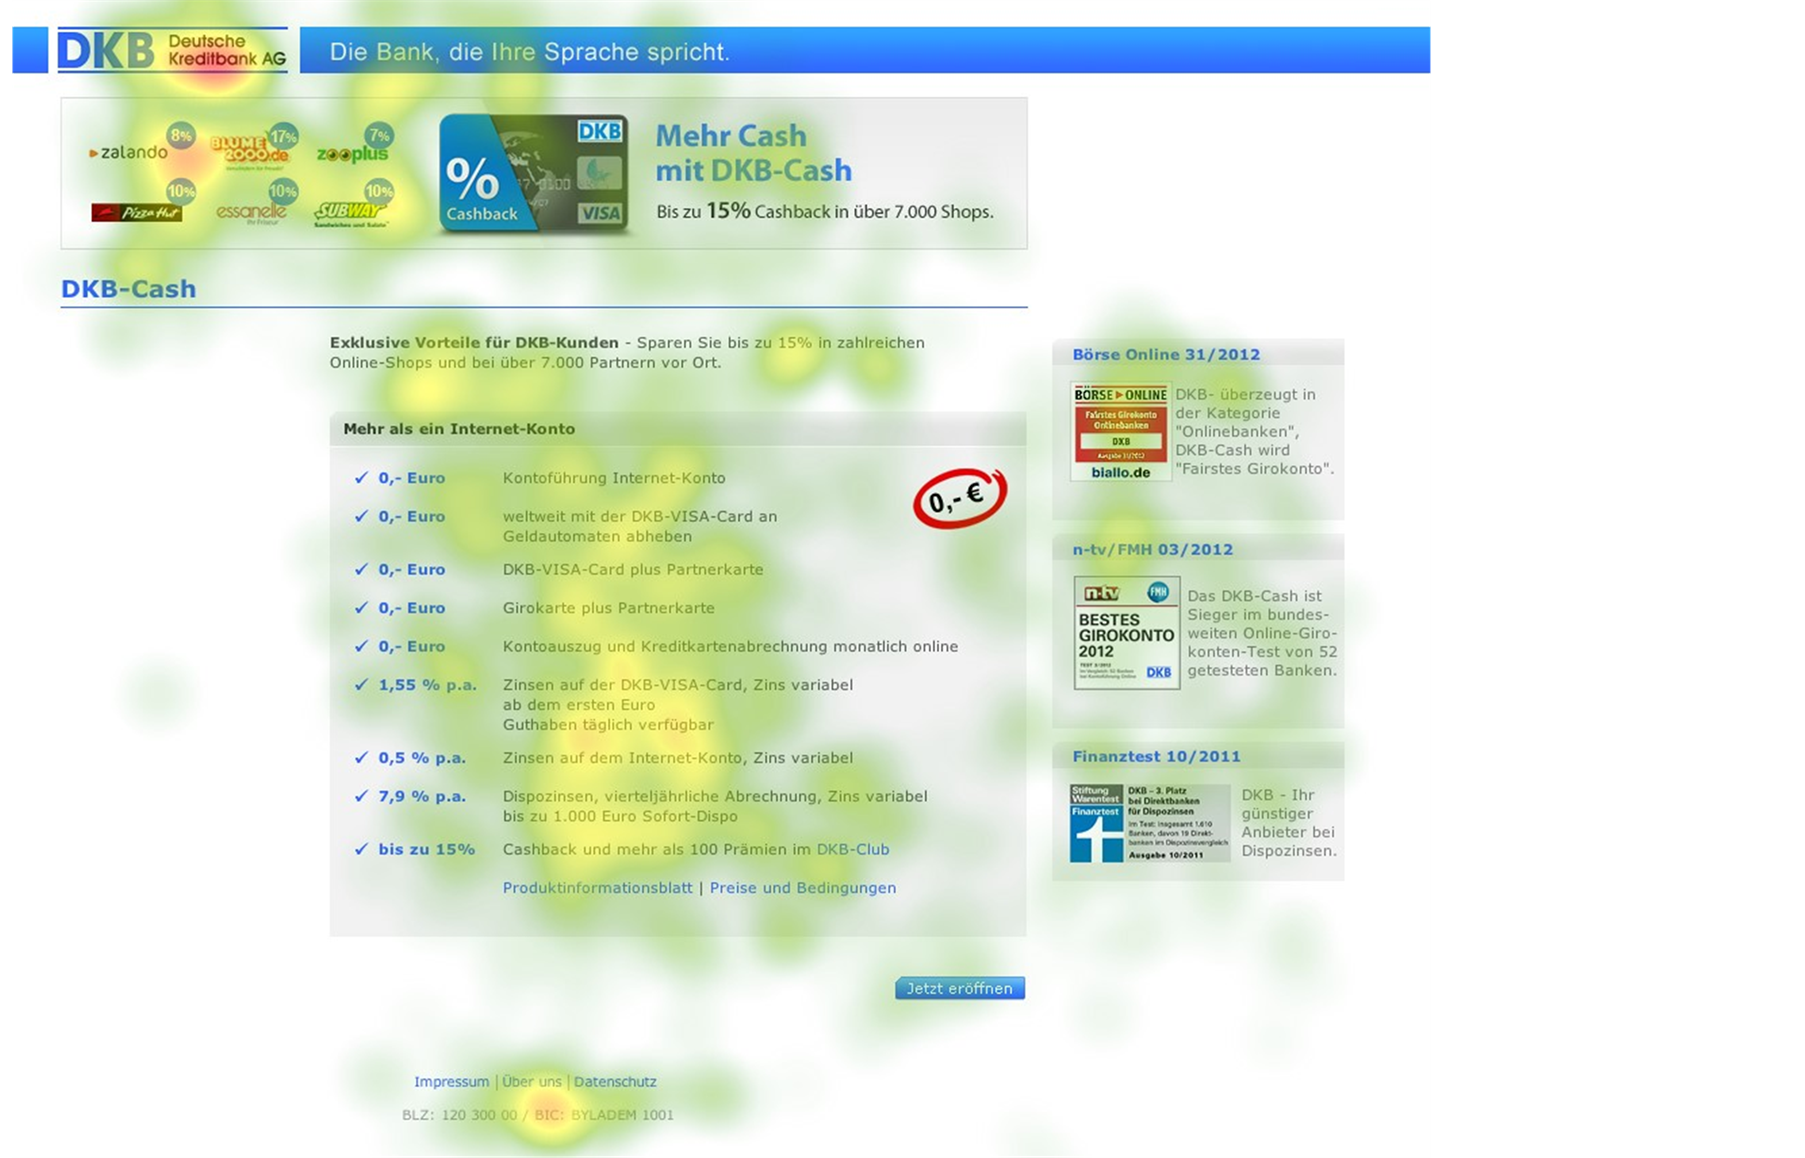
Figure 4. Heat-map of the DKB landing page. Highest fixation is documented as red spot.
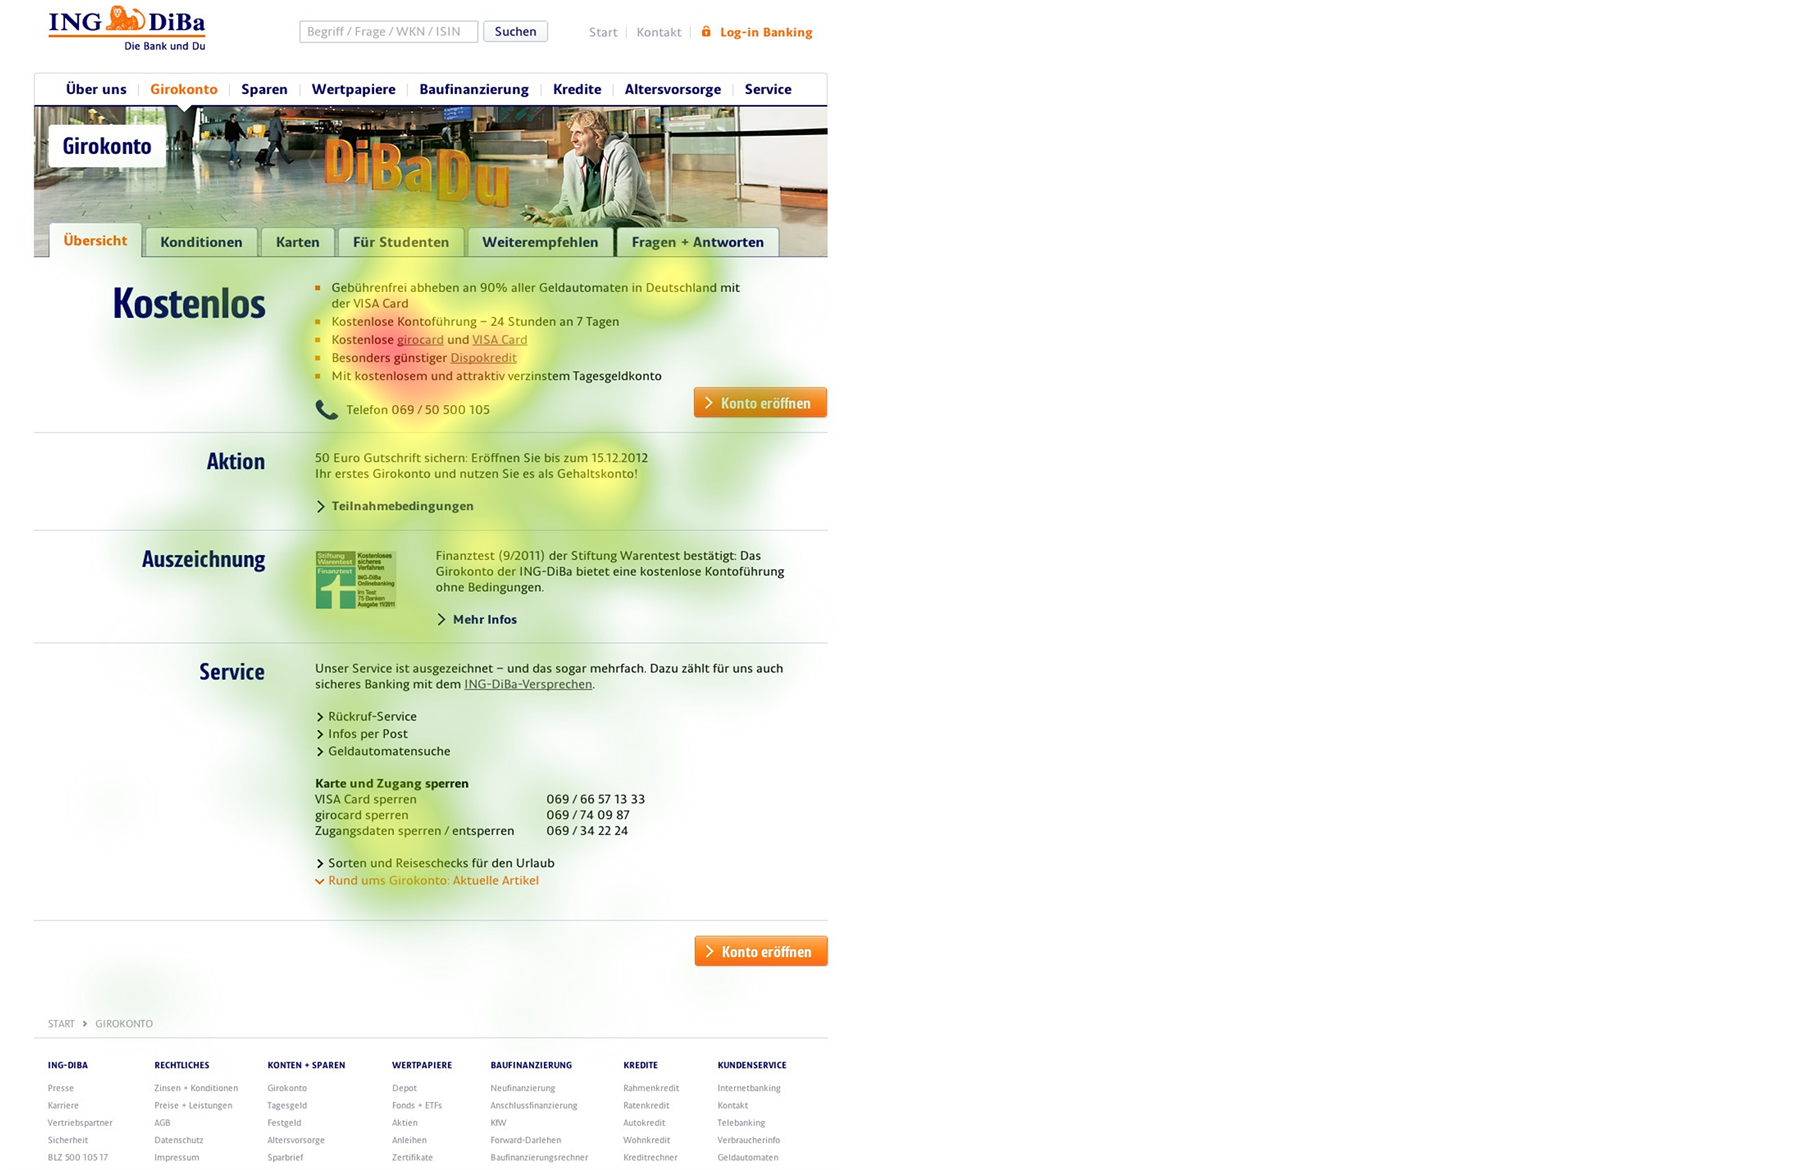
Figure 5. Heat-map of the INGDiBa landing page. Highest fixation is documented as red spot.
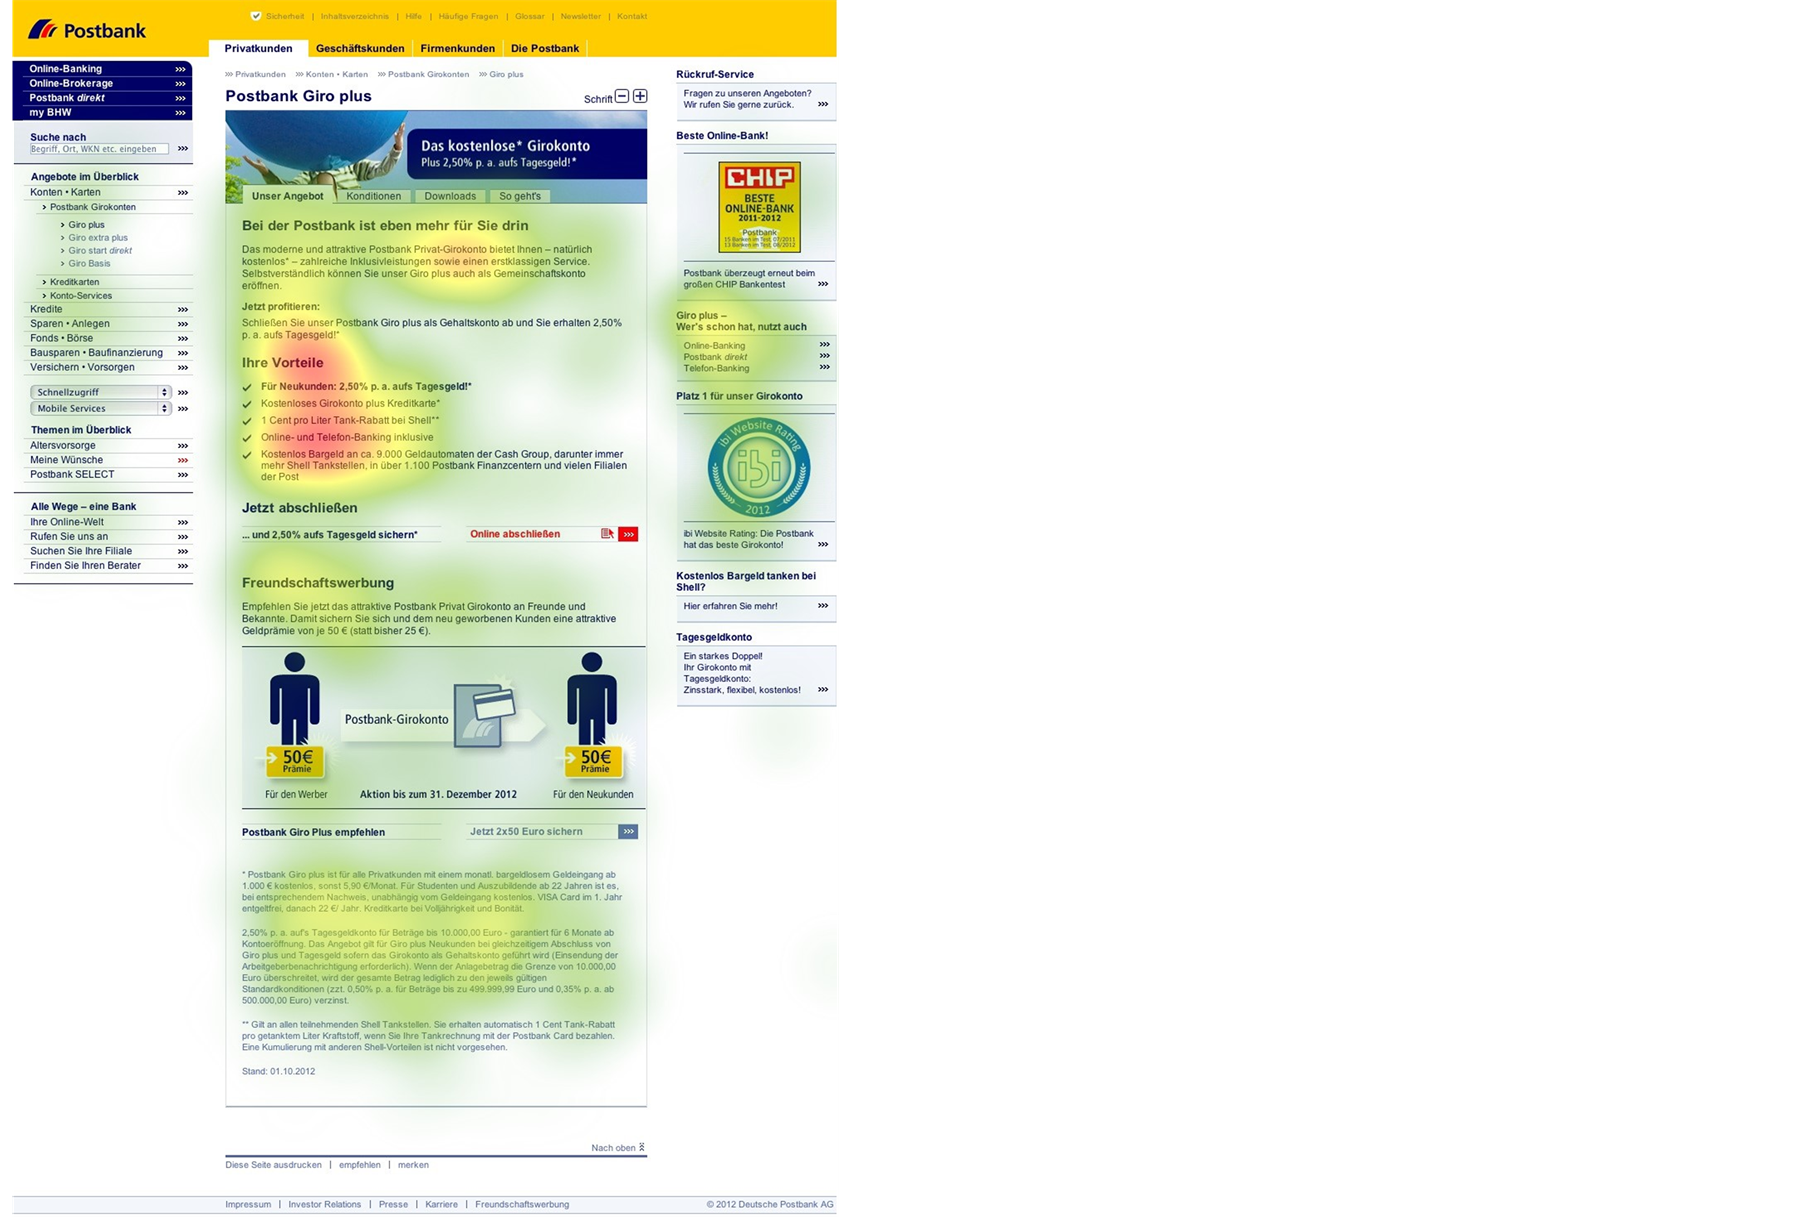
Figure 6. Heat-map of the Postbank landing page. Highest fixation is documented as red spot.
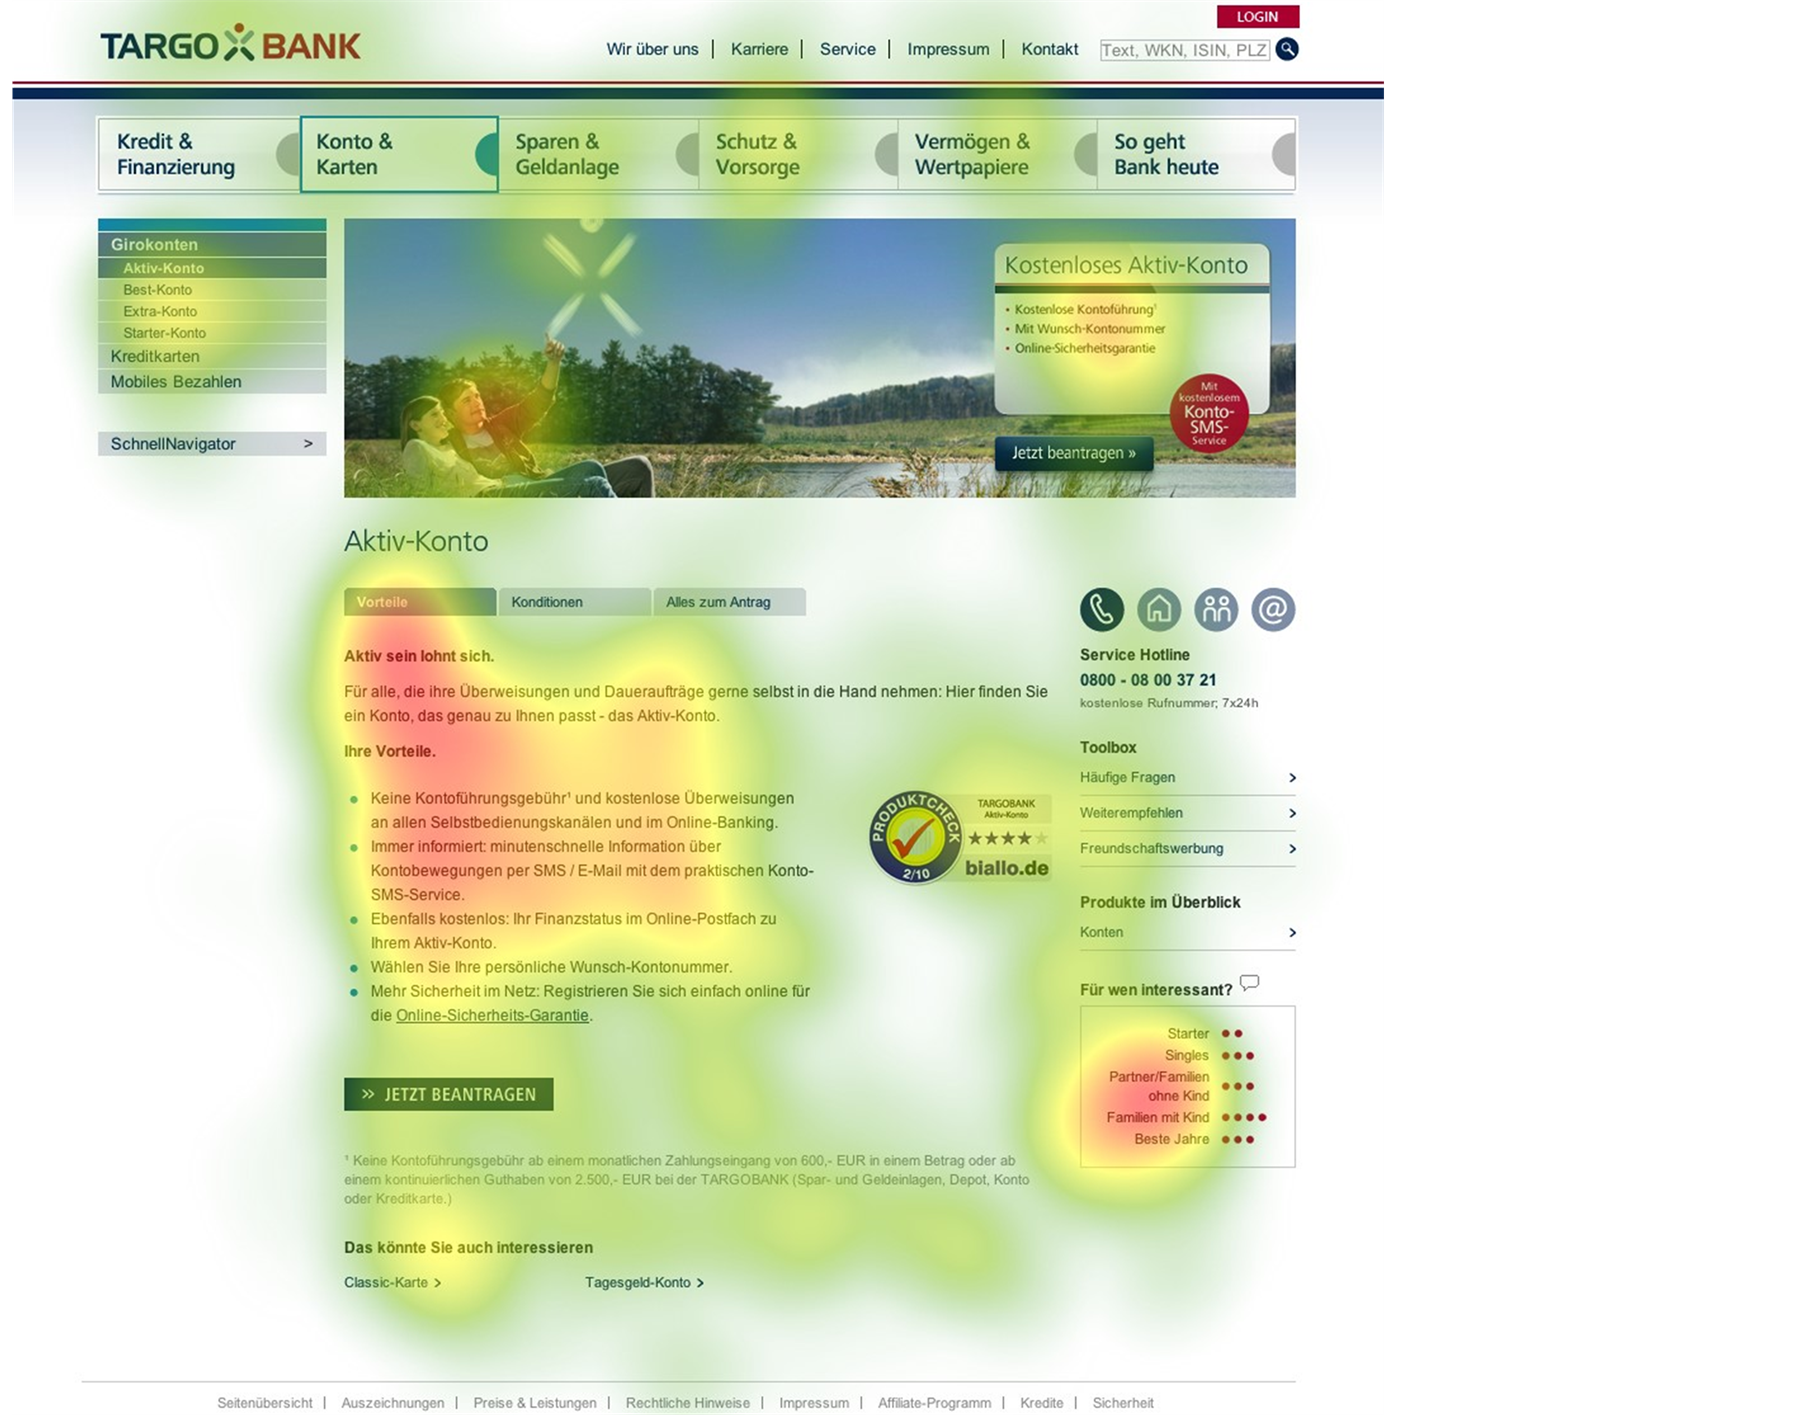
Figure 7. Head-map of the Targo-Bank landing page. Highest fixation is documented as red spot.

Table 1. Time in seconds to first awareness of particular predefined region of interest.
Home page n = 10
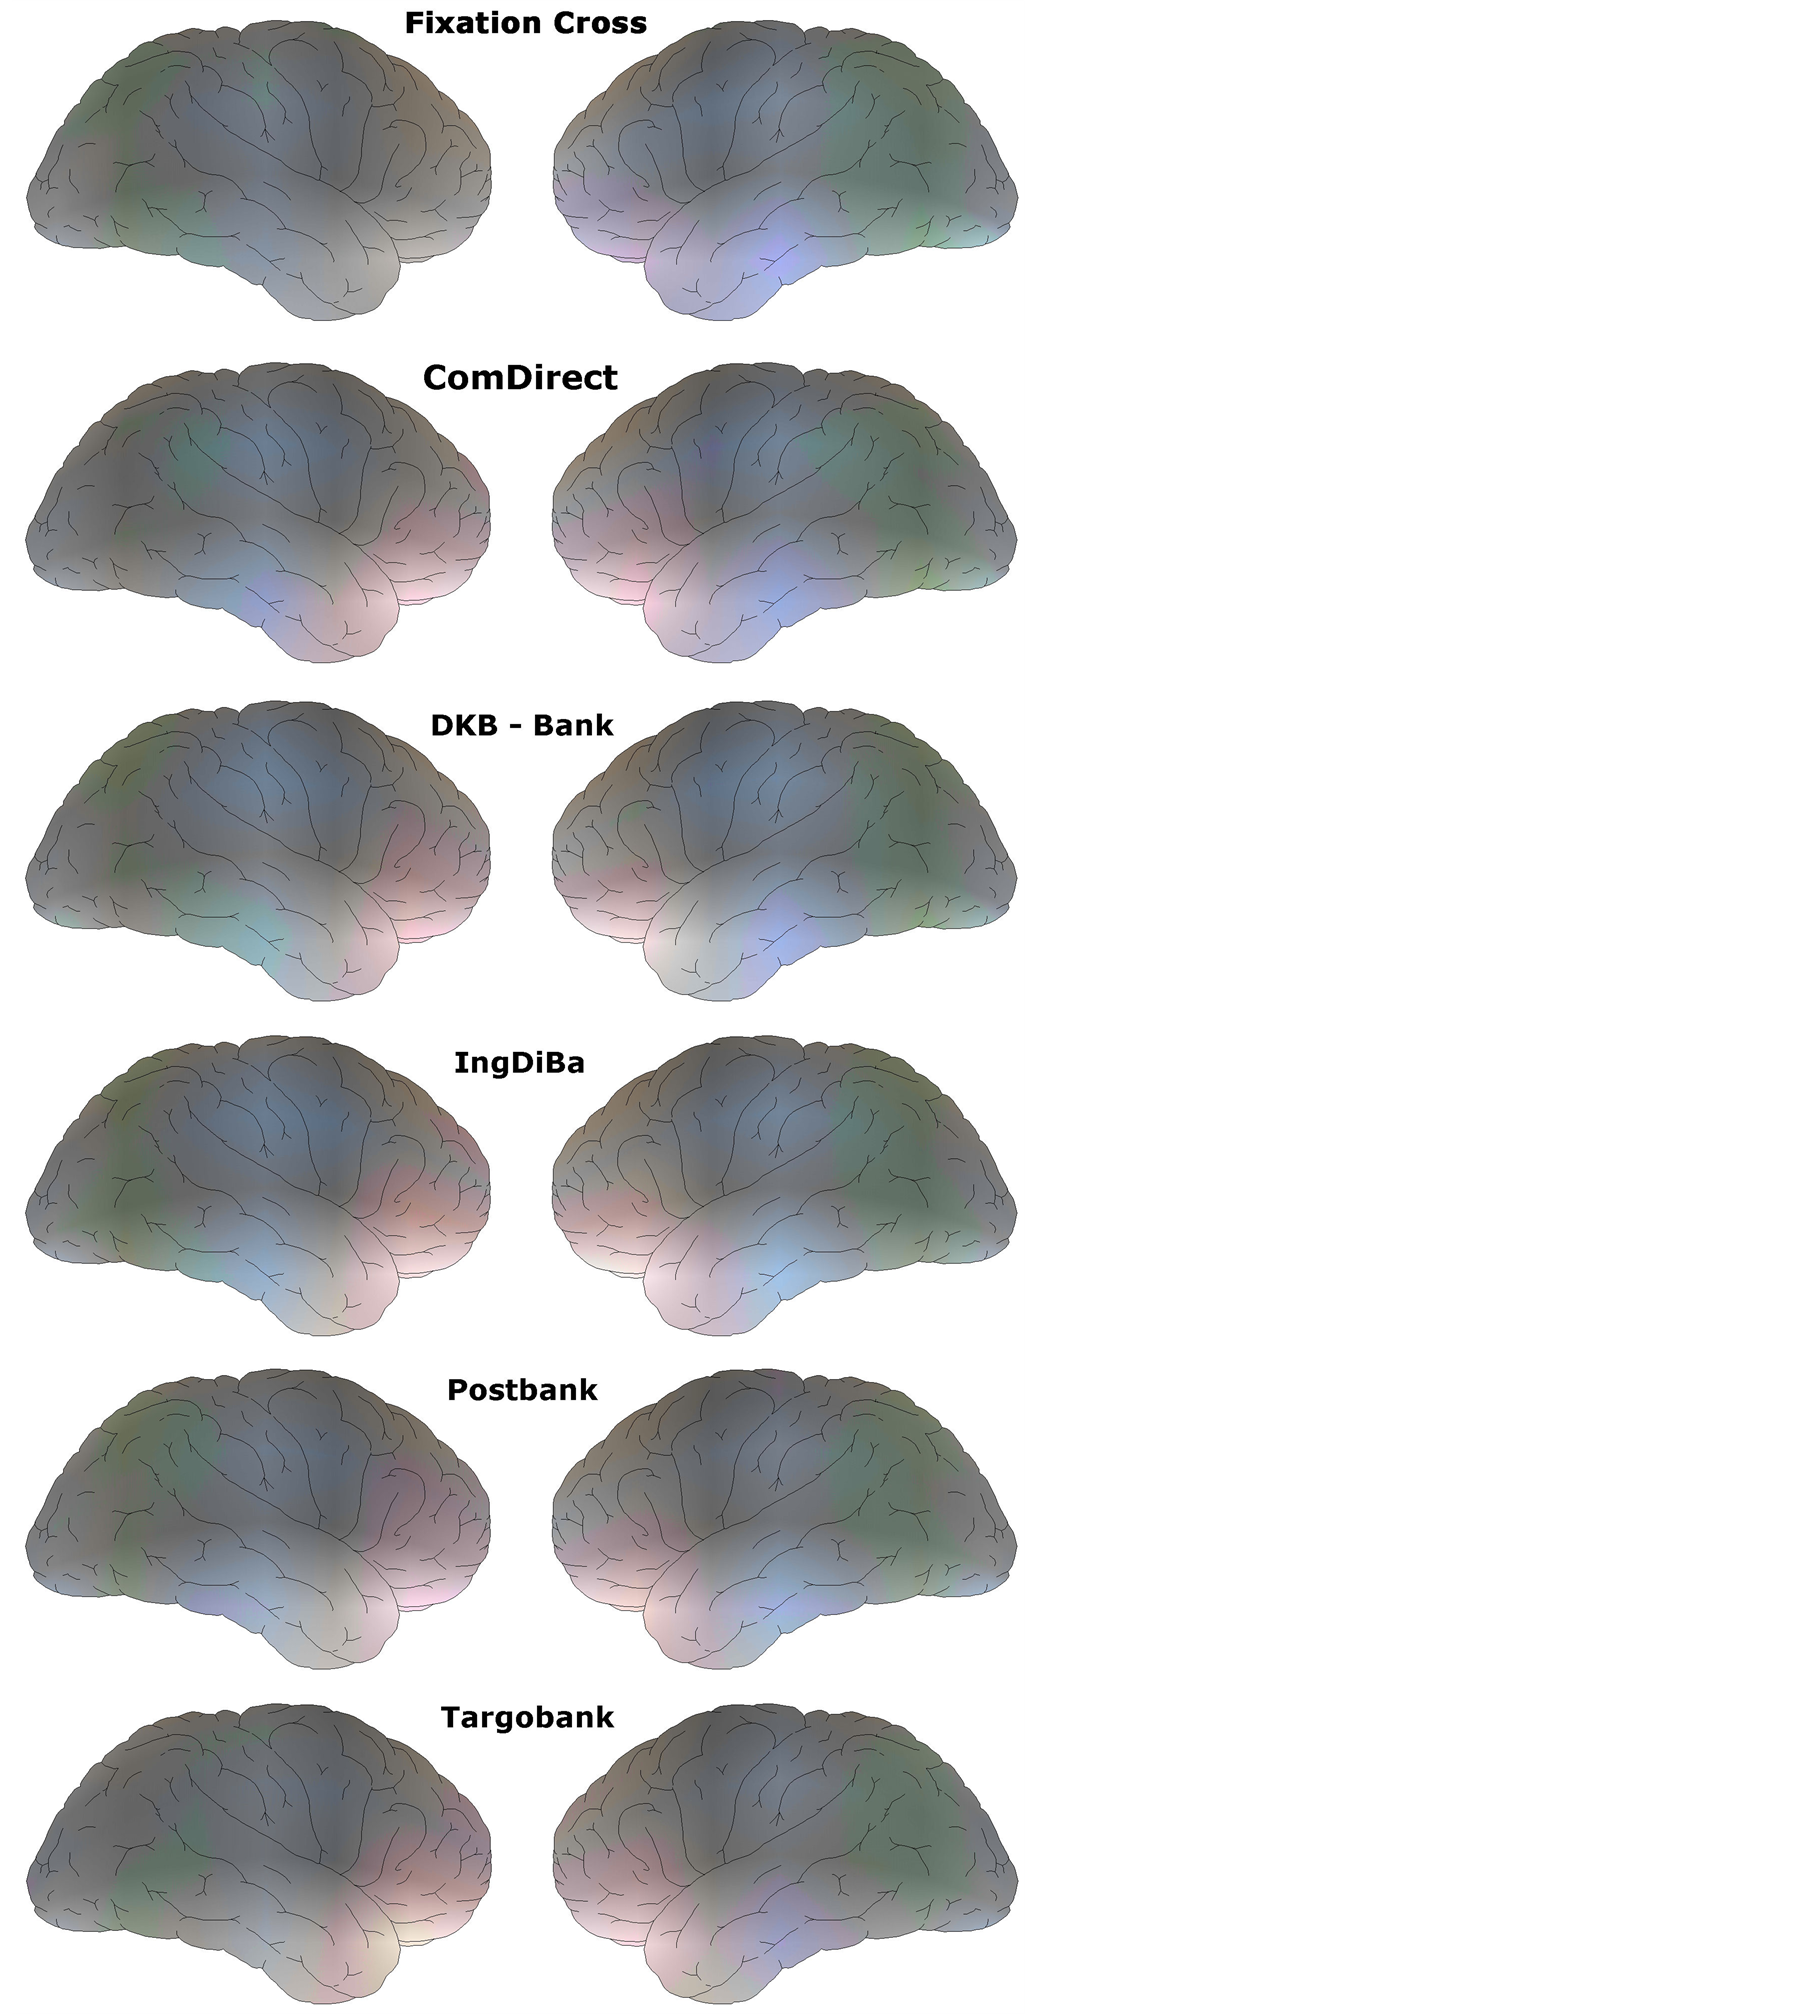
Figure 8. Functional electric brain maps derived from Neurocode-Tracking reflecting focal enhancement of frontal slow waves indicating mental activation when visiting the landing page of five different ban institutions. The more of red enlightening the higher the activation (frontal brain in the middle).
fronto-temporal brain areas as depicted by the enkephaloglyph in Figure 9.
Likewise tension can be followed by development of beta2 power within the temporal lobe. A representative example is given in Figure 10. These enkephaloglyphs are single momentary shots of 364 ms duration. However, in order to quantify these cognitive and emotional parameters for evaluation of single websites data have to be averaged over time (i.e. for 1 minute with regard to the landing pages of the 5 banks. Numeric results for all five bank portals are summarized in Table2 In comparison to electric power during fixation of a fixation cross
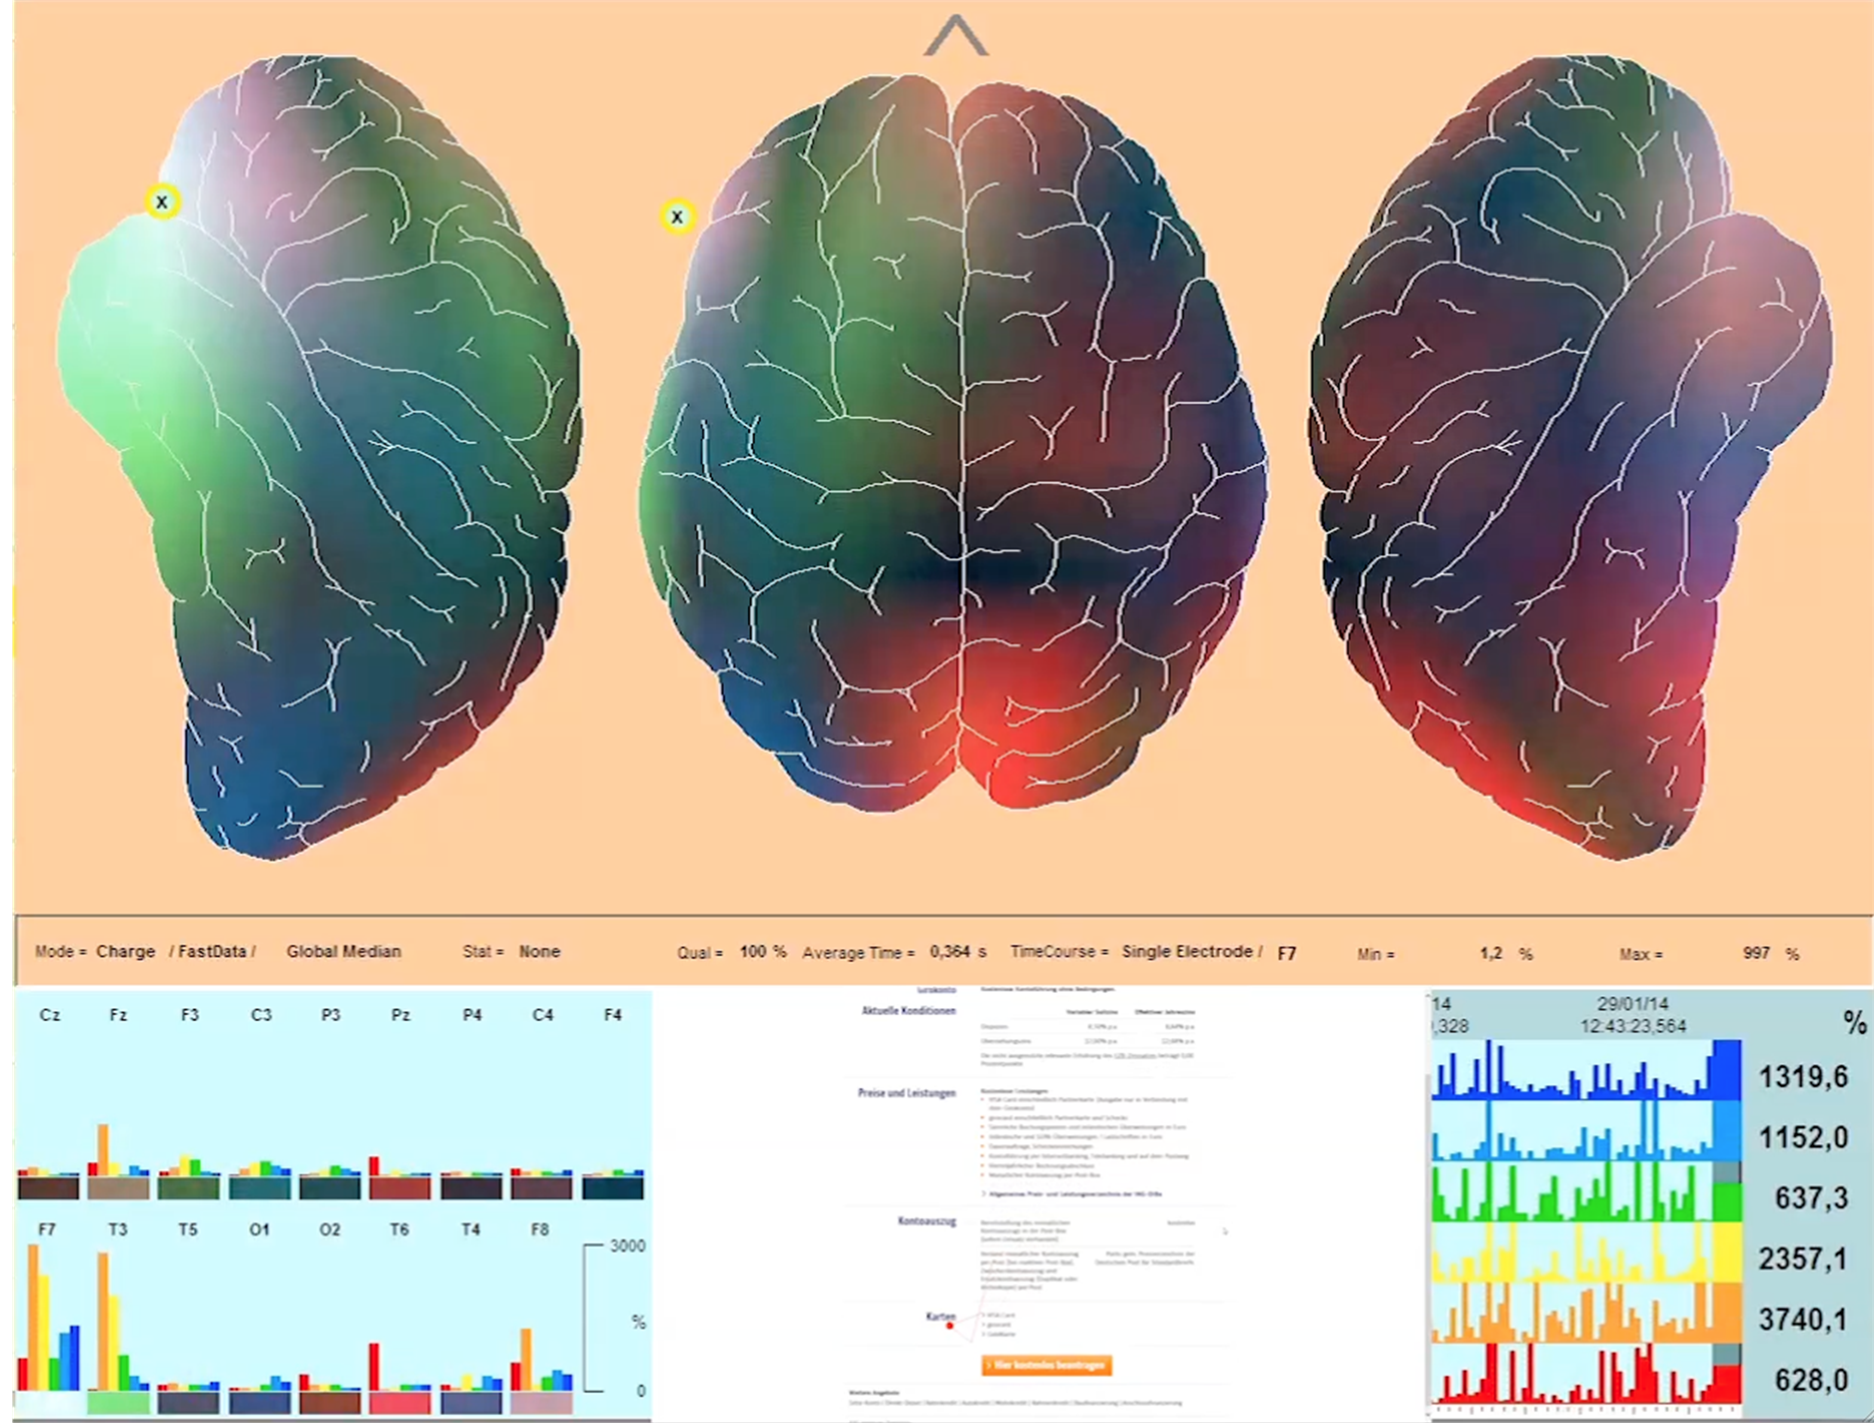
Figure 9. Enkephaloglyph showing very high focal theta power (orange) in fronto-temporal brain region as indicator of high concentration of a subject during Internet surfing. Glance according to Eye-Tracking is fixed on the topic “accounts” (small red spot at lower middle image). For more details please see Figure 2.
visiting the websites revealed considerably and statistically significant higher values. Best values with respect to all parameters except for memory processing were measured for the visit of INGDiBa.
Finally, a questionnaire consisting of 6 questions was filled out regarding subjective impressions after having finished Internet surfing. Except for the question regarding confidence, which was chosen by 50% of the visitors in favour of the Postbank, all other questions showed ComDirect and INGDiBa in the two first places. Results are depicted in Table3 Last place was given the Targo-Bank.
4. Discussion
Since the Internet has entered our daily life presentation of websites becomes more and more important. However, the question arises how the content of the website can be presented in the most effective way. Besides the content also structure of the websites obviously plays a major role. One of the most interesting questions is therefore the objective assessment of newly created webpages. Up to now predominantly subjective evaluation is the major road in order to assess the design and many companies offer help in this respect. The present study aimed at objective assessment within a pilot project making use of a combination of two high tech approaches, namely Eye-Tracking and Neurocode-Tracking (based on fast dynamic quantitative EEG recording) in addition to information taken from a questionnaire. Results from Eye-Tracking revealed clear differences between the start pages of 5 banking institutions. Each bank presented a different focus of attention according to fixation times of the eyes of the visitors. So-called Heat-Maps uncovered particular regions of the page, which draw the strongest attention. By it one is able to compare the intention of the web designer with the successful first line attention. In addition, Eye-Tracking data also revealed shortest time to first awareness with respect to predefined
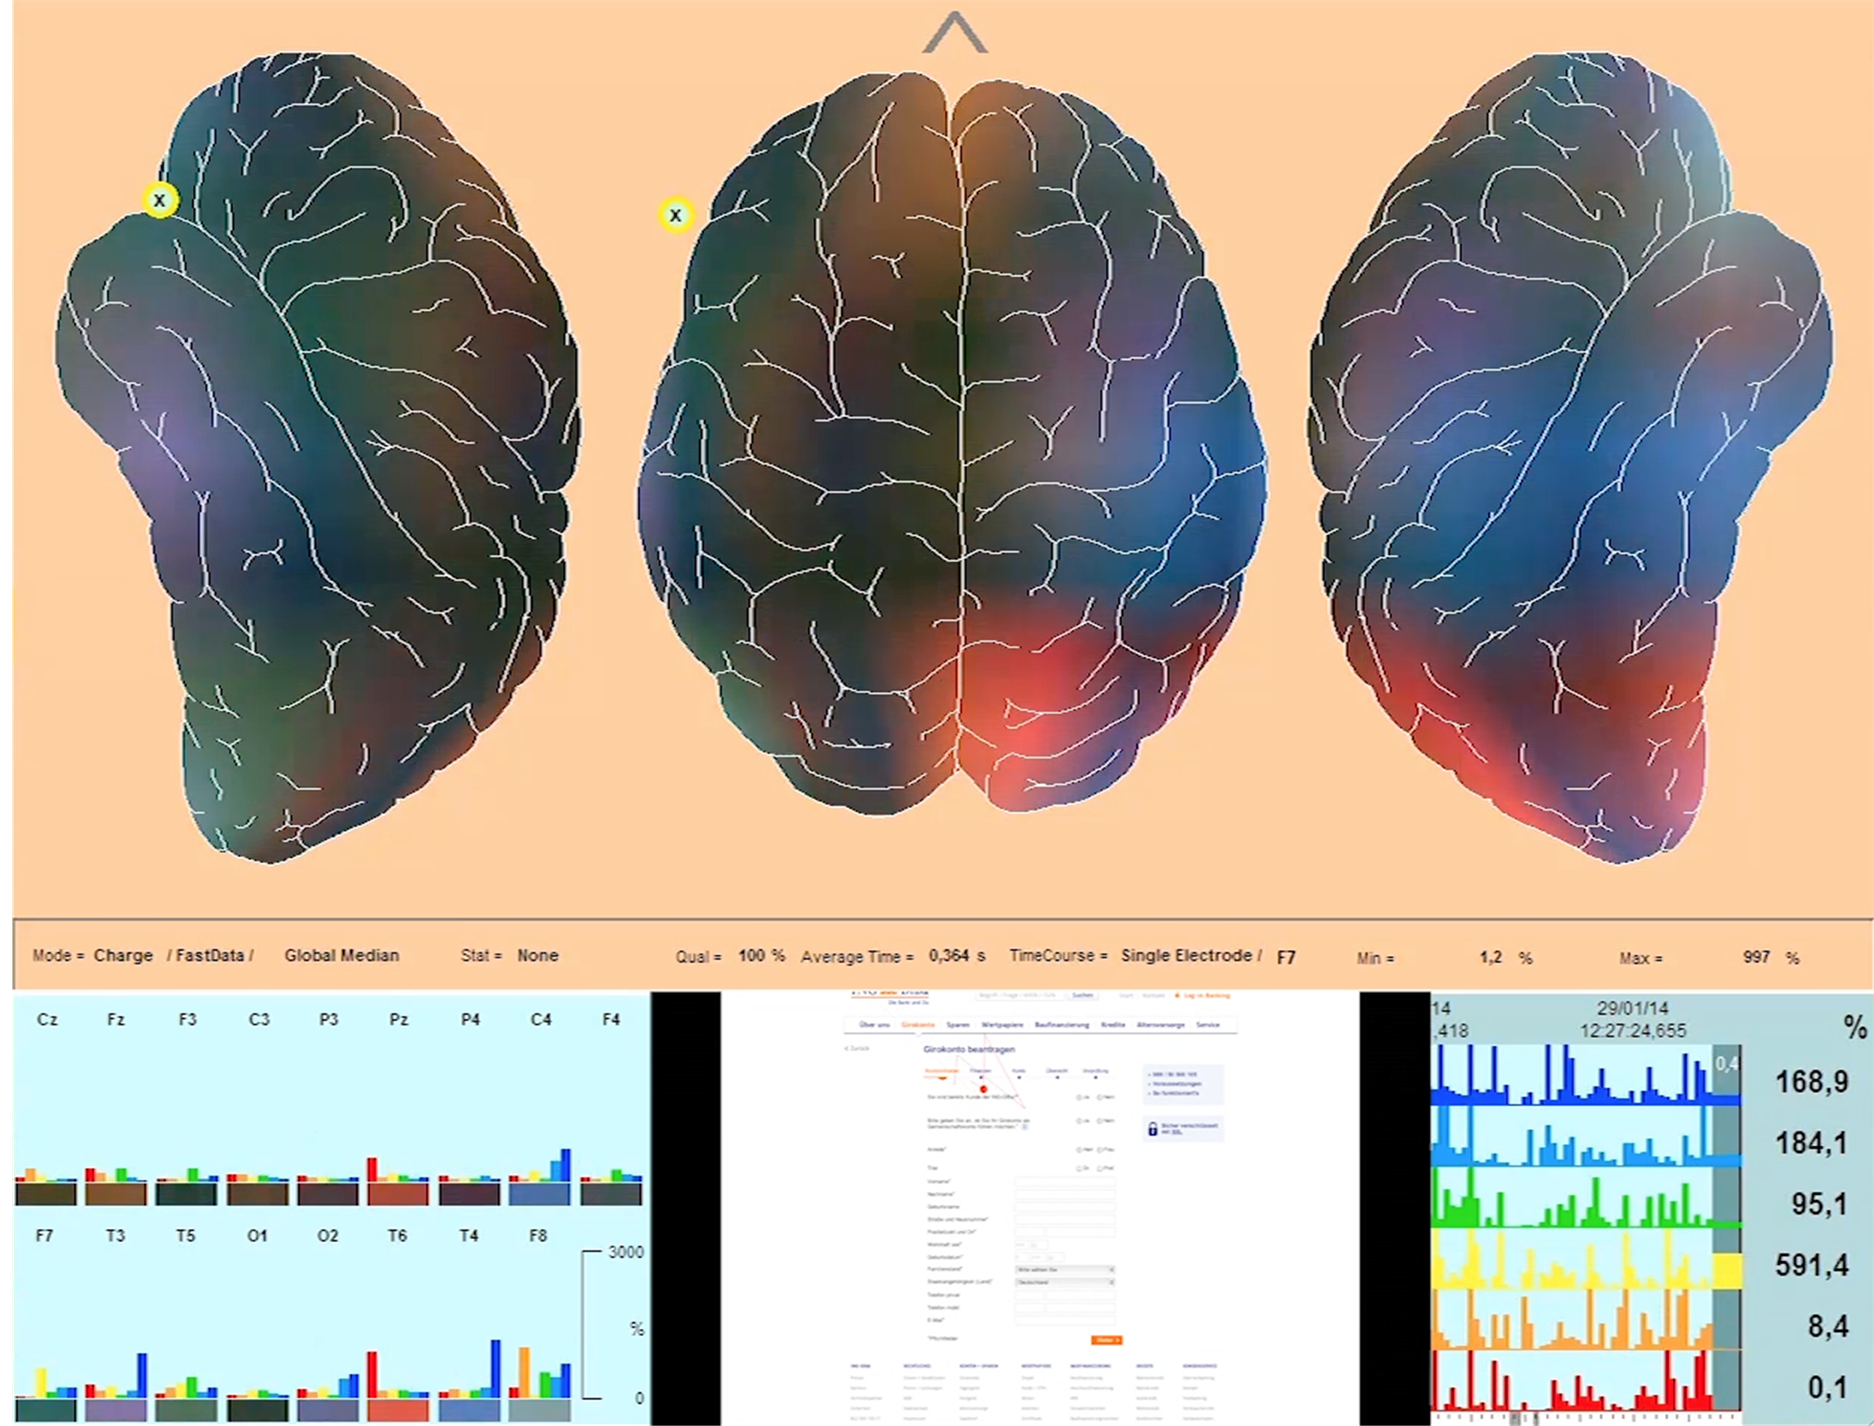
Figure 10. Enkephaloglyph with high values of beta2 electric power (blue bar chart lower left corner and blue spots at the map) as indication of high tension. Glance according to Eye-Tracking is fixing the topic of starting an account (small red spot on image in lower middle part).
Table 2. Results from Neurocode-Tracking showing the intensity of various physiological states as derived from electric power at particular regions and frequencies according to spectral signatures during visit of the landing pages of 5 different banking institutions. The higher the values, the higher is the intensity of the psychological state.
regions of interest. Here, the ComDirect bank and INGDiBa were recognized to have the shortest values for the regions “Konditionen, Geldprämie and Service”. This evaluation was reproduced by Neurocode-Tracking in as much as the website of INGDiBa and of ComDirect produced the maximal mental activation as derived from electric brain mapping showing frontal enhancement of slow waves (red-orange colors in the middle of the maps). Numerical analysis with respect to cognitive activation, visual perception and focused concentration confirmed the leading place of the INGDiBa website. However, with respect to memory and tension Targo-Bank
Table 3 . Result from the questionnaire regarding subjective impressions after finish of the surfing. Number of first choice votes are given for n = 10 subjects.
reached highest values. But we cannot exclude at this point, that the knowledge of the name of the bank might have influenced the results.
One might argue now, that it might be too early to use these psychological terms for quantitative assessment based on electric power development in different regions. But, as published earlier, particular frequencies with defined brain regions can be used as surrogate parameters for example with respect to concentration, where theta power increases indicated high concentration [11] and memory processes [12] . Likewise, alpha2 spectral power has been related to memory processes in the past [13] . Visual perception must be seen in connection with spectral changes within the occipital lobe. Again theta power increases have been identified as a surrogate parameter for this psychological feature. Thus, interpretation of spectral power values within particular brain regions allows for use of psychological terms describing quantitatively behaviour.
Finally, also the result from the questionnaire confirmed the leading position of the ComDirect and INGDiBa bank with respect to web design of their starting page. In summary, this pilot study consisting in the combination of Eye-Tracking and Neurocode-Tracking supplemented by a questionnaire has proven to provide much more information than with any one of the methods used in separate. Future work will show, if this result of the pilot approach can be generalized for use in advertisement research.
Acknowledgements
Mrs. Petra Werling is gratefully acknowledged for her excellent performance of the experiment. Mrs. Leonie Schombert was of great help in producing the documentation of the results. Jürgen Bluhm from Tobii Technology GmbH, Frankfurt, Germany, is greatfully acknowledged for providing the eye track technology for this pilot experiments. Mrs. Keplinger-Dimpfel is acknowledged for taking care of the logistics of the study and performance of the quality control.
Conflict of Interest
There was no conflict of interest.
References
- Dimpfel, W., Wedekind, W. and Keplinger, I. (2003) Gender Difference in Electrical Brain Activity during Presentation of Various Film Excerpts with Different Emotional Content. European Journal of Medical Research, 8, 192-198.
- Dimpfel, W. (2011) Simultaneous Eye Tracking and Fast Dynamic EEG Current Source Density Imaging for Assessment of Commercials or Websites. 16th European Conference on Eye Movements ECEM, Marseille, 21-25 August 2011, 49.
- Dimpfel, W. (2011) Enkephaloglyphen. Spektrale Signaturen der elektrischen Hirntatigkeit als Spiegel der Psyche, Bod Verlag, Norderstedt.
- Dimigen, O., Sommer, W., Hohlfeld, A., Jacobs, A.M. and Kliegl, R. (2011) Co-Registration of Eye Movements and EEG in Natural Reading: Analysis & Review. Journal of Experimental Psychology, 140, 552-572. http://dx.doi.org/10.1037/a0023885
- Dimpfel, W. (2014) Neurophysiological Biomarker of Mild Cognitive Impairment. Advances in Alzheimer’s Disease, 3, 64-77. http://dx.doi.org/10.4236/aad.2014.32008
- Berger, H. (1931) über das Elektroenzephalogramm des Menschen. Dritte Mitteilung. Archiv für Psychiatrie, 94, 16-60. http://dx.doi.org/10.1007/BF01835097
- Jasper, H.H. (1958) The tentwenty electrode system of the International Federation. Electroencephalography and Clinical Neurophysiology, 10, 371-375.
- Dimpfel, W., Hofmann, H.C. (2014) Neurocode-Tracking Based on Quantitative Fast Dynamic EEG Recording in Combination with Eye-Tracking. World Journal of Neuroscience, 4, 106-119.http://dx.doi.org/10.4236/wjns.2014.42013
- Schober, F., Schellenberg, R. and Dimpfel, W. (1995) Reflection of Mental Exercise in the Dynamic Quantitative Topographical EEG. Neuropsychobiology, 31, 9 -112. http://dx.doi.org/10.1159/000119179
- Sachs, L. (1992) Angewandte Statistik: Anwendungstatistischer Methoden.
- Dimpfel, W., Hofmann, H.C., Prohaska, A., Schober, F. and Schellenberg, R. (1996) Source Density Analysis of Functional Topographical EEG: Monitoring of Cognitive Drug Action. European Journal of Medical Research, 1, 283-290.
- Hsieh, L.T. and Rangnath, C. (2014) Frontal Midline Theta Oscillations during Working Memory Maintenance and Episodic Encoding and Retrieval. NeuroImage, 2, 721-729. http://dx.doi.org/10.1016/j.neuroimage.2013.08.003
- Klimesch, W., Doppelmayr, M. and Hanslmayr, S. (2006) Upper Alpha ERD and Absolute Power: Their Meaning for Memory Performance. Progress in Brain Research, 159, 151-165. http://dx.doi.org/10.1016/S0079-6123(06)59010-7