Journal of Behavioral and Brain Science
Vol.4 No.3(2014), Article ID:43703,6 pages DOI:10.4236/jbbs.2014.43015
Factors Determining the Detection Time to Flavor in Healthy Adults
Satomi Miyaoka1, Takako Yamazaki2, Naoko Ito2, Yozo Miyaoka2
1Department of Eating Disorder and Dysphagia, Graduate School of Rehabilitation, Niigata University of Rehabilitation, 2-16 Kaminoyama, Murakami, Japan
2Department of Health and Nutrition, Niigata University of Health and Welfare, 1398 Shimami-cho, Kita-ku, Niigata, Japan
Email: miyaoka@nuhw.ac.jp
Copyright © 2014 by authors and Scientific Research Publishing Inc.
This work is licensed under the Creative Commons Attribution International License (CC BY).
http://creativecommons.org/licenses/by/4.0/


Received 14 January 2014; revised 19 February 2014; accepted 27 February 2014
ABSTRACT
This study analyzed the factors responsible for determining the flavor detection time for chewed semi-solid foods. Thirteen healthy young adults (eight males and five females) were asked to chew gummy candies with five different fruit flavors (i.e., apple, grape, orange, pear, and strawberry) in a random order. The detection time to flavor was measured using an electromyography-based system, which was recently developed by the authors. Briefly, each participant was recorded with surface masseter electromyograms on both sides to determine the start of chewing. Each participant was asked to press a button as soon as possible with his/her preferred hand after detecting the flavor. The time elapsed between the start of chewing and the button press was measured. Two taste components, sugars and organic acids, of the gummy candies were chemically analyzed, and two major sugars and organic acid were individually detected. The odor intensity was also analyzed for the gummy candies. The average detection time significantly differed among the five gummy candies and among the participants. Simple regression analyses revealed that the intensity of the odors was significantly associated with the average time intervals, but the amounts of the two major sugars and the organic acids were not. The analysis yielded the following equation for the regression estimation:  (y = the time interval, x = the intensity of odors). The results suggest that the intensity of odors of the gummy candies, not the taste components, is responsible for determining the flavor detection time.
Keywords:Flavor; Detection Time; Semi-Solid Food; Masseter; Electromyogram; Chewing; Human

1. Introduction
Two major research approaches were used to analyze the temporal aspect of ingestion behavior: reaction time and time-intensity (T-I). Fluids and vapors are used to measure the simple taste and olfactory reaction times, respectively, in the former approach [1] -[7] , while solid and semi-solid foods, fluids, and vapors are used in the latter approach to analyze the entire temporal process of changes in the perceived intensities of taste, odor, and/or flavor (e.g., [8] ). The reaction time approach can be used to precisely determine the detection and recognition time for tastes and odors (or flavor), but the stimuli are usually restricted to fluids (for taste) and vapors (for odor) only. However, the T-I approach can use semi-solid and solid foods as stimuli. Because the approach generally pays little regard to the initial stage of the T-I curves, previous studies just described the stage as “lag-time” or “delay” [8] . Our study considered the advantages and disadvantages of these two approaches and developed a system for measuring the detection and recognition time to flavor using electromyograms (EMGs), which can precisely measure the detection time for flavor and use semi-solid and solid foods [9] . The present study analyzed the taste components and odor intensities of the tested foods and then determined how the factors in the analyzed food properties affected the detection time to flavor (DTF).
2. Materials and Methods
2.1. Participants
Thirteen healthy young adults (eight males and five females, average age 21.7 ± 1.27 years) participated in this study after providing informed consent. The Ethics Committee of The University of Niigata Rehabilitation Graduate School approved the experiments.
2.2. Test Foods
Five gummy candies (GCs; Meiji Co., Ltd., Tokyo, Japan) with different fruit flavors (apple, grape, orange, (European) pear, and strawberry) served as the test foods in the present study. The dimensions of the GCs, including the shapes and sizes, were similar: the approximate height, width, and thickness were 9.5 mm, 23.6 mm, and 15.0 mm, respectively. Each test food was wrapped with a wafer paper (Kokko Oblaat Co., Ltd, Shizuoka, Japan) to prevent direct contact between the food and the oral tissues before the start of chewing. The hardness of the GCs was analyzed with a Texture Profile Unit (TPU-2S, Yamaden Inc., Tokyo, Japan), and the analysis showed that the hardness among the GCs differed significantly (P < 0.005), but only one (apple-vs. orange-flavored) of 10 possible food pairs differed specifically (P < 0.01). The hardness of the GCs was selected from the four properties measured as an index for the textural aspect.
2.3. Procedures
The procedures adopted in this study were basically identical to those in a preceding paper [9] . The following procedures were followed: 1) each participant was asked to rinse his/her mouth with water and to sit comfortably on a chair; 2) surface electromyograms (EMGs) were recorded from the masseter (Mass) muscles on both sides, and the Mass EMG signals were amplified, filtered (bandwidth, 15 Hz - 3 kHz), fully rectified, and stored on a digital recorder; 3) two pressing buttons, one in each hand, were held by each participant, and the buttons were connected to the recorder through a battery; 4) the participant was asked press the button with the hand instructed by the experimenter as soon as possible when he/she detected any flavor of the delivered test food; 5) each participant was asked to ingest a wrapped test food, which was randomly selected from the five GCs, and to hold it between the molars on his/her habitual chewing side until the delivery of a command for the start of chewing; and finally; 6) one button was activated by the participant after detecting flavor. Prior to the delivery, no information about the test foods, including their taste, odor, and flavor, was provided to the participant. Each experimental session consisted of three trials with at least four min between the trials, and a total of 65 trials were performed in this study.
2.4. Chemical Properties of GCs
Two chemical properties, taste and odor, of the GCs were analyzed to examine relative contribution of their properties to the DTF recorded in this study. The methods used for the analyses (except for the odor aspect) were described in our previous paper [9] . The combined amounts of two major sugars (sucrose and maltose) and two major organic acids (citric and malic acids) were used as indices for the taste aspects. The odor intensities of the GCs were measured with a portable device (XP-329IIIR, New Cosmos Electric Co., Ltd., Osaka, Japan), which uses an indium oxide-based sensitivity hot wire semiconductor sensor, for various odors and odor components. Each GC was packed in a container connected to the device through a Teflon® tube, and then air in the container was suctioned to absorb the odorants to the semiconductor sensor (high sensitive iridium oxide type) of the device. The used sensor provided the intensity of each odor, not the quality.
2.5. Data and Statistical Analyses
As demonstrated in our preceding paper [9] , the participants’ chewing sides (habitual working and non-working) do not significantly affect DTF. In this study, the DTF in each participant was measured in his/her habitual working side. Thus, DTF was considered to be the time elapsed between the start of Mass EMG on the habitual working side and activating the odor detection button.
Two statistical methods, analysis of variance (ANOVA) and regression analysis, were used in this study. First, two-way ANOVA with “test food” and “participant” as factors were applied to the DTF data, and the ANOVA was followed by Tukey’s multiple comparison test to detect the specific differences. One-way ANOVA by the multiple comparison test was applied to data of food properties to test the average differences among the GCs for 1) the amounts of the major two sugars, 2) the amounts of the major two organic acids, and 3) the odor intensity. Second, both multiple and simple regression analyses were applied to the DTF data, which were designated as the dependent variable, and to the food property data, which were designated as the independent variables for multiple regression analysis and as one of the independent variables for simple regression analysis. Parietal correlation coefficients (beta) of independent DTF variables were calculated, and the equation for regression estimation was set up when any significant regressions were found. P < 0.05 was considered to be significant in all statistical examinations.
3. Results
Figure 1 shows the averages DTF values for the five GCs that were delivered to the participants. The DTF for the pear-flavored GC was much longer than those for the other four GCs and approximately 140% of that for the strawberry-flavored GC, which had the shortest DTF. Two-way ANOVA detected significant differences in the DTF values among the five GCs (P < 0.05) and among the participants (P < 0.001). In addition, Tukey’s multiple comparison test found two specific DTF differences between the strawberryand pear-flavored GCs and also between the orangeand pear-flavored GCs (Ps < 0.05). Multiple comparison analysis identified significant and specific differences between 16 pairs participant pairs (Ps < 0.01 in two participant pairs and Ps < 0.05 in 14 participant pairs).
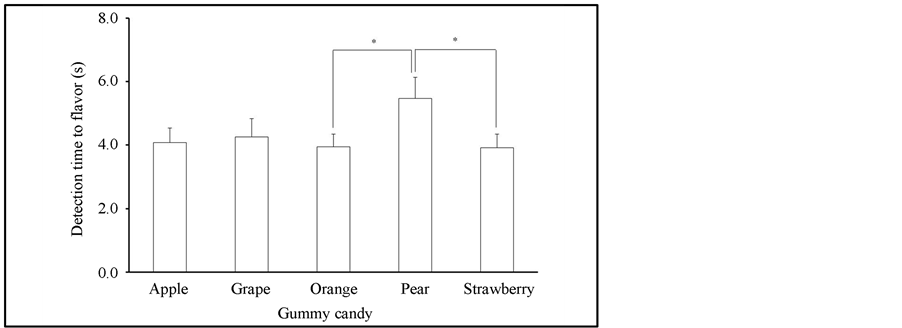
Figure 1. Averages of detection time to flavor in five gummy candies used. “Apple”, “Grape”, “Orange”, “Pear”, and “Strawberry” indicate apple-, grape-, orangepear-, and strawberry-flavored gummy candies, respectively. The values present the means + S.E.M. *P < 0.05.
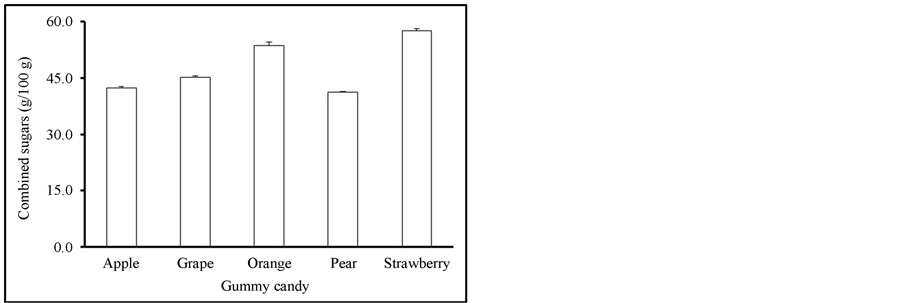
Figure 2 summarizes the average amounts of the major two sugars (i.e., sucrose and maltose; Figure 2(a)) and those of the major two organic acids (citric and malic acids; Figure 2(b)) in the five GCs. The major two sugars accounted for 73.3% of the five sugars detected, and the major two organic acids accounted for 94.7% of the four organic acids detected. One-way ANOVA detected significant differences in these taste components among the five GCs (Ps < 0.001), and Tukey’s multiple comparison test detected significant differences in all 10 pairs of the GCs, except for one in the major two sugars (apple-vs. pear-flavored GCs) and two in the major two organic acids (applevs. grape-flavored and grapevs. strawberry-flavored GCs). Figure 3 shows the average odor intensities in the five GCs. ANOVA detected significant differences in these food properties among the five GCs (P < 0.001), and the multiple comparison test found significant differences (Ps < 0.001) in all 10 pairs, except for three (applevs. orange-, applevs. strawberry-, and orangevs. strawberry-flavored GCs).
The calculated multiple regression correlation coefficient (R) was low (0.2912), and none of the three independent variables (major two sugars, major two organic acids, and intensity of odor) showed significant regressions for the dependent variable, DTF. Three simple regression analyses revealed that the intensity of odor of the GCs showed significant regression (P < 0.05), but the amounts of the two major sugars and two major organic acids did not. The parietal correlation coefficient (beta) between the intensity of odor and DTF was 0.2918 (P < 0.05). The following regression estimation equation was used:
 where y was the dependent variable of DTF, and x was the independent variable of the intensity of odor.
4. Discussion
Our preceding study reported a method to measure the detection time to semi-solid (and solid) foods using Mass EMGs; this method detects the start of chewing the test food (GC) [9] . This study used three GCs (grape-, lemon-, and pineapple-flavored) as the test foods and found no significant differences in DTF among the GCs. The present study applied the method to evaluate the relative contribution of food properties to DTF by increasing the number of test foods from three to five, with different tastes and odors. The longest average DTF for pear-flavored GC was approximately 40% longer than the shortest one for strawberry-flavored GC (Figure 1), in alignment with the preceding study (see Figure 2 in [9] ). Two major sugars (Figure 2(a)) and the major two organic acids (Figure 2(b)) differed among the five GCs, which suggests that the used test foods presented different tastes to the participants. The odor intensity also differed among the GCs (Figure 3). These results strongly suggest that the taste and odor of the tested GCs and not merely the products names were ‘different’ for the participants of this study.
The performed regression analyses revealed that the intensity of odor rather than the amounts of sugars and organic acids affected the observed DTF. After the experiment, one participants stated that “The odor of
 (a)
(a)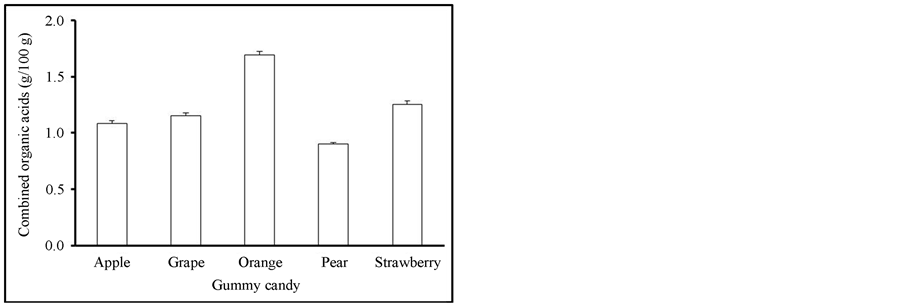 (b)
(b)
Figure 2. Average amounts of taste components in five gummy candies used. (a) and (b): Average amounts of the major two sugars, sucrose an maltose (in (a)) and those of the major two organic acids, citric and malic acids (in (b)). “Apple”, “Grape”, “Orange”, “Pear”, and “Strawberry” indicate apple-, grape-, orangepear-, and strawberry-flavored gummy candies, respectively. The values present the means + S.E.M. Asterisks for statistically significant differences are omitted for clarity. See the text for details.
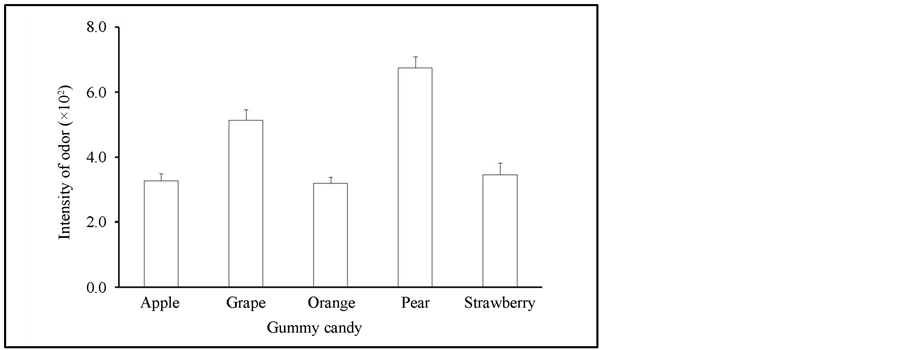
Figure 3. Average intensity of odors in five gummy candies used. “Apple”, “Grape”, “Orange”, “Pear”, and “Strawberry” indicate apple-, grape-, orangepear-, and strawberry-flavored gummy candies, respectively. The values present the means + S.E.M. Asterisks for statistically significant differences are omitted for clarity. See the text for details.
each candy was the best cue for detecting what candy was in the mouth.” This statement likely supports the results of the regression analyses. In the present study, the used GC was wrapped individually and held between the molars for preventing leak of odor before the start of chewing. Consequently, this experimental situation strongly suggests that the odor would be sensed primarily using the “retronasal” approach. In addition, the calculated equation for regression estimation, y = 2.674 + 0.398x, suggests that DTF would have an approximately three seconds (exactly 2.674 seconds) latency for detecting the test food’s flavor. The latency time may attribute to a mechanical stage of stimulation, during which the GC in the mouth is destroyed by the molars, and the taste and odor components contained are emitted from the destroyed GC [9] . The approximately three-second latency appears to be longer than our expectation, but the time is similar to the “delay” or the “lag-time” that was documented in a review for the time-intensity analysis [10] . In this analytical technique, panels participated often respond to the delivered test food a few seconds following the delivery, and time-intensity researchers label the time as the “delay” or the “lag-time”. Generally, it may require a few seconds to detect taste, odor, and/or flavor by eating semi-solid foods, such as the GC used in this study.
The present study used combined amounts of the major two sugars (sucrose and maltose) and two organic acids (citric and malic acids) for the regression analyses. The combined amounts of the sugars and that of the organic acids clearly differed among the five GCs (Figures 2 and 3). These results suggest that the participants would sense different tastes from the five GCs. However, the regression analyses did not show significant parietal correlation coefficients for these two taste components in the DTF of the tested GC. Thus, the present study suggests that the odor intensity positively affects the flavor detection speed and the taste components negatively affect that speed. Differences in the GC stimuli (i.e., vapor for odor and fluid for taste) may explain the differential contribution of these two stimuli. After the molars destroy the GCs, odor vapors contained in the GCs are emitted to the oral and nasal cavities and before reaching the nasal cells via the “retronasal” approach, while fluid with tastes in the GCs are diffused in the oral cavity, mixed with saliva, and then reach the taste cells. Differences in the time required traveling between the nasal and taste cells may affect the different contributions of the two stimuli (odor and taste).
5. Conclusion
In conclusion, the odor intensity, not the taste component, determines the flavor detection time in healthy adults, at least for gummy candies.
Acknowledgements
This study was partially supported by Grants-in-Aid for Scientific Research from the Ministry of Education, Science and Culture of Japan (No. 23700889 to TY and No. 22500740 to YM).
References
- Lester, B. and Halpern, B.P. (1979) Effect of Stimulus Presentation Duration on Gustatory Reaction Time. Physiological Behaviour, 22, 319-324. http://dx.doi.org/10.1016/0031-9384(79)90093-3
- Yamamoto, T. and Kawamura, Y. (1981) Gustatory Reaction Time in Human Adults. Physiological Behaviour, 26, 715-719. http://dx.doi.org/10.1016/0031-9384(81)90149-9
- Yamamoto, T., Kato, T., Matsuo, R., Araie, N., Azuma, S. and Kawamura, Y. (1982) Gustatory Reaction Time under Variable Stimulus Parameters in Human Adults. Physiological Behaviour, 29, 79-84. http://dx.doi.org/10.1016/0031-9384(82)90369-9
- Kelling, S.T. and Halpern, B.P. (1983) Taste Flashes: Reaction Times, Intensity, and Quality. Science, 219, 412-414. http://dx.doi.org/10.1126/science.6849142
- Halpern, B.P. (1986) Constraints Imposed on Taste Physiology by Human Taste Reaction Time Data. Neuroscience & Biobehavioral Reviews, 10, 135-151. http://dx.doi.org/10.1016/0149-7634(86)90024-2
- Bujas, Z., Szabo, S., Ajdukovic, D. and Mayer, D. (1989) Individual Gustatory Reaction Times to Various Groups of Chemicals That Provoke Basic Taste Qualities. Percept Psychophysics, 45, 385-390. http://dx.doi.org/10.3758/BF03210710
- Bujas, Z., Szabo, S., Ajdukovic, D. and Mayer, D. (1991) Interaction between Stimuli with Different Taste Qualities Evaluated by Reaction Time. Journal of Experimental Psychology: Human Perception and Performance, 17, 1120- 1126. http://dx.doi.org/10.1037/0096-1523.17.4.1120
- Pangborn, R.M. and Koyasako, A. (1981) Time-Course of Viscosity, Sweetness and Flavor in Chocolate Desserts. Journal of Texture Studies, 12, 141-150. http://dx.doi.org/10.1111/j.1745-4603.1981.tb01228.x
- Miyaoka, S. and Miyaoka, Y. (2013) An Electromyography-Based System for Measuring the Flavor Detection Time in Healthy Adults. Journal of Brain Behaviour Science, 3, 581-583. http://dx.doi.org/10.4236/jbbs.2013.38061
- Lee, W.E. and Pangborn, R.M. (1986) Time-Intensity: The Temporal Aspects of Sensory Perception. Food Technology, 40, 71-82.