Journal of Behavioral and Brain Science
Vol.3 No.2(2013), Article ID:31543,11 pages DOI:10.4236/jbbs.2013.32017
Deficits in Magnocellular Pathway in Developmental Dyslexia: A Functional Magnetic Resonance Imaging-Electroencephalography Study
1Department of Developmental Disorders, National Institute of Mental Health, National Center of Neurology and Psychiatry (NCNP), Tokyo, Japan
2Department of Pediatrics, St. Marianna University School of Medicine, Kanagawa, Japan
3Research Fellow of the Japan Society for the Promotion of Science, Tokyo, Japan
4Integrative Brain Imaging Center, National Center of Neurology and Psychiatry (NCNP), Tokyo, Japan
Email: hyamamoto@ncnp.go.jp, kitay@ncnp.go.jp
Copyright © 2013 Hisako Yamamoto et al. This is an open access article distributed under the Creative Commons Attribution License, which permits unrestricted use, distribution, and reproduction in any medium, provided the original work is properly cited.
Received February 19, 2013; revised March 27, 2013; accepted May 4, 2013
Keywords: Developmental Dyslexia; Simultaneous Functional MRI-EEG; Visual Evoked Potential; Magnocellular Deficit Theory; Magnocellular Pathway
ABSTRACT
Background: Magnocellular deficit theory is among the different hypotheses that have been proposed to explain the pathophysiology of developmental dyslexia (DD). Dysfunction of the magnocellular system in DD has been investigated using mainly visual evoked potentials (VEPs), particularly transient VEPs, although recently abnormal steadystate VEPs have also been reported. The brain regions responsible for the abnormal VEPs in DD have yet to be elucidated, however. In this study, we performed functional magnetic resonance imaging and electroencephalography (fMRI-EEG) simultaneously to elucidate the brain areas that were found in a previous study to be activated through stimulation of the magnocellular system, and then investigated the mechanism involved in the dysfunction seen in DD. Methods: Subjects were 20 healthy individuals (TYP group; 13 men, 7 women; mean ± standard deviation age, 26.3 ± 5.53 years) and 2 men with DD (aged 42 and 30 years). Images of brain activity were acquired with 3-Tesla MRI while the viewing the reversal of low-spatial frequency and low-contrast black-and-white sinusoidal gratings. EEG was recorded concurrently to obtain steady-state VEPs. Results: Stimulus frequency-dependent VEPs were observed in the posterior region of the brain in the TYP group; however, VEP amplitudes in both DD patients were clearly smaller than those in TYP. fMRI images revealed that both the primary and secondary visual cortices were activated by black-andwhite sinusoidal gratings in the TYP group, whereas activity in the visual cortex overall was reduced in both DD patients. Conclusions: Present low spatial and high reversal frequency visual stimuli activated the primary visual cortex presumably through predominant activation of the magnocellular pathway. This finding indicates that some cases of adult patients of DD involve impairment of the visual magnocellular system.
1. Introduction
Developmental dyslexia (DD) is a developmental reading and writing disorder in children. The characteristics of DD patients are a normal range of intelligence, no problems associated with learning environments or motivation for learning, no impairment of the peripheral sensory organs, and yet difficulties in reading and writing [1,2]. The pathology of DD has yet to be elucidated, although it is thought to be caused by impairment of the central nervous system involved in reading, as seen in adult alexia [3]. In alphabet-speaking countries, the phonological deficit theory is the most widely accepted theory for the pathophysiology of DD. However, the magnocellular deficit theory, which involves the visual information processing pathway, has also been attracting attention. Similarly in Japan, several theories have been proposed for the pathology of DD [4].
In general, the visual information processing pathway is divided into the magnocellular (dorsal) pathway and the parvocellular (ventral) pathway. The former is involved mainly in the perception of moving objects and the processing of spatial information, and the latter in the perception and processing of detailed sensory information including the texture and color of objects. Psychophysical, electrophysiological, and functional brain imaging studies employing visual stimulation such as a checkerboard, gratings, and moving dots have been conducted to investigate the magnocellular pathway.
Dysfunction of the magnocellular system in DD has been investigated primarily using visual evoked potentials (VEPs) in electrophysiological studies. Transient VEPs in response to a checkerboard or sinusoidal pattern are characterized by a delay in the N75 and P100 latency and/or a reduction in the N75-P100 amplitude [5-7]. Recently, focusing on the contrast sensitivity of the magnocellular system, Vaegan and Hollows recorded steadystate VEPs (ssVEPs) towards black-and-white sinusoidal gratings generated at low spatial and high reversal frequency and low contrast settings and demonstrated that, compared with normal individuals, some DD patients had poorer contrast sensitivity [8]. However, dysfunction of the magnocelluar system in DD has rarely been investigated using functional magnetic resonance imaging (fMRI), and no studies have used the stimulation identical or even similar to that used by Vaegan and Hollows. It is therefore unclear whether the reduced VEP amplitude seen in the DD group originated from the magnocellular pathway deficit or an incomplete synchronization of VEP responses.
A number of fMRI studies have investigated the source of VEPs, and in studies reporting on transient VEPs, the major waveforms of VEP like N75 and P100 were derived from the primary visual cortex (V1) [9-11]. However, it was not clear if these waveforms were derived via the magnocellular pathway, parvocellular pathway, or both. The brain area responsible for ssVEPs has also been investigated. For example, a positron emission tomography study by Pastor et al. has shown that V1 was the source of ssVEPs generated in response to flicker stimuli [12], while it is concluded that the lateral geniculate nucleus (LGN), V1, and the secondary visual cortex (V2) were the source of checkerboard-induced VEPs obtained via implanted electrodes [13]. In addition, V1, visual area V5 (V5), and the visual area middle temporal (MT) area were activated in a study using magnetoencephalography (MEG) [14], whereas V1 and V2 were activated in an fMRI study [15]. Furthermore, an electroencephalography (EEG) and fMRI study using Gabor gratings has shown that the early and late components of ssVEPs originated from V1 and V5, respectively [16]. These studies have suggested that these ssVEP components reflect the magnocellular pathway. Against this background, we hypothesized that concurrent ssVEP recording and fMRI analysis would provide detailed information about responsive brain regions.
fMRI-EEG data accumulated from healthy individuals over the last several years have shown a correlation between brain activity visualized on fMRI and the origin of VEPs (the location of dipoles) and between VEP amplitude and blood oxygenation level-dependent (BOLD) signals [17-19], indicating that more information can be obtained from fMRI-EEG recordings than from fMRI alone. Thus, concurrent study of fMRI-EEG should be able to reveal if the stimulus used by Vaegan and Hollows predominantly activates the magnocellular system. A previous fMRI study of magnocellular dysfunction in DD patients has shown reduced activity in V1 and MT [20] whereas another study reported reduced activity in the V5/MT area [21]. These studies also suggest that it is possible to elucidate if the reduction in the VEP amplitude observed by Vaegan and Hollows was caused by reduced activity in a particular brain area, indicating the source of VEP wave components.
In this study, we therefore performed fMRI-EEG concurrently using black-and-white sinusoidal gratings with low spatial frequency, low contrast, and high reversal frequency to investigate whether the visual stimulus predominantly activates the magnocellular pathway. By also including DD patients in the experiment, we sought to reveal the nature of impaired visual information processing in DD.
2. Methods
2.1. Subjects
Twenty-two participants took part in this study: 2 men aged 42 and 30 years old who had been diagnosed with DD by a pediatric neurologist and 20 healthy individuals (13 men and 7 women; mean age, 26.3 ± 5.53 years; paid volunteers) without abnormal childhood development as determined by interview or a history of neurological or psychological disorder who served as controls (TYP group). Eighteen subjects in TYP and 2 DD patients were right-handed. All subjects provided informed consent to participate in the study. This study was approved by the Ethics Committee of the National Center of Neurology and Psychiatry (NCNP), Tokyo, Japan (Approval number XXXX-291).
2.1.1. Patient #1
Patient #1 (DD1) was a 42-year-old right-handed man with no remarkable history related to birth, childhood development, or family history. Although the patient became aware of difficulty in reading and writing kana (hiragana, katakana) and kanji (Chinese characters) early in elementary school, he had never consulted a school nurse or visited a medical institution. He graduated from public elementary and junior high schools after following the normal curriculum and entered a vocational school. He later became a licensed chef, but resigned from his job due to a work-related problem. For the next 20 years he worked part-time as a convenience-store clerk before becoming a certified care assistant at the age of 39 and finding his current job at an elderly care facility. He obtained a motorbike license and driver’s license by taking the writing tests in kana.
He visited the NCNP hospital at the age of 41. He was fluent in everyday conversation and was able to engage in conversation with his physician about complex issues (e.g., movement of the Tsuyu or Baiu front). Upon initial examination, the patient scored poorly on the Wechsler Adult Intelligence Scale (WAIS-III), with a full-scale IQ (FIQ) of 59, a verbal IQ (VIQ) of 57, and a performance IQ (PIQ) of 68. These low IQ scores were considered to be the result of inadequate education. No abnormal findings were observed on head MRI or EEG.
He was able to write simple kanji characters and create an e-mail using a personal computer or cellphone. However, he occasionally had difficulty understanding if the converted kanji were correct. The patient was not fluent when reading a new sentence aloud because of poor chunking and frequent repetitive reading. In addition, he often skipped or misread words and characters. Results of the Kanji reading and writing test placed the patient’s writing ability at the first-grade level of elementary school (age of 7 years old). Based on his past history and present behavioral findings, including reading and writing skills, the patient was diagnosed with DD.
2.1.2. Patient #2
Patient #2 (DD2) was a 30-year-old right-handed man with nothing remarkable noted during his birth or development. However, his father had dyslexic tendencies. During early childhood, the patient had mild language delay but used much jargon. He started to use meaningful words at the age of 18 months and phrases at 36 months, and did not consult or receive treatment at a medical institution.
Although he studied a normal curriculum during the six years of elementary school, he started to attend a class for children with dysarthria when he was in the fourth grade because of some speech intelligibility problems. In the sixth grade, he was started studying a special curriculum once a week because of difficulty in writing, and around the same time, he visited our department. He was diagnosed with functional dysarthria upon initial examination. His IQ was within the normal range, with an FIQ of 100, VIQ of 95, and a PIQ of 91 on the Wechsler Intelligence Scale for Children-Revised scale. Head MRI and EEG findings were also within the normal range. Because of poor ability to read aloud and writethe patient was diagnosed with DD.
After graduating from junior-high and high schools after following the normal curriculum, he entered a vocational school but dropped out as he was unable to keep studying. Since then, he had been helping in his father’s business. He had also been attending a regional support center for independent living from the age of 26. At age 27, his WAIS-III test scores were FIQ 85, VIQ 92, and PIQ 79, indicating that his IQ was in the normal range. His daily conversation was smooth, with no signs of functional dysarthria. He was able to read, but had relatively severe writing difficulties. He was fluent when reading a sentence aloud, but had a trouble with nonsense words.
Results of the Kanji test conducted at age 30 showed that the patient’s writing skill was equivalent to the second-grader level in elementary school (age of 8 years old).
2.2. Task
All subjects completed the following tests and examinations: 1) the Kanji test for fourth graders in elementary school, 2) a hiragana reading test (continuous mora-bymora reading task, 4 syllable meaningful words reading task, 4 syllable non-words reading task and short-sentence reading task) in accordance with the diagnostic criteria for DD [4], 3) a rapid automatized naming (RAN) task [22], 4) phonological examination (mora deletion test, mora reversal test), and 5) Raven’s Colored Progressive Matrices (RCPM) as a non-verbal intelligence test. Ophthalmologic screening examinations including visual activity test and confrontation visual field test revealed that each subject showed normal visual acuity and normal visual field.
Reversed patterns of black-and-white sinusoidal gratings generated at a low spatial frequency (0.27 cycles per degree; c/deg) were used specifically to stimulate the magnocellular visual system [8] (Figure 1(a)). The reversal frequency was fixed at 7.5 Hz (15 reversals per second) and the mean luminance was 60 cd/m2, with two different contrast settings at 30% and 15%. To evaluate the parvocellular mechanism, a checkerboard stimulus was used at a visual angle of 10 minutes of arc and a low reversal frequency of 1 Hz (2 reversals per second) (Figure 1(b)). Presentation software (version 16; Neurobehavioral Systems Inc, Albany, CA) was used for stimulus delivery and data presentation.
A block design was used in the study. The experimental stimulus was produced as stated above, and a static image (i.e., without reversal presentation) was used as the control stimulus. One trial consisted of 4 blocks of alternate experimental and control stimuli (20 s each). Each subject underwent 3 trials that corresponded to 3 different experimental conditions: 30% contrast stripes, 15% contrast stripes, and black-and-white checkerboard.
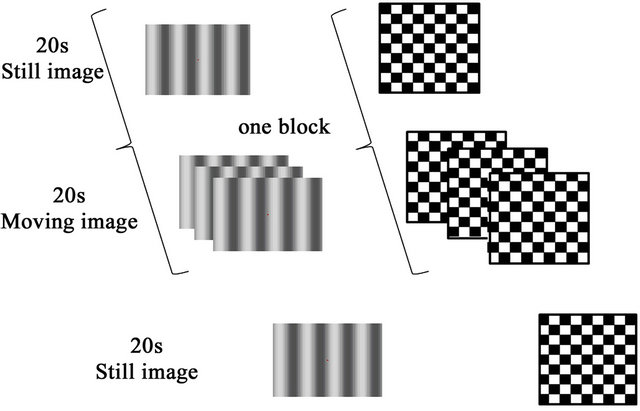
Figure 1. Task and stimuli: (a) Reversal pattern of low spatial frequency, high reversal frequency, and low contrast black-and-white sinusoidal gratings. Contrast was set at 15% and 30%; (b) Checkerboard pattern; One experimental trial consisted of 4 blocks of one experimental stimulus (moving image) and one control stimulus (static image) presented for 20 s each.
A point of fixation (a cross, 1 × 1 visual angle) was displayed on the screen and to maintain the subjects’ focal point on the screen, they were instructed to press a button when the color of the fixation point changed from red to blue. During the trials, MRI recording was performed and EEG was simultaneously recorded synchronized with the stimulus onset was recorded.
2.3. Recording
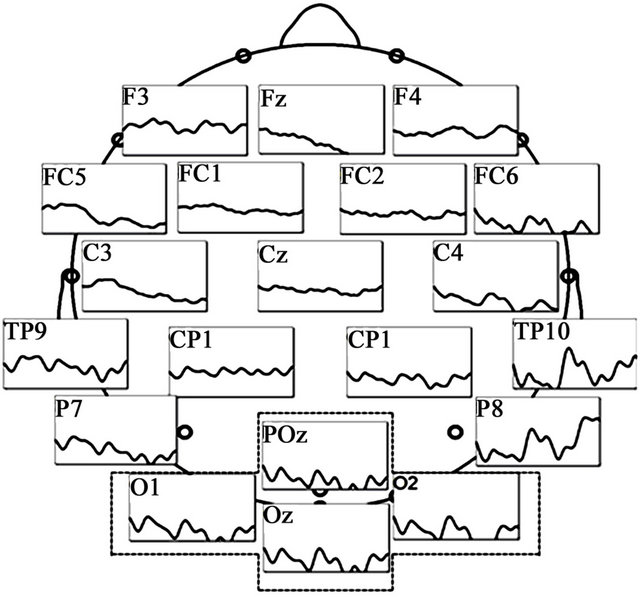
EEG was performed using a BrainAmp cap (Brain Products, Gilching, Germany) and was digitally recorded from a total of 32 channels that included the electrode locations defined by the International 10 - 20 system and additional locations in between (Fp1, Fp2, AFz, Fz, F3, F4, F7, F8, Fc1, Fc2, Fc5, Fc6, Cz, C3, C4, T7, T8, CP1, CP2, CP5, CP6, TP9, TP10, Pz, P3, P4, P7, P8, POz, Oz, O1, and O2) with the reference electrode on Fcz (Figure 2(a)). In this study, the sampling rate used was 5000 Hz and the downsampling rate 1000 Hz.
 (a)
(a)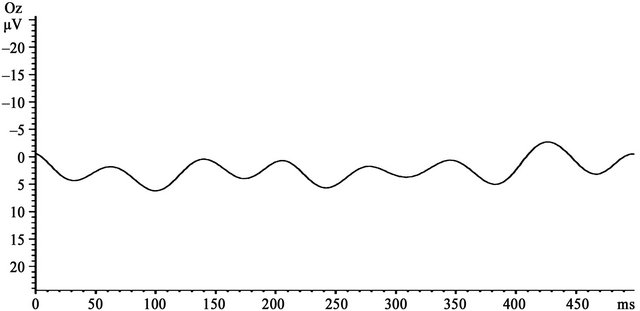 (b)
(b)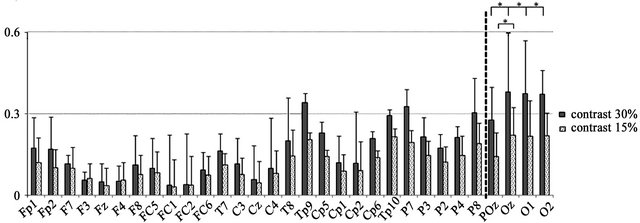 (c)
(c)
Figure 2. EEG recording sites and VEP findings: (a) Grand averaged waveforms in the 30% contrast condition of the TYP group. Prominent VEPs were generated centering on the occipital area; (b) VEP wave at the Oz electrode; (c) Mean amplitude at the 31 electrodes generated at 30% and 15% contrast in the TYP group. No significant differences in amplitude were observed between 30% and 15% contrast at the electrodes located to the left of the dotted line. At electrodes to the right of the line (i.e., POz, Oz, O1, and O2), amplitude was significantly larger at 30% than 15% contrast (*p < 0.05).
Brain fMRI (35 slices) was conducted using the 3.0T MRI scanner (Siemens, Verio) in an echo-planar imaging (EPI) sequence (TR = 2500 ms, TE = 30 ms, FOV = 192 mm, voxel size = 3 × 3 × 3 mm, and flip angle = 90˚). Head of each subject was kept with cushion apparatus or soft pad and they viewed the projected images via a mirror (7.5 × 13.5 cm) placed in front of the eyes.
2.4. Analysis
EEG data were sectioned into 500-ms segments after offline removal of MRI and ballistocardiogram artifacts. Ocular artifacts were also removed visually. Signal averaging was performed at each electrode (max. 160 times). EEG data were re-referenced offline to the mean voltage of all electrodes. Fast Fourier transform (FFT) was used to calculate amplitude (μV) at each electrode, and differences in amplitude between condition and electrode were analyzed using a two-way analysis of variance (two-way ANOVA; 2 conditions × 31 electrodes) followed by multiple comparison analysis using Bonferroni’s correction. BrainVision Analyzer 2 software (BrainProducts, Germany) was used to analyze the association between BOLD signals from the fMRI and FFT amplitudes.
In MRI analysis, the first five scans for each task were excluded from the analysis because of the magnetic saturation effect. A control stimulus (static image without reversals) was used to establish the baseline contrast for each experimental condition. Data from individual TYP subjects were analyzed using the abovementioned contrast under each experimental condition, and as a group, brain regions activated at 30% contrast, 15% contrast, or both 30% and 15% contrast were determined. Significant differences in signal intensity and in activated brain regions were compared within and between conditions. The DD patients were individually analyzed in the same manner as the TYP subjects, and differences in active brain regions under each condition were compared between the two groups using MATLAB (version 8.0; MathWorks, Natick, MA) and SPM8 software (Wellcome Department of Cognitive Neurology, London, UK)
3. Results
3.1. Behavioral Tests
The results of the hiragana reading test, RAN task, Kanji test, and RCPM are shown in Table 1. Compared with the TYP group, both DD patients required longer time to complete the hiragana test, but DD2 showed a similar time to read meaningful words or sentences. Scores of RCPM stayed within the normal range in all subjects.
On the Kanji test, both DD1 and DD2 had a low accuracy rate for writing (12.5% and 18.7%, respectively). DD1 also had a low accuracy rate of 62.5% for kanji reading, whereas kanji writing was normal (100%) in DD2.
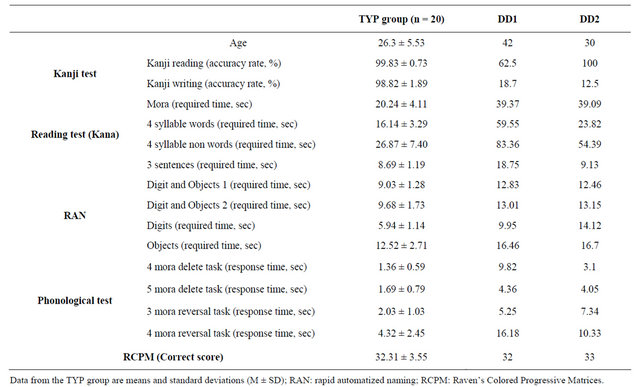
Table 1. Behavioral test results.
3.2. Task-Related Behavioral Indices
As shown in Figure 3, the accuracy rate for buttonpressing during stimulus presentation did not differ significantly between TYP subjects (ANOVA, F(2, 57) = 2.68, ns). Even DD2 had an accuracy rate above 80%, and it was considered that both patients kept alertness during the fMRI tasks.
3.3. VEP
In the TYP subjects, prominent ssVEPs were generated in response to reversed patterns of black-and-white sinusoidal gratings (Figure 2(a)). Signal averaging was 129.65 ± 16.59 times for 15% contrast condition and 124.35 ± 24.66 times for 30% contrast condition (Table 2). A two-way ANOVA of amplitude differences revealed significant main effects of condition and electrode and a significant interaction (condition, F(1, 19) = 20.15, p < 0.000; electrode, F(30, 570) = 31.71, p < 0.000; and interaction, F(30, 570) = 11.77, p < 0.000). Post-hoc tests showed that amplitude at the POz, O1, O2, and Oz electrodes was significantly larger at 30% contrast than at 15% contrast (p < 0.05). Among these 4 electrodes, amplitude at Oz, O1, and O2 was significantly larger than that at POz at 30% contrast (p < 0.05), and amplitude at Oz was also significantly larger than that at POz at 15% contrast (p < 0.05). A representative waveform observed at Oz electrodes of 1 subject in the TYP group is shown in Figure 2(b). At Oz where the largest difference in amplitude between the two contrast conditions was observed, the amplitude in the DD patients was smaller than the mean amplitude in the TYP group (Figure 4, Table 2).
In VEP under the Parvo condition, all subjects had a prominent P100 wave (Figure 5). In the TYP group, the P100 latency was 106.85 ± 8.57 ms and mean amplitude was 10.51 ± 5.82 μV, compared to the DD patients (DD1: 102 ms and 10.7 μV; DD2: 107 ms and 7.0 μV), with no significant difference between the two groups (Table 2).
3.4. fMRI
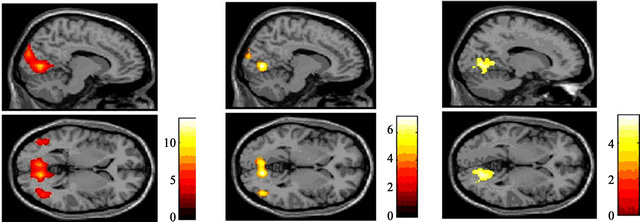
The left superior occipital gyrus, right lingual gyrus, and right cuneus were activated in response to reversed patterns of black-and-white sinusoidal gratings at 30% contrast (Figure 6(a)) as well as at 15% contrast (Figure 6(b)). A comparison of the data obtained at 30% and 15% contrast revealed that the V1 - V5/MT area was the common brain area activated under the two conditions (Figure 6(c), Table 3).
The brain area activated at 15% contrast was smaller than the area activated at 30% contrast, and the intensity of activation at 15% contrast was relatively lower than that seen at 30% contrast. Signal intensity in each activated brain area was higher at 30% than at 15% and was
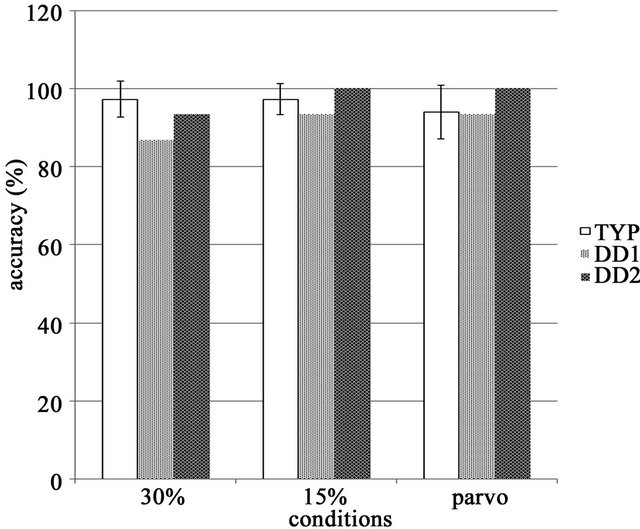
Figure 3. Task accuracy in the TYP group, accuracy rates were similar and no significant differences between tasks were observed.
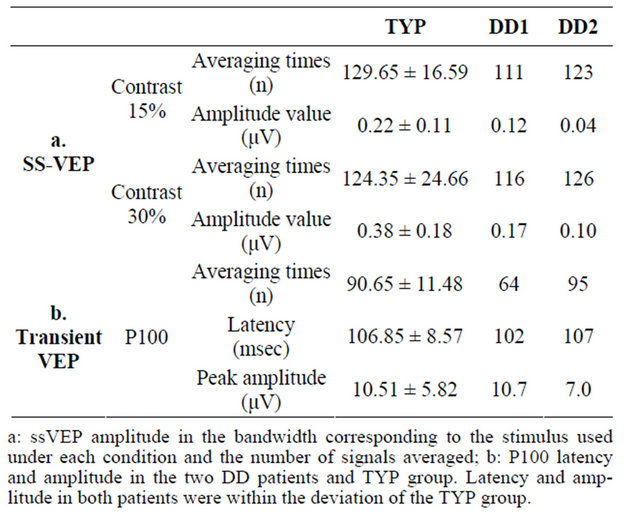
Table 2. EEG data.
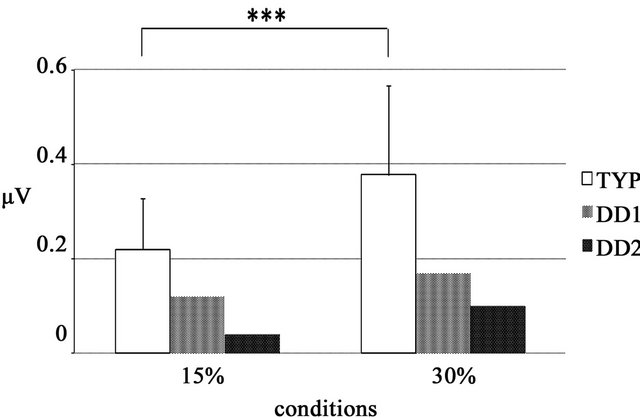
Figure 4. VEP amplitude value determined by FFT analysis at the Oz electrode ssVEP amplitude in the bandwidth corresponding to the stimulus used under each condition. In both DD patients, the amplitude obtained at 30% was higher than that obtained at 15%.
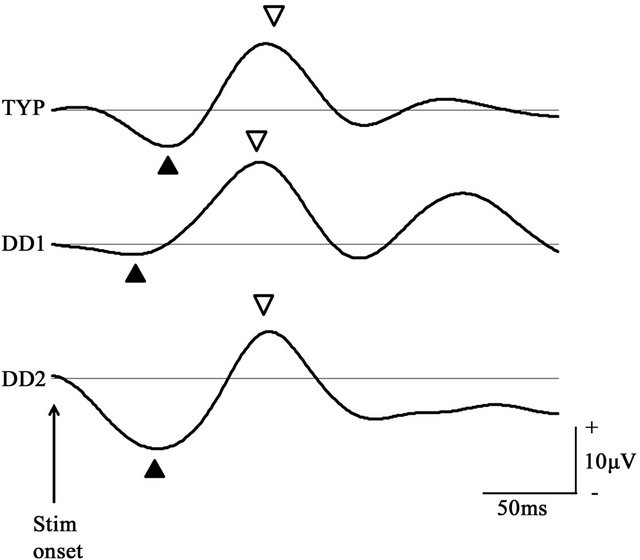
Figure 5. P100 waveform of the checkerboard stimulus condition at the Oz electrode P100 components in the TYP group and DD patients obtained under the parvocellular condition. P100 waveform in the TYP group was signal averaged. In both groups, the N75 (▲) and P100 (▽) components were prominent.
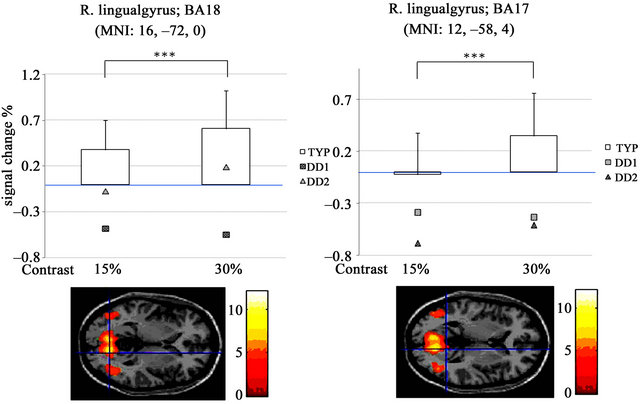
significantly different in the right lingual gyrus (t(19) = –5.77, p < 0.000; MNI coordinates, 16, –72, 0, t(19) = –4.98, p < 0.000; MNI coordinates, 12, –58, 4) (Figures 7(a) and (b)).
Activity in the primary visual cortex at 30% contrast was poor in both DD patients compared with TYP subjects (Figures 7(a) and (b)). In DD1, activity was detected in the right thalamus-anterior culmen (Figure 8, Table 4).
4. Discussion
In this study, we generated almost the same visual stimuli to those used by Vaegan and Hollows (low-contrast black-and-white sinusoidal gratings with low spatial and high reversal frequency) and performed fMRI-EEG. Prominent ssVEPs were observed in the control subjects and FFT amplitudes were higher at 30% contrast than at 15% contrast. This result is comparable with the findings of a previous study in which stimulus contrast was linearly correlated with VEP amplitude [23,24]. On the other hand, in both DD patients, VEPs were low and did not differ with the change in contrast. fMRI analysis in the TYP group revealed brain activity in a large area from V1 to V2, V3, and V5, which was significantly higher at 30% than 15% contrast. This result was again comparable with a previous study reporting a linear correlation between BOLD signals and stimulus contrast [25].
The increase in VEP amplitude due to a change in contrast was observed mainly in the occipital region (Oz) of the brain with reference to the parietal-occipital region (POz). Based on the brain regions activated in fMRI and EEG recording sites under the different contrast conditions, we conclude that the present stimulus predominantly elicited the response of the magnocellular system in the primary visual cortex.
In addition to V1, V2 was also widely activated in the present fMRI analysis, suggesting that the source of VEPs might have not been only V1 but also other regions. However, concurrent VEP recordings of 32 channels showed the largest amplitude was generated in the vicinity of Oz. The location of Oz is equivalent to the V1 region, and VEP amplitude generated at EEG electrode sites corresponding to other areas of the visual cortex, such as POz, were lower than the amplitude at Oz. This strongly suggests that the VEPs elicited by the present stimuli originated in V1 centering on the magnocellular pathway.
 (a) (b) (c)
Figure 6. Significant activation in each condition for the TYP group: (a) Result of group analysis using 30% contrast. Activation was observed in the V1 - V5 area; (b) Result of group analysis using 15% contrast. Intensity and area of activation were smaller than those obtained at 30%; (c) Activation was observed centering on the right lingual gyrus under both the 30% and 15% contrast conditions (P < 0.001 uncorrected, K > 200, (p < 0.05 FWE)).
 (a) (b)
Figure 7. Signal intensity in each condition at the right lingual gyrus: (a), (b) Signal changes (%) in the right lingual gyrus. Activity was higher at 30% than at 15%. In DD1 (□), activity was lower at 30% than 15%, while activation in DD2 (△) was similar to that observed in the TYP controls.
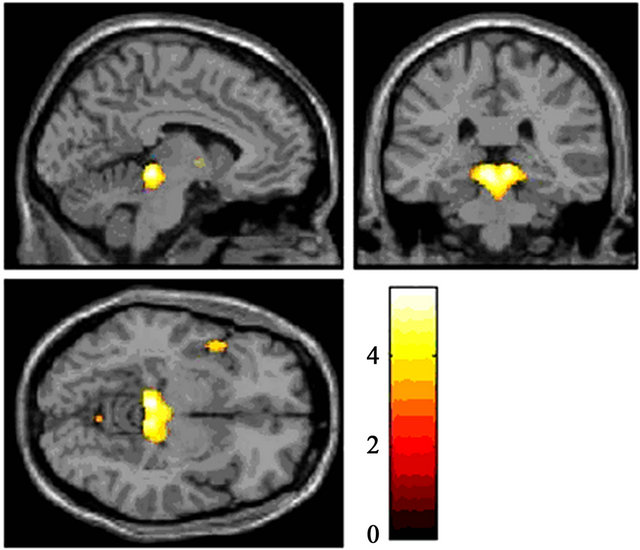
Figure 8. Significant activation in the 30% contrast condition for DD1 Brain areas activated in response to 30% contrast in DD1 were the thalamus and anterior culmen (P < 0.001 uncorrected, K > 300(p < 0.05 FWE)).
Previous studies have shown that the ssVEP components derived from V1, V2, and V5 [13-16]. Similarly, the present visual stimuli clearly activated V1, V2, a part of V3, and V5/MT. However, even though V5/MT was activated, activation was much greater in the V1 region, and as stated earlier, the largest amplitude was observed at Oz, corresponding to the V1 region. In other words, the visual stimulus used by Vaegan and Hollows predominantly activates the V1 region and provokes VEP components originating in V1. Vaegan and Hollows measured contrast sensitivity using 5 different contrasts (5%, 10%, 20%, 30%, and 50%) with fixed reversal and spatial frequencies and fixed brightness. They observed reduced or poor contrast sensitivity in pediatric DD patients. In the present study, we used two different contrast conditions (15% and 30%) because we had hypothesized that the use of contrast lower than 30% would allow us to measure the contrast threshold more thoroughly via not only VEP amplitude, but also fMRI signals.
VEP amplitude was reduced and activation of the visual cortex was impaired on fMRI analysis in the present DD patients. These findings suggest that the reduction in the VEP amplitude was largely due to dysfunction of the brain region responsible for the activation. Given the experimental results of Vaegan and Hollows and the present fMRI-EEG findings, it is possible that inactivation and dysfunction of the magnocellular visual pathway in DD patients starts in childhood. The P100 VEP component in our DD patients was similar to that in the TYP subjects, suggesting that the parvocellular pathway was relatively normal in these patients. Activation of the visual cortex and VEP amplitude are reported to be influenced by attention levels [26,27]. However, the accuracy for tasks in the present study was satisfactory, indicating that attention was well maintained by all subjects. It
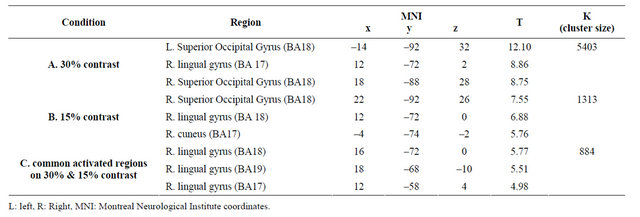
Table 3. Activation area in each condition for the TYP group.
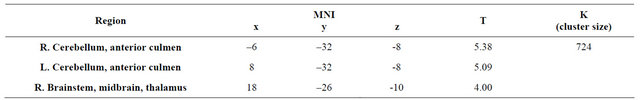
Table 4. Activation area in the 30% contrast condition for DD1.
is likely therefore that the magnocellular visual pathway is impaired in the DD patients, resulting in the pathological manifestations of dyslexia.
Boden and Giaschi have proposed several hypotheses regarding the involvement of the magnocellular visual system in reading disorders [28], including the contrast sensitivity deficits, position encoding deficits, ocular deficits, visual selective attention deficits, and parafoveal/foveal interaction deficits. Boden and Giaschi also stated that some of these hypotheses have yet to be corroborated, and some of the hypothesized causes may in fact not be probable. The contrast sensitivity deficit hypothesis proposes that reading disorders are caused by a reduction in contrast sensitivity, while the position encoding deficit hypothesis proposes that they are the result of confusion over strings of characters because the discovery of words and focusing of attention required for reading are insufficient. In the ocular deficit hypothesis, gaze saccade to a string of characters is impaired due to dysfunctional eye movement, or a decline in saccadic suppression causes visual images to blur. On the other hand, the visual selective attention deficit hypothesis proposes that reading impairment develop because of abnormal shifts in the visual spatial attention needed to shift central vision from one string of characters to another. The parafoveal/foveal interaction deficit hypothesis focuses on near central vision. Character recognition requires the integration of information from both the magnocellular and parvocellular pathway. The magnocellular system is involved in near central vision, through which the characters in a word and the morphological features of it are recognized, and the information is combined with information from central vision via the parvocellular system. This hypothesis proposes that reading is impaired because of reduced superiority of near central vision.
Reading impairment in DD may be caused by one or a combination of the abovementioned hypotheses. Because we used sinusoidal gratings as a visual stimulus in the present study, it is unlikely that inattention to characters or saccade-related disorders were involved. Our results indicate that the contrast sensitivity deficit and the parafoveal/foveal interaction deficit hypotheses are the most likely explanations for our DD patients’ reading impairment. However, according to Boden and Giaschi, contrast abnormality is regarded as being mild in DD because of the high contrast between strings of characters and the background. Because of the low contrast settings (15% and 30%) used in the present study, we hesitate to connect the present results with the contrast sensitivity deficit hypothesis. Although the impaired processing of near central vision appears to have been the main cause in the present DD patients, the magnocellular deficit theory involves a complex set of factors. It is therefore necessary to the present visual stimulus at higher contrast settings to elucidate the involvement of the contrast sensitivity deficit hypothesis.
Unlike healthy individuals, the right thalamus and the anterior surface of the cerebellum were activated in DD1. DD has never been investigated using a stimulus similar to that used in this study. However, functional brain imaging performed during a phonological manipulation task showed impaired activation in the right thalamus [29,30]. These results may be relevant to the present ones despite many differences in the experimental design of the studies.
To conclude, in this study, the magnocellular visual pathway was activated predominantly by a reversal of black-and-white sinusoidal gratings generated at low spatial frequency, high reversal frequency, and low contrast. Using the same stimulus, we plan to perform FMRI-EEG of pediatric DD patients and healthy control children to elucidate the mechanism by which the magnocellular system is impaired in pediatric DD.
5. Acknowledgements
This work was supported in part by Intramural Research Grant (22-6; Clinical Research for Diagnostic and Therapeutic Innovations in Developmental Disorders) for Neurological and Psychiatric Disorders of National Center of Neurology and Psychiatry (NCNP).
REFERENCES
- WHO, “International Classification of Diseases (ICD 10),” 2009. http://www.who.int/classifications/icd/en/
- American Psychiatric Association, “Diagnostic and Statistical Manual of Mental Disorders,” 4th Edition, Washington DC, 2000.
- R. L. Peterson and B. F. Pennington, “Developmental Dyslexia,” Lancet, Vol. 379, No. 3830, 2012, pp. 1997-2007. doi:10.1016/S0140-6736(12)60198-6
- M. Inagaki, “Practical Guidelines for Diagnosis and Treatment in Patients with Specific Developmental Disorders [in Japan],” Shindan to Chiryousha, Tokyo, 2010.
- M. Livingstone and D. Hubel, “Segregation of Form, Color, Movement, and Depth: Anatomy, Physiology, and Perception,” Science, Vol. 240, No. 4853, 1988, pp. 740-749. doi:10.1126/science.3283936
- A. Galaburda and M. Livingstone, “Evidence for a Magnocellular Defect in Developmental Dyslexia,” Annals of the New York Academy of Sciences, Vol. 682, 1993, pp. 70- 82. doi:10.1111/j.1749-6632.1993.tb22960.x
- A. Romani, S. Conte, R. Callieco, R. Bergamaschi, M. Versino, G. Lanzi, C. A. Zambrino and V. Cosi, “Visual Evoked Potential Abnormalities in Dyslexia Children,” Functinal Neurology, Vol. 16, No. 3, 2001, pp. 219-229.
- Vaegan and F. C. Hollows, “Visual-Evoked Response, Pattern Electroretinogram, and Psychophysical Magnocellular Thresholds in Glaucoma, Optic Atrophy, and Dyslexia,” Optometry & Vision Science, Vol. 83, No. 7, pp. 486-498. doi:10.1097/01.opx.0000225920.97380.62
- S. Tobimatsu, “Transient and Steady-State VEPs-Reappraisal,” International Congress Series, Vol. 1232, 2002, pp. 207-211. doi:10.1016/S0531-5131(01)00840-8
- G. Bonmassar, D. P. Shwartz, A. K. Liu, K. K. Kwong, A. M. Dale and J. W. Belliveau, “Spatiotemporal Brain Imaging of Visual-Evoked Activity Using Interleaved EEG and fMRI Recordings,” Neuroimaging, Vol. 13, No. 6, 2001, pp. 1035-1043. doi:10.1006/nimg.2001.0754
- H. Tabuchi, T. Yokoyama, M. Shimogawara, K. Shiraki, E. Nagasaka and T. Miki, “Study of the Visual Evoked Magnetic Field with the M-Sequence Technique,” Visual Science, Vol. 43, No. 6, 2002, pp. 2045-2054.
- M. A. Pastor, J. Artieda, J. Arbizu, M. Valencia and J. C. Masdeu, “Human Cerebral Activation during SteadyState Visual-Evoked Responses,” Journal of Neuroscience, Vol. 23, No. 37, 2003, pp. 11621-11627.
- P. Krolak-Salmon, M. A. Henaff, C. Tallon-Baudry, B. Yvert, M. Guenot, A. Vighetto, F. Mauguiere and O. Bertrand, “Human Lateral Geniculate Nucleus and Visual Cortex Respond to Screen Flicker,” Annals of Neurology, Vol. 53, No. 1, 2003, pp. 73-80. doi:10.1002/ana.10403
- I. P. Fawcett, G. R. Barnes, A. Hillebrand and K. D. Singh, “The Temporal Frequency Tuning of Human Visual Cortex Investigated Using Synthetic Aperture Magnetometry,” Neuroimage, Vol. 21, No. 4, 2004, pp. 1542-1553. doi:10.1016/j.neuroimage.2003.10.045
- R. Srinivasan, E. Fornari, M. G. Knyazeva, R. Meuli and P. Maeder, “fMRI Responses in Medial Frontal Cortex That Depend on the Temporal Frequency of Visual Input,” Experimental Brain Research, Vol. 180, No. 4, 2007, pp. 677-691. doi:10.1007/s00221-007-0886-3
- F. Di Russo, S. Pitzalis, T. Aprile, G. Spitoni, F. Patria, A. Stella, D. Spinelli and S. A. Hillyard, “Spatiotemporal Analysis of the Cortical Sources of the Steady-State Visual Evoked Potential,” Human Brain Mapping, Vol. 28, No. 4, 2007, pp. 323-334. doi:10.1002/hbm.20276
- C. Porcaro, D. Ostwald and A. P. Bagshaw, “Functional Source Separation Improves the Quality of Single Trial Visual Evoked Potentials Recorded during Concurrent EEGfMRI,” Neuroimage, Vol. 50, No. 1, 2010, pp. 112-123. doi:10.1016/j.neuroimage.2009.12.002
- S. D. Mayhew, B. J. Macintosh, S. G. Dirckx, G. D. Iannetti and R. G. Wise, “Coupling of Simultaneously Acquired Electrophysiological and Haemodynamic Responses during Visual Stimulation,” Magn Reson Imaging, Vol. 28, No. 8, 2010, pp. 1066-1077. doi:10.1016/j.mri.2010.03.027
- Z. Liu, C. Rios, N. Zhang, L. Yang, W. Chen and B. He, “Linear and Nonlinear Relationships between Visual Stimuli, EEG and BOLD fMRI Signals,” Neuroimage, Vol. 50, No. 3, 2010, pp. 1054-1066.
- doi:10.1016/j.neuroimage.2010.01.017
- J. B. Demb, G. M. Boynton and D. J. Heeger, “Functional Magnetic Resonance Imaging of Early Visual Pathways in Dyslexia,” Journal of Neuroscience, Vol. 18, No. 17, 1998, pp. 6939-6951.
- G. F. Eden, J. W. VanMeter, J. M. Rumsey, J. M. Maisog, R. P. Woods and T. A. Zeffiro, “Abnormal Processing of Visual Motion in Dyslexia,” Nature, Vol. 382, No. 6586, 1996, pp. 66-69. doi:10.1038/382066a0
- T. Kobayashi, M. Inagaki, A. Gunji, K. Yatabe, Y. Kita, M. Kaga, T. Gotoh and T. Koike, “Developmental Changes of Rapid Automatized Naming and Hiragana Reading of Japanese Elementary School Children[in Japan],” No to Hattatsu, Vol. 43, No. 6, 2011, pp. 465-471.
- F. W. Campbell and L. Maffei, “Evidence for the Existence of Orientation and Size Detectors in the Human Visual System,” Journal of Physiology, Vol. 207, No. 3, 1970, pp. 635-652.
- H. Yamazaki, E. Adachi-Usami and J. Chiba, “Contrast Thresholds of Diabetic Patients Determined by VECP and Psychophysical Measurements,” Acta Opthalmology, Vol. 60, No. 3, 1982, pp. 386-392. doi:10.1111/j.1755-3768.1982.tb03029.x
- J. F. Schumacher, S. K. Thompson and C. A. Olman, “Contrast Response Functions for Single Gabor Patches: ROIBased Analysis Over-Represents Low-Contrast Patches for GE BOLD,” Front System of Neuroscience, Vol. 5, No. 19, 2011, pp. 1-10.
- G. T. Buracas and G. M. Boynton, “The Effect of Spatial Attention on Contrast Response Functions in Human Visual Cortex,” Journal of Neuroscience, Vol. 27, No. 1, 2007, pp. 93-97. doi:10.1523/JNEUROSCI.3162-06.2007
- F. D. Russo, D. Spinelli and M. C. Morrone, “Automatic Gain Control Contrast Mechanisms Are Modulated by Attention in Humans: Evidence from Visual Evoked Potentials,” Vision Research, Vol. 41, No. 19, 2001, pp. 2435-2447. doi:10.1016/S0042-6989(01)00134-1
- C. Boden and D. Giaschi, “M-Stream Deficits and ReadingRelated Visual Processes in Developmental Dyslexia,” Psychological Bullutin, Vol. 133, No. 2, 2007, pp. 346- 366. doi:10.1037/0033-2909.133.2.346
- J. M. Rumsey, B. Horwitz, B. C. Donohue, K. Nace, J. M. Maisog and P. Andreason, “Phonological and Orthographic Components of Word Recognition:A PET-rCBF Study,” Brain, Vol. 120, No. 5, 1997, pp. 739-759. doi:10.1093/brain/120.5.739
- J. M. Rumsey, K. Nace, B. Donohue, D. Wise, J. M. Maisog and P. Andreason, “A Positron Emission Tomographic Study of Impairedword Recognition and Phonological Processing in Dyslexic Men,” Archives of Neurology, Vol. 54, No. 5, 1997, pp. 562-573. doi:10.1001/archneur.1997.00550170042013
NOTES
*These authors contributed equally to the study.