Advances in Chemical Engineering and Science
Vol.3 No.4(2013), Article ID:37614,9 pages DOI:10.4236/aces.2013.34028
Physical Modeling of the Enzymatic Glucose-Fuelled Fuel Cells
1SciRCon (Scientific, Research, Consulting), Los Angeles, USA
2Department of Biotechnology Engineering, Ort Braude College, Karmiel, Israel
Email: rubin_zeev@yahoo.com, leamor@braude.ac.il
Copyright © 2013 Vladimir (Zeev) Rubin, Lea Mor. This is an open access article distributed under the Creative Commons Attribution License, which permits unrestricted use, distribution, and reproduction in any medium, provided the original work is properly cited.
Received April 14, 2013; revised May 14, 2013; accepted May 30, 2013
Keywords: Enzyme; Biofuel Cell; Glucose; Modeling; Open Circle Voltage; Surface Generation
ABSTRACT
An enzymatic glucose biofuel cell uses glucose as fuel and enzymes as biocatalyst, to transform biochemical energy into electrical energy. An analytical modelling of an enzymatic biofuel cell should be used, while developing fuel cell, to estimate its various enzymatic parameters, to obtain the highest voltage feasibly. The analytical model was developed, and the open circuit voltage (OCV) calculated by the model for various parameters of the fuel cell is in agreement with the experimental results. The OCV is interpreted by using this model, based on theoretical consideration of ions transportation in the solution. The generation and consumptions of the ions near the electrodes were defined in the model by exponential approximations, with different depletion coefficients. The model reveals that increasing the rates of hydrogen ions generation and (or) consumption by enzyme or chemical reactions leads to a higher value of OCV. The model points that the OCV is saturated with a glucose concentration and increased logarithmically with a surface enzyme concentration. Hence, a low glucose concentration is sufficient to obtain adequate OCV, on the one hand, but it can be increased by increasing electrode surface porosity, on the other hand. This model can be expanded to include time and close circuit voltage.
1. Introduction
The biological fuel cell converts directly chemical or biochemical energy, in the form of glucose, or other common fuels currently used in fuel cells, into electrical energy [1-6]. Enzymatic fuel cells (biofuel cell) use glucose as fuels and enzymes as biocatalyst. Enzymes can convert the glucose in serial reactions into water and carbon dioxide. The use of the modeling approach [7] to interpret the behavior of enzymatic fuel cells is not so common in the literature. The enzymatic fuel cells models include reaction kinetics, transport phenomena [8,9], statistical analyses [10] and metabolic analyses [11]. There is a single channel [8] for flow of each anolyte and catholyte stream. The electrons generated in the oxidation reaction can pass to the anode directly, or through mediator. An exponential decay in the availability of oxygen from the cathode side was observed [12,13]. Various authors have used theoretical and experimental methods for estimating the fuel cell performance [14-16]. The models [8,9,14] are numerical models.
The focus of this paper is to develop a simple theoretical analytical model for enzymatic membranless glucose-fuelled fuel cells, with direct electron transfer mechanism (without use of a mediator). The physical model includes rates of hydrogen’s ions generations and consumptions, which are the essential parts of the model.
The present study aimed to predict hydrogen ions concentration distribution and open cell voltage in enzymatic fuel cell, based on basic chemical, biochemical and electro physical principles.
2. Materials and Methods
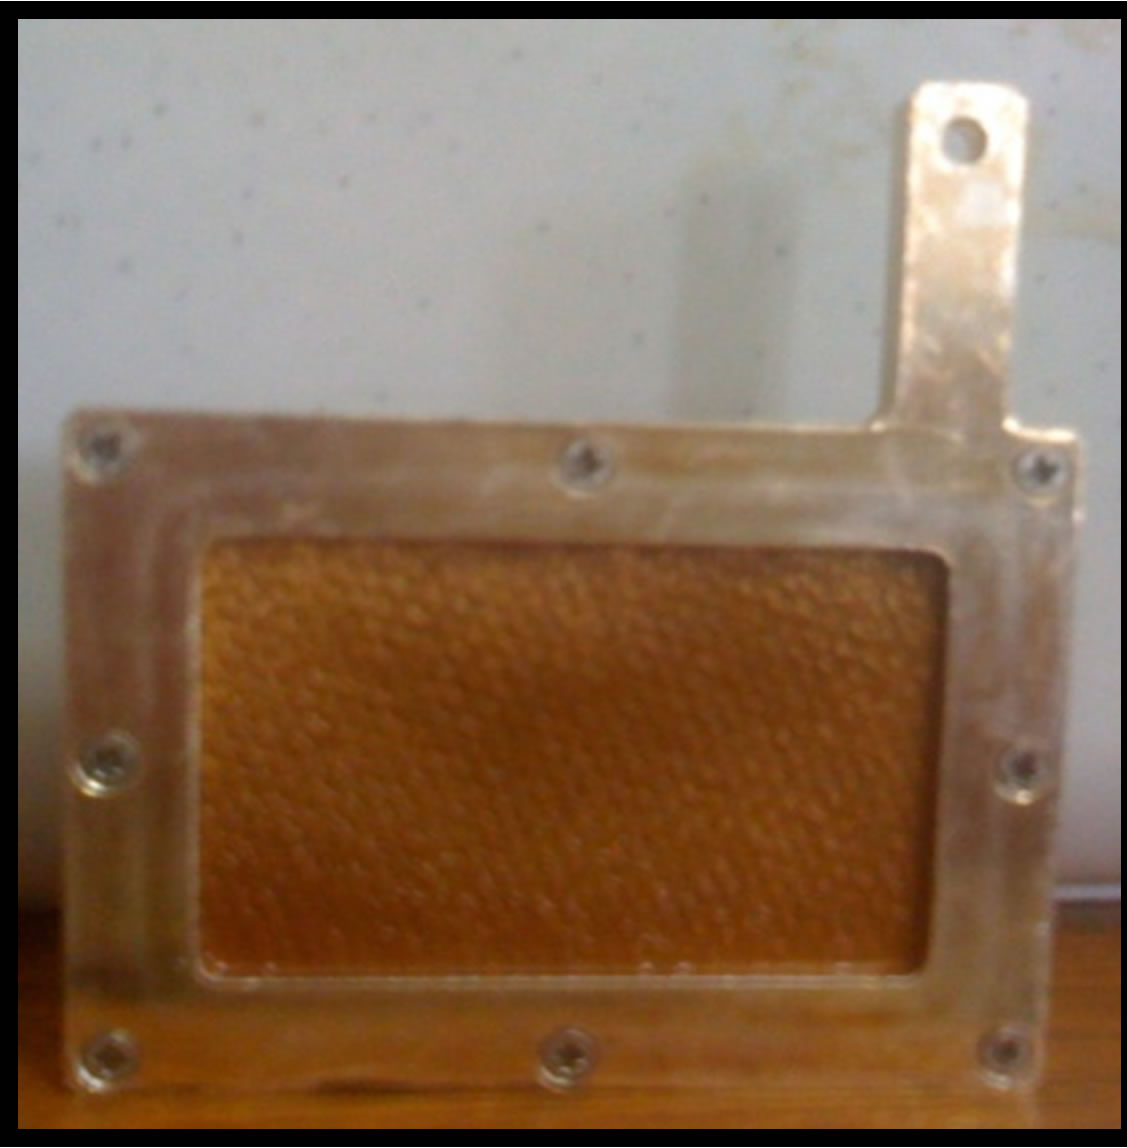
The fuel cell was designed in the laboratory of the electro engineering department of ORT Braude College. The electrodes consisted of carbon cloth. The carbon cloth (24 cm2) was coated with gold or silver to which enzyme is coupled by an arm separator through an amino or carboxylate group. The enzymatic anode is shown in Figure 1(a). The assemblance of the fuel cell is shown also in Figure 1(b). The two electrodes were separated by a mem-
 (a)
(a)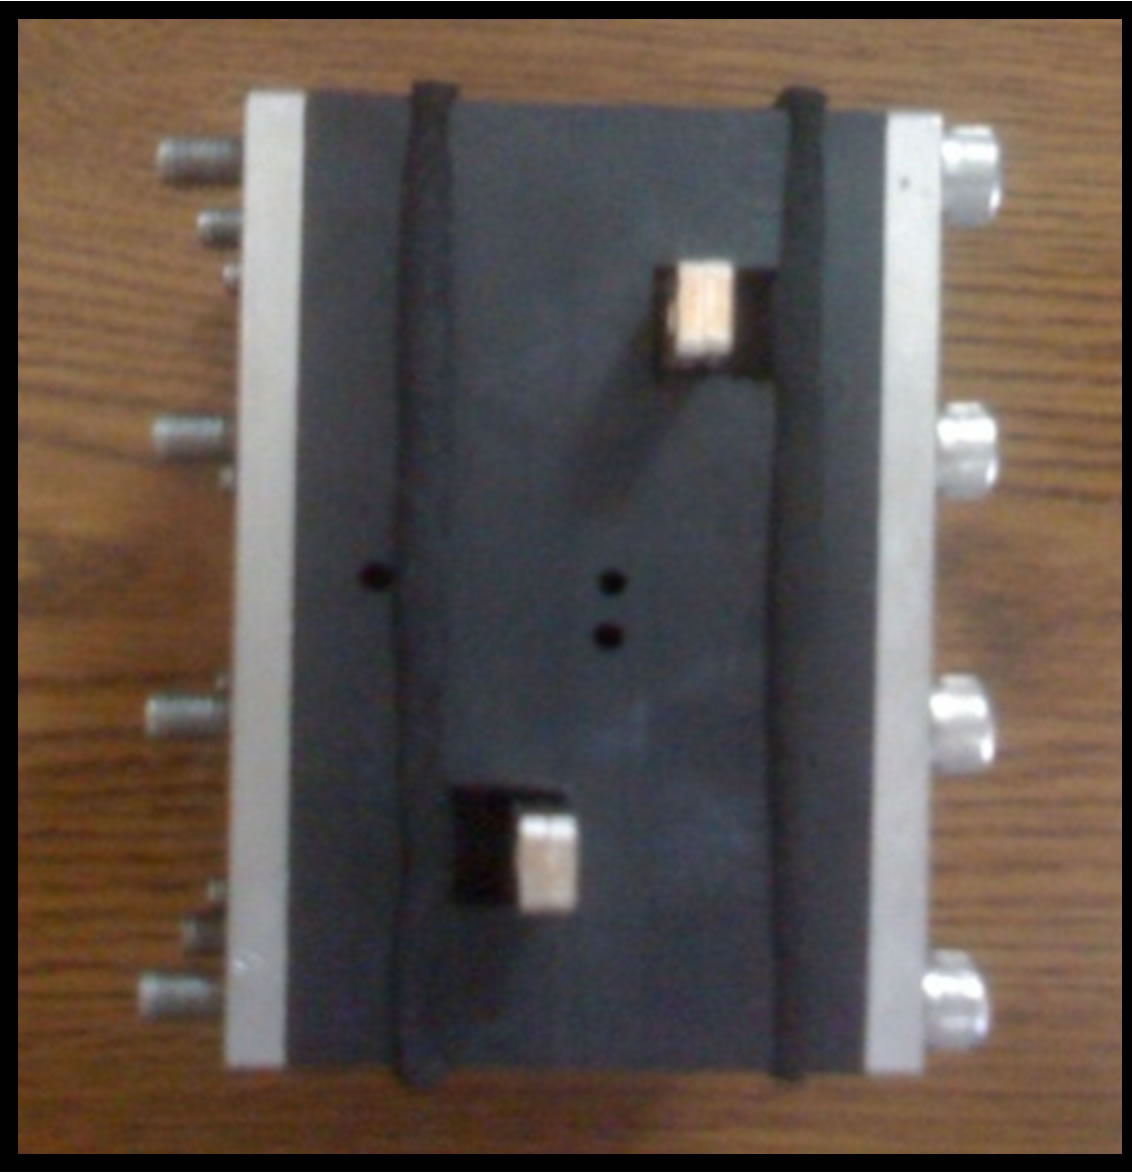 (b)
(b)
Figure 1. Membrenless fuel cell and its components. (a) Enzymatic anode electrode; (b) Top view assembled structure. The electrodes electrical contacts are shown. The openings of the electrolyte and fuel reservoir are shown.
brenless reservoir containing an electrolyte solution, enables ions movement between the electrodes. The distance between the electrodes is 4 mm. The cathode and the anode connect to an external circuit. The cathode is exposed to the ambient air. No membrane is needed since the fuel is in no contact with the cathode. Before the experiment the fuel reservoir was filled with glucose solution and the electrolyte reservoir (between the electrodes) was filled with buffer phosphate. Electrolyte concentrations (buffer phosphate) were 0.1 or 1 M. The glucose concentration was 1 M. The range of the surface enzyme concentration was 2.8 × 10⁻⁵ - 6.9 × 10⁻⁴ mol/m2. Measurements were done at 23˚C.
3. Theory
Since a physical and an engineering approach require flexible and combinable models, this work tries to develop an analytical model to describe ions concentration and voltage in a fuel cell. In this approach, the chemical, biochemical and physical phenomena occurring on the electrodes and in the electrolyte reservoir are expressed, using differential equations to obtain analytical expressions.
3.1. The Model
The biofuel cell consists of anode and cathode electrodes, parallel to each other. The enzyme glucose oxidase (GOD) that catalyzes oxidation of glucose is attached to the anode. The electrodes are parallel plane, separated by electrolyte solution (usually a phosphate buffer) which is needed for ions migration and for optimize enzymatic activity in the fuel cell. The enzymatic reaction on the anode gives two electrons and two protons [17]. The electrons are transferred directly to the anode without the use of mediator, and flow through the external circle to the cathode. The hydrogen ions move in the electrolyte from the anode towards the cathode.
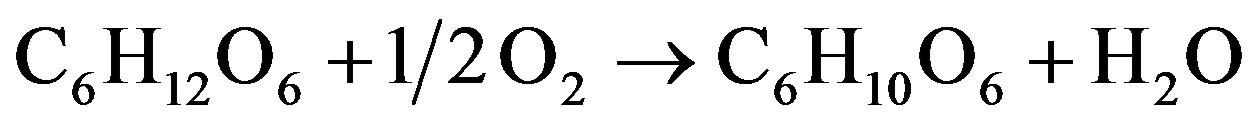
On the cathode, oxygen reacts chemically with the electrons from the external circuit and with the hydrogen ions from the electrolyte to yield water The Overall red-ox reaction occurs in the fuel cell is (1):
 (1)
(1)
The Gibbs free energy released in this reaction is −97.5 kJ·mol−1 [18], is expressed by the maximal theoretical fuel cell standard potential of 0.505 V. The protons gradient created between the two electrodes is one of the main factors contributed to ions current density and the voltage on the fuel cell. The electrical conductivity of the buffer is a function of buffer concentration that assumed to be independent of the distance from the electrodes. The buffer solution is assumed to be electrically neutral. The model is assumed to be in steady state in regards to proton production and consumption.
3.1.1. Rate of Hydrogen Ions Generation and Consumption
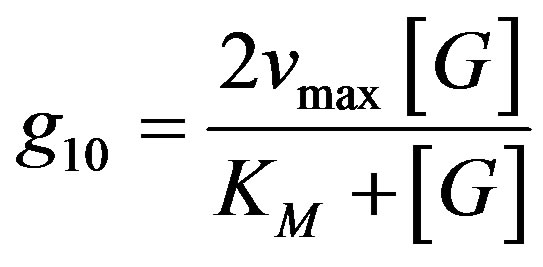
In our case, the rate of hydrogen ions production g10 by the enzyme electrode (amount of hydrogen ions generated per unit of time in unit of volume) as a function of glucose concentration [G] can be compute from Michaelis Menten model (Equation (2)):
 (2)
(2)
In the fuel cell the enzyme is attached to the surface of the electrode, hence adaptation of this equation to surface generation should be considered. The reaction rate is also a function of the rate constants of the enzymatic reactions, kcat and KM, where , KM Michaelis Menten constant (M), [ET]-volume enzyme concentration. The velocity of H+ production is twice the velocity of glucose consumption. The hydrogen ions are consumed on the cathode according to Equation (1), in a chemical reaction, with reaction constant rate kc, where the reaction rate g20 is assumed to be:
 (3)
(3)
The two processes, hydrogen ions generation on the anode and consumption on the cathode determines hydrogen ions distribution along the fuel cell.
3.1.2. Hydrogen Ions Movement in the Electrolyte
The hydrogen ions, generated on the anode, are moving towards the cathode, were they are consumed. They are responsible, together with the electrolyte, to the current density in the fuel cell. The current density ![]() derived from flux of ions present in the solution during the fuel cell operation [19] is expressed in Equation (4)
derived from flux of ions present in the solution during the fuel cell operation [19] is expressed in Equation (4)
 (4)
(4)
where e signed electron ionic charge, ci is its concentration, Di is its diffusion coefficient, σ is the electrical conductivity and E is the electrical field. Current density is assumed here to be one dimensional along the x-axis. The direction of the axis x is from anode to cathode and normal to both of them. Using kinetic theory [19] the electrical conductivity, derived from the ions present in the solution, is expressed as:
 (5)
(5)
The summation index i refers to the ions that take part in electricity conduction in solution. Here Dbi—diffusion coefficient of the buffer’s ions, m2·s−1, F—Faraday constant, R—universal gas constant, T—temperature. The first part of this expression includes buffer ions concentration cbi and the second part hydrogen ions concentration . In order to get ions concentration, the mass conservation equation
 (6)
(6)
was solved here for a steady state conditions. The rates of hydrogen ions generation by enzyme on anode and hydrogen ions consumption on cathode were added to Equation (6). This has done by choosing such mathematical functions for the rate of generation g1 and consumption g2 of hydrogen’s ions, which accepted the greatest values on borders of electrodes and were negligible at the bulk.
Equation (6) is composed of three parts: divergent of current density, hydrogen ions generation by oxidation and hydrogen ions consumption by reduction. We suggest the mathematical functions to approximate the rate of generation g1 and the rate of consumption g2 as:
 (7)
(7)
Here, g10 is the volume generation rate due to the anode enzymatic reaction, given by Equation (2), where x is the distance between the electrodes. Its value is zero on the anode and L on the cathode. L01 is a depletion coefficient constant depending on the coupling of the enzyme to the anode and on the electrolyte properties.
The function g1 gives approximation to the generation rate. The value of g1 approaches g10 as the value of х comes close to the anode. As the distance from the anode increases, the value of g1 in Equation (7) significantly decreases.
The consumption rate g2 is due to the chemical reaction on the cathode. The volume consumption rate near the cathode get the value g20, and should be zero on the anode. The function g2 (Equation (7)) describes these relationships. Here, g20 is the volume consumption rate due to the oxygen reduction near the cathode, given by Equation (3). L02 is a depletion coefficient constant depending on the electrolyte and cathode properties.
The function g01 describes the volume generation, up to distance L01, from the anode. This distance is also the parameter describes the exponential decay of the generation g1 in Equation (7). The function gs1, on the other hand, describes the experimental results of surface generation on the anode. The same equation is applicable for the volume consumption g20 near cathode. These functions can be connected by expressions (8)
 (8)
(8)
3.1.3. Distribution of Hydrogen Ions
Substituting current density (Equation (4)), electrical conductivity (Equation (5)), rate of generation and consumption (Equation (7)) into Equation (6) yields a differential equation that describes concentration changes as a function of the distance from the electrode (Equation (9)):
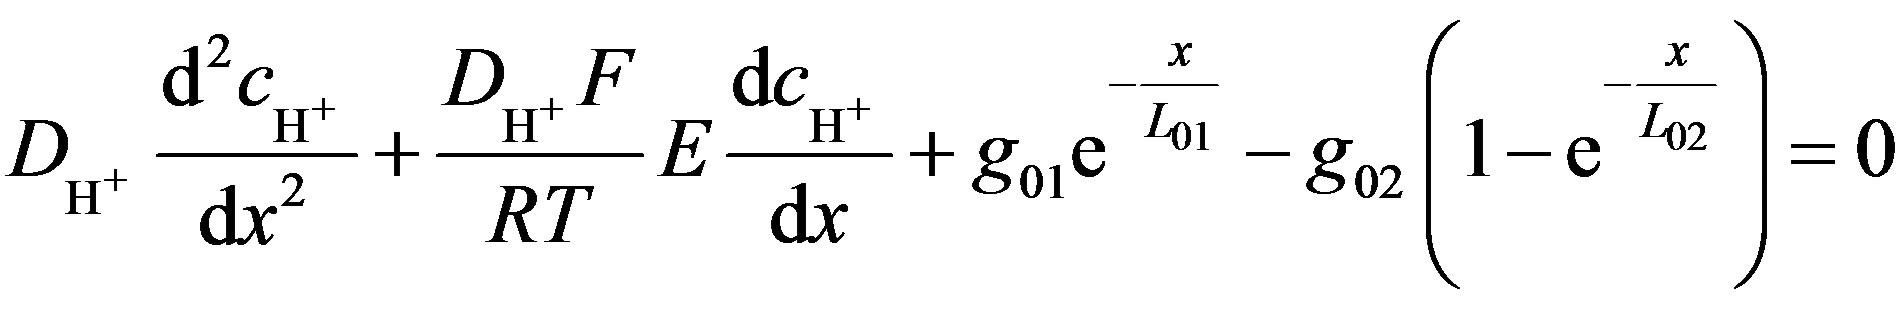 (9)
(9)
The following boundary conditions are defined: the boundary condition for the anode, when x = 0, and for the cathode, when x = L (Equation (10)).
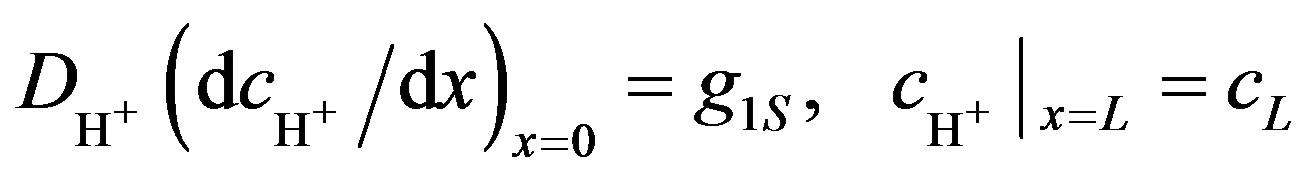 (10)
(10)
were the term g1S describes an amount of hydrogen ions generating from unit of anode surface per unit of time, cL is the concentration of hydrogen ions at the cathode.
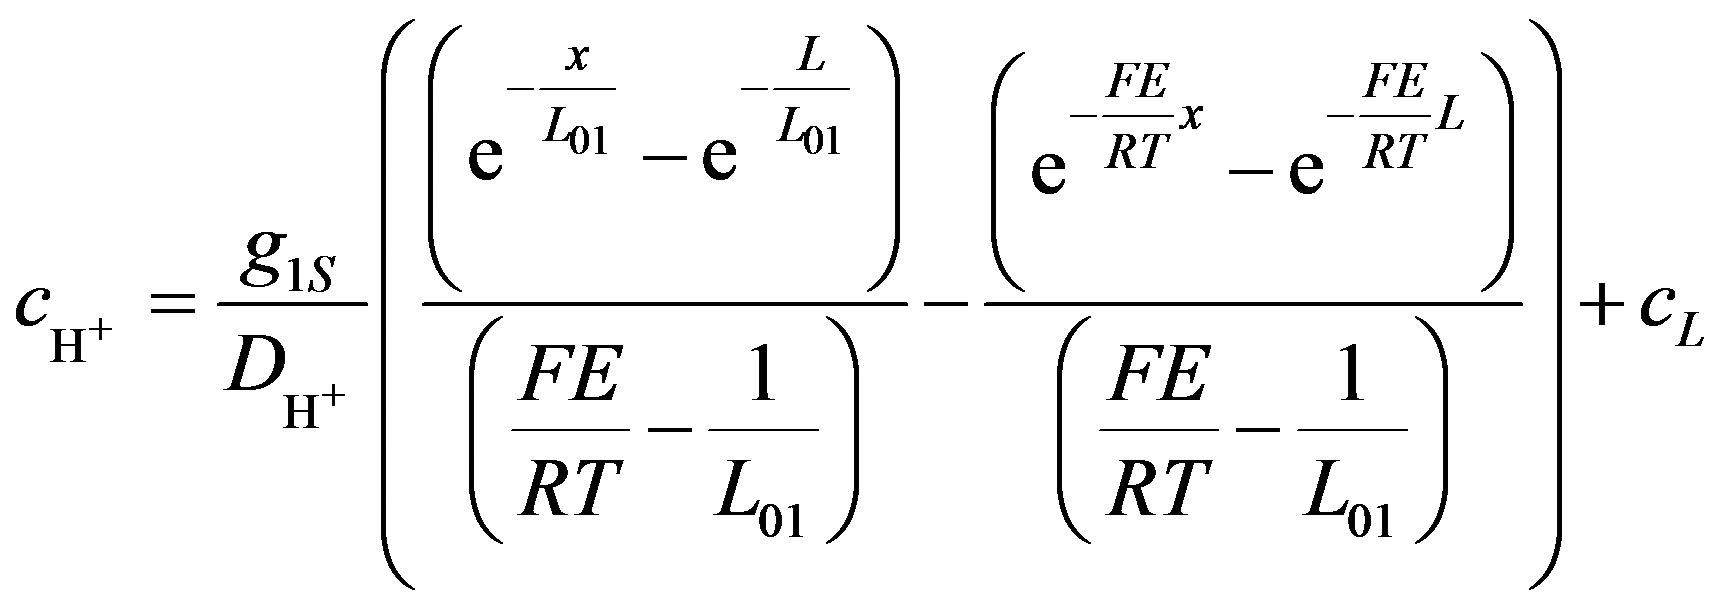
Solving Equation (9) gives the concentration of hydrogen ions along the axis x for surface generation and consumption (Equation (11)).
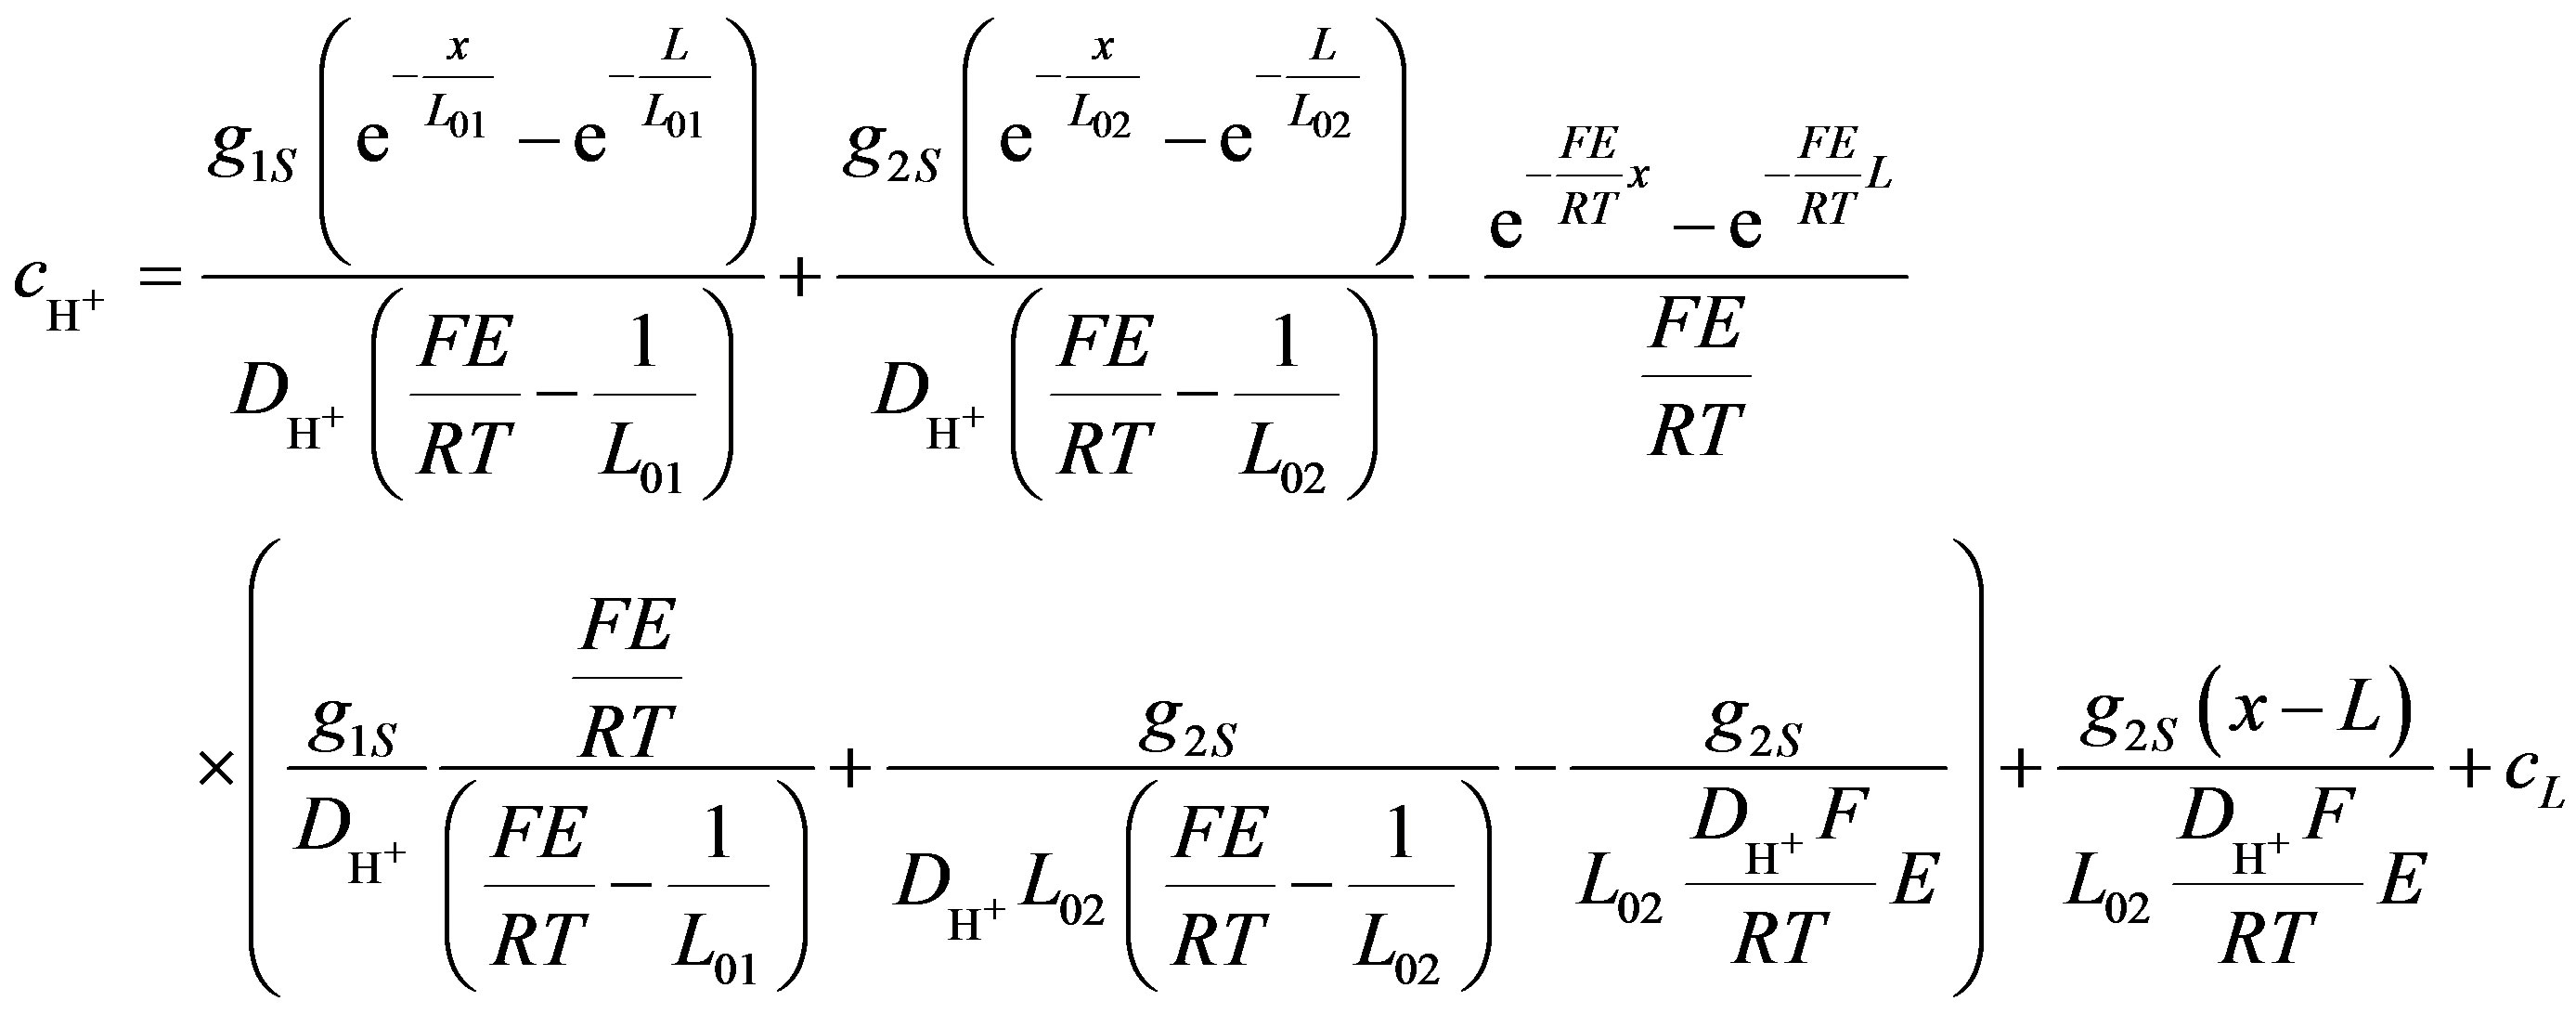 (11)
(11)
The generation of protons, due to the enzymatic reaction, occurs only on the anode, and can be easily estimated from experimental results. When the rate of ions consumption is difficult to estimate, omitted g2S in Equation (9) conducts to
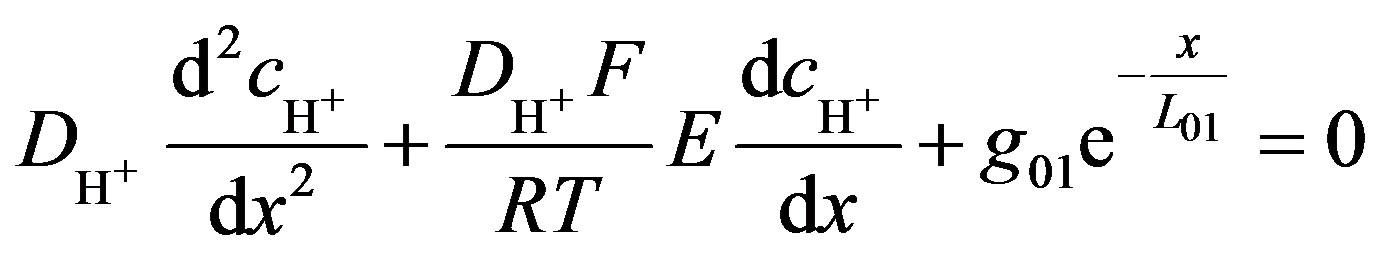 (12)
(12)
The solution of Equation (12) gives simplified form of the hydrogen ions concentration (Equation 13).
 (13)
(13)
Equation (13)) is a private case of Equation (11), and doesn’t include rate of ions consumption at the cathode. In this case hydrogen ions concentration near the cathode, cL, is obtained from the boundary condition.
3.2. Open Circuit Voltage (OCV)
The OCV can be calculated from Equation (4) by substituting the current density as zero, substituting the conductivity σ from Equation (5), and integration of the electrical field by separation of variables.
The result of integration voltage U is
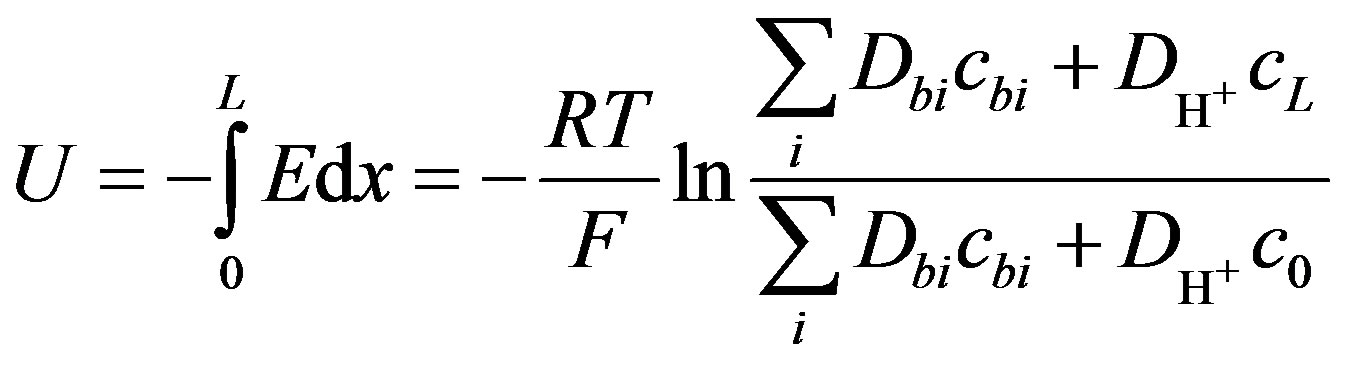 (14)
(14)
where c0 is the concentration of hydrogen ions at the anode, were x = 0, cL is the concentration of hydrogen ions at the cathode, were x = L.
Equation (14) points on buffers’ and rate of generations’ role in OCV. The concentration value of c0 can be calculated from Equations (11) and (13) and the OCV can be expressed by substituting this expression into Equation (14). Equation (14) can be simplified by assuming the same values for the diffusion coefficients of buffer and hydrogen ions (Equation (15)).
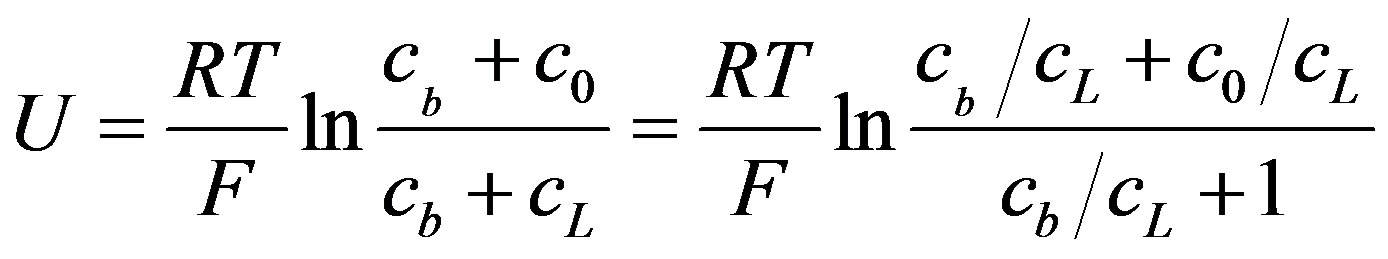 (15)
(15)
When buffer concentration is neglected OCV can be reduced to Equation (16)
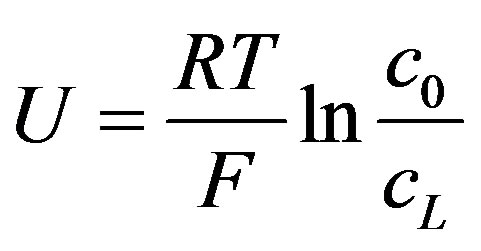 (16)
(16)
4. Results
4.1. Experimental Results
4.1.1. The Stability of the Enzyme Coupled to the Electrodes
The electrodes consisted of the enzyme glucose oxidase coupled to gold or silver coated carbon cloth through a carboxylic connection group.
The stability of the coupled enzyme with time is shown in Figure 2.
It is seen, that for at least 45 days the activity is stable, which indicate the suitability of the electrode to perform for long period of time.
4.1.2. OCV Obtained in Various Fuel Cell Conditions
The results of some voltage U measurements in open electrical circle are concentrated in the Table 1. In the
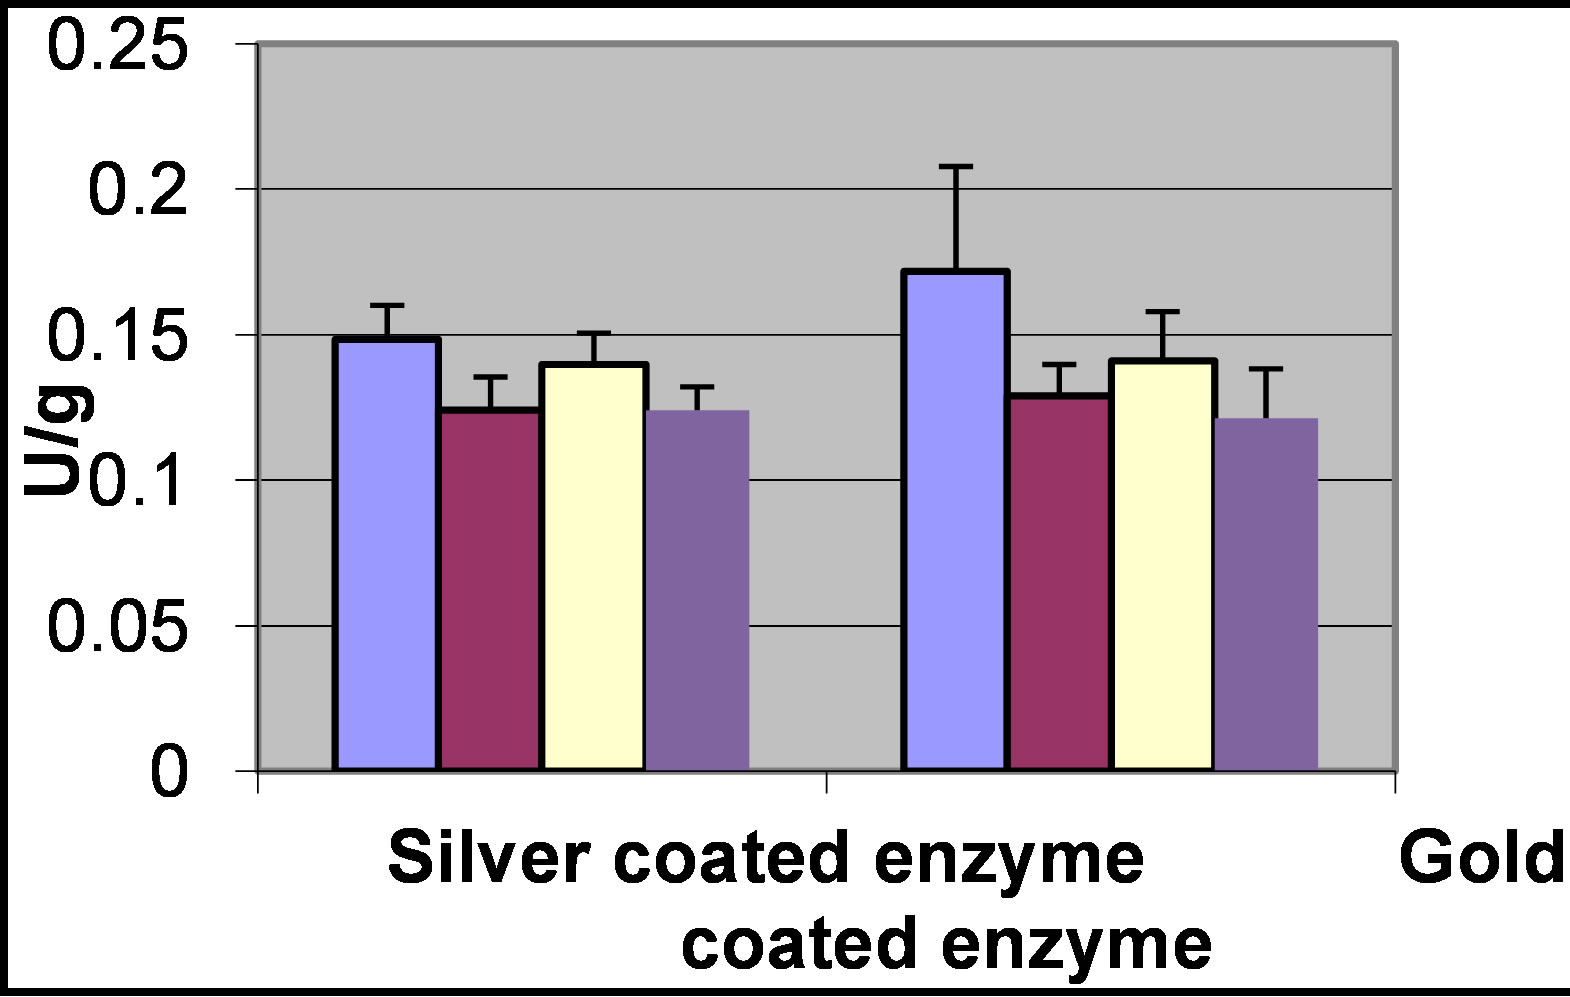
Figure 2. The enzyme activity of the electrodes over time. The electrodes consisted of glucose oxidase coupled to silver or gold coated carbon cloth. The activity was measured, from left to right, immediately after preparation of the electrode, and after 4, 7 and 45 days. The electrode was stored between the measurements in buffer phosphate at 4˚C.
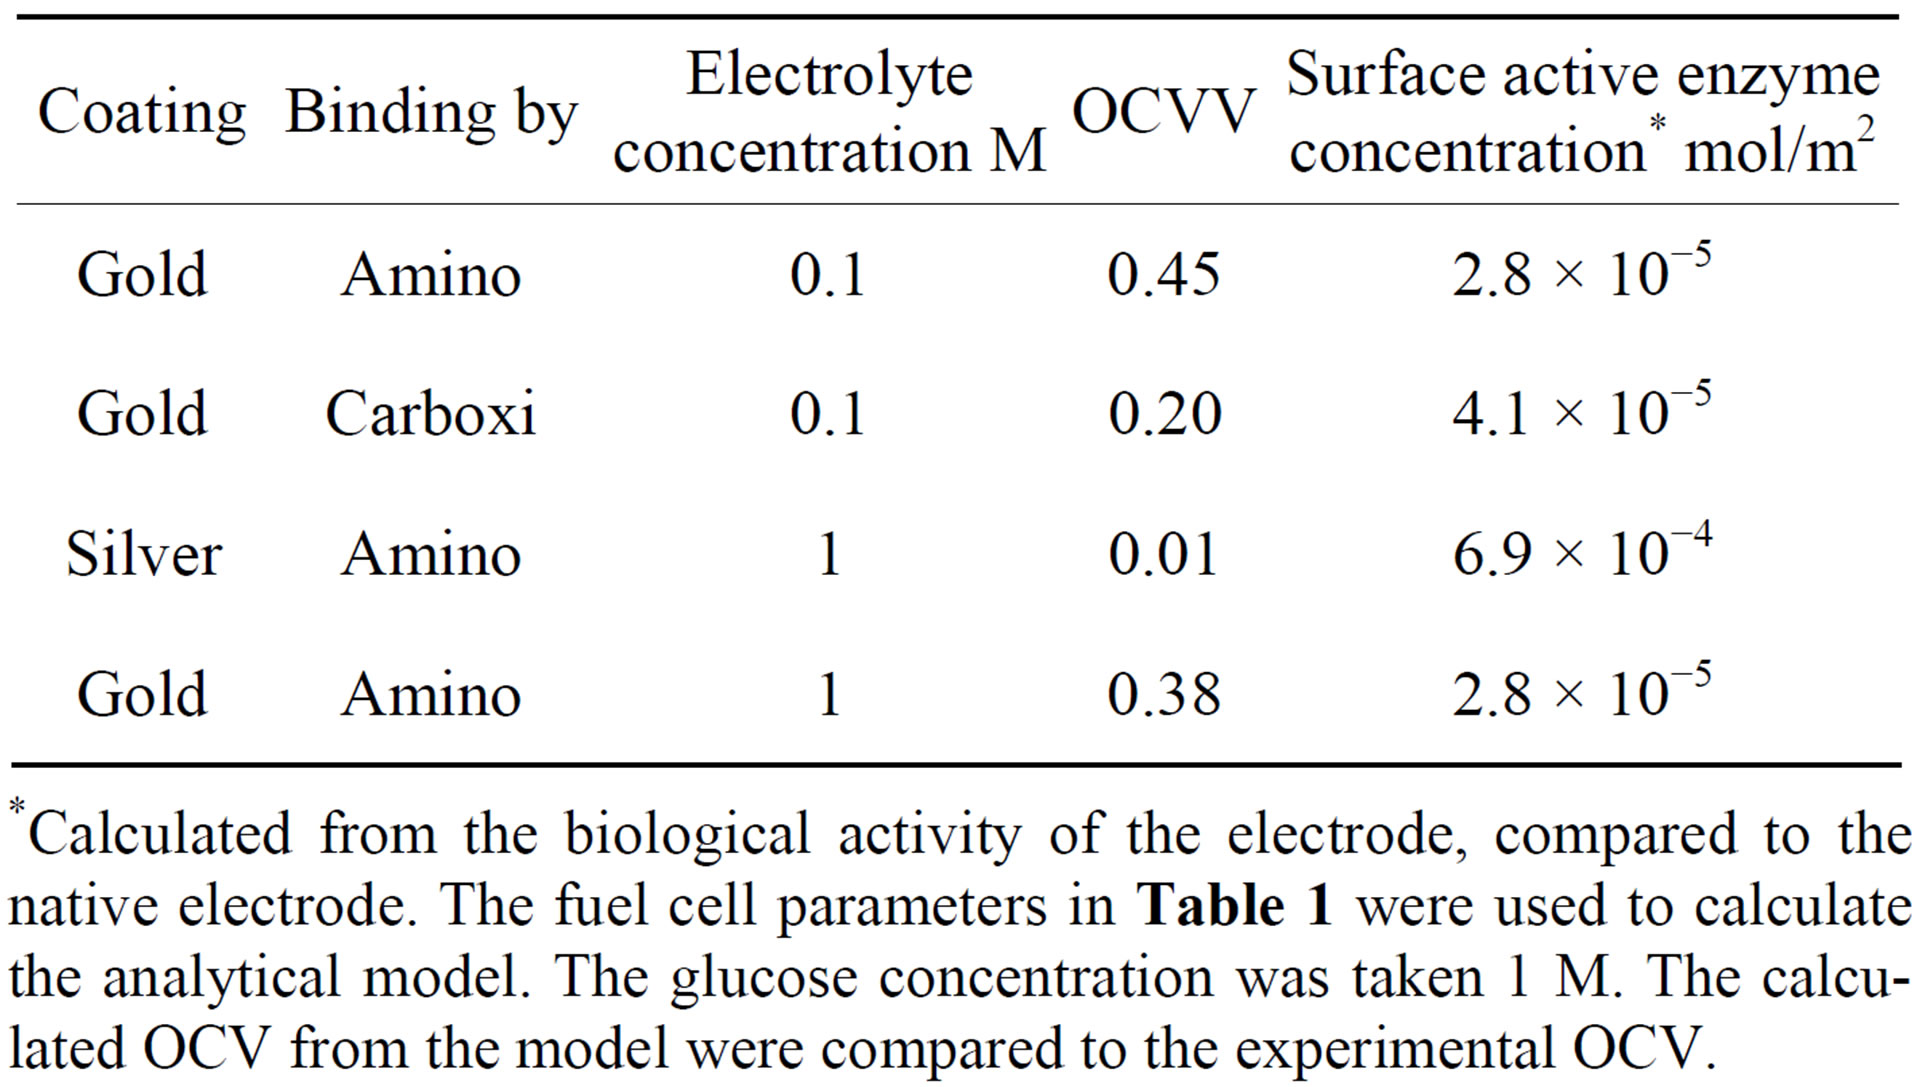
Table 1. OCV (Open Circuit Voltage) measurements of the enzyme fuel cell.
*Calculated from the biological activity of the electrode, compared to the native electrode. The fuel cell parameters in Table 1 were used to calculate the analytical model. The glucose concentration was taken 1 M. The calculated OCV from the model were compared to the experimental OCV.
various experiments the enzyme electrode type, its surface enzyme concentration, and the glucose and electrolyte concentration in the fuel cell are reported, with the OCV obtained at that conditions.
4.1.3. Hydrogen Ions Surface Generation
Equation (2) was adapted to surface generation by substituting Equation (8) into Equation (2), and expressing the surface enzyme concentration by the volume concentration, up to distance L01, from the anode 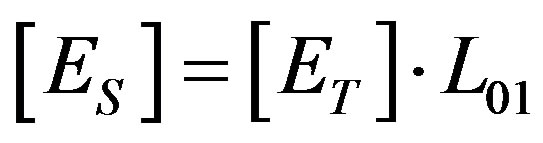 .
.
From Equation (17), the rate of hydrogen ions surface generation can be calculated, when the concentrations ([Es], [G]) and the kinetic enzyme reaction rates (kcat and KM) are known.
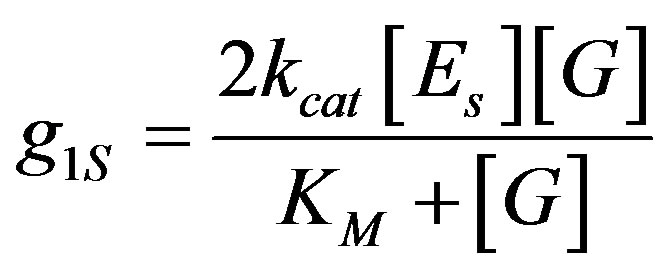 (17)
(17)
The kinetic enzyme reaction rate coefficients kcat was chosen from the very wide range of values [20-23] and KM were estimated from the experimental results in [24]: ,
, . The value of the experimental hydrogen ions surface generation
  was calculated for the experimental results parameters (Table 1): [ES] = 2.8´10−5, [G] = 1 M to be:
 . The diffusion coefficient in water was taken as
  [25]. From Equation (17) the dependence of surface hydrogen ions generation-g1s on glucose concentration is almost linear at low glucose concentration, and saturated at high glucose concentrations. To examine the dependence of the surface generation on the range of glucose concentration, g1S was calculated as a function of glucose concentration for different enzyme concentrations (Figure 3). For very low glucose concentration, below 0.02 M, the rate is almost linear with glucose concentration, but it became saturated already at relatively low glucose concentration. at 0.2 M it is 90% saturated. Hence, glucose concentration in the experimental condition has negligible effect on the reaction rate, and the generation rate for calculating hydrogen ions concentration by Equations (11) and (13) can be taken as the saturated values of g1s for the desired enzyme concentration.
The rate of surface ions generation depends linearly on surface enzyme concentration [ES], Equation (17). Here again, the minimal effect of glucose concentration range on the generation is noticed.
4.1.4. Estimation Values of L01
The value of the depletion parameter L01 has a huge influence on the calculated ions’ concentration in this model. Hence, it is very important to estimate it. Ions concentrations were calculated, using Equation (13), as a function of the distance from the anode. The estimated values of L01 for these calculations were from 10−6 m to 10−9 m. The value of hydrogen ions generation was taken from the saturated region in Figure 3. According to results L01 = 10‒9 m was taken for calculation. This assumption has a physical meaning because the size of an enzyme molecule is approximately 10−9 m, and the generation of hydrogen ions is taken place on the surface of the anode, and up to 10−9 m from it.
4.2. Hydrogen Ions Concentration between the Electrodes
The hydrogen ions are generating on the anode, moving towards the cathode and consumed on the cathode. As a result, a gradient of hydrogen ions is obtained between the electrodes. The voltage obtained on the fuel cell is a function of this gradient of hydrogen ions, hence it is important to examine this phenomenon. The hydrogen ions concentration in the bulk was calculated by Equa-
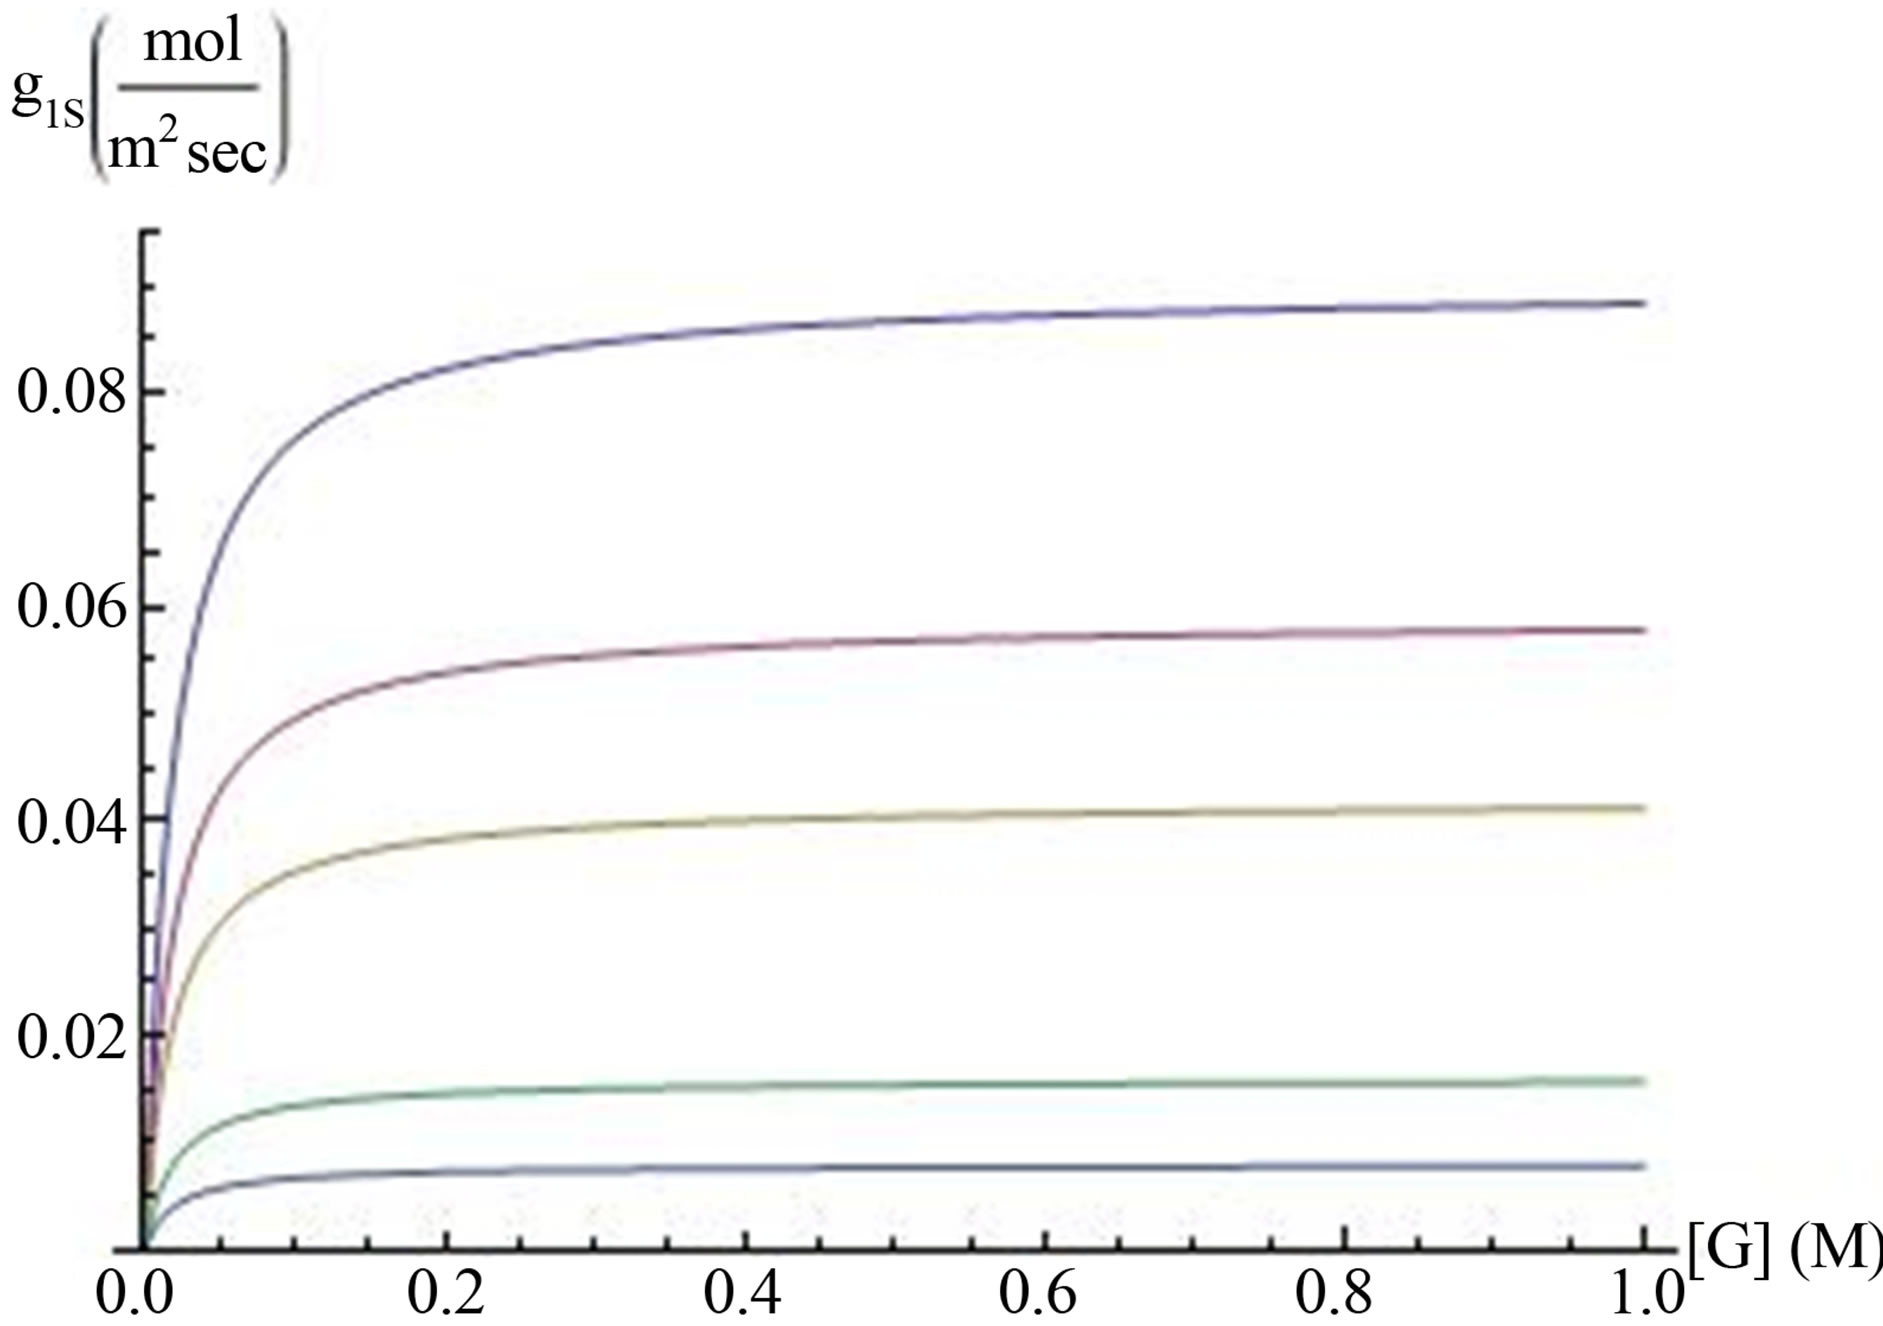
Figure 3. Hydrogen’s ions surface generation g1S (axis y) is plotted against glucose concentration (M) (axis x), for different enzyme surface concentrations. From the top to the bottom line the surface enzyme concentration were taken as 2.85 ´ 10‒5 mol·m‒2, 1.87 ´ 10−5 mol·m‒2, 1.31 ´ 10‒5 mol·m‒2, 0.5 ´ 10‒5 mol·m‒2 and in the bottom lines 0.25 ´ 10‒5 mol×m‒2, respectively.
tion (13). The concentrations as a function of the distance from the anode, (Figure 4) are plotted for different values of surface generation, which were taken from the saturation values in Figure 3.
Figure 4 shows that decreasing rate of generation— —leads to decrease surface hydrogen ions concentration on the anode, as expected from this equation. To see the effect of the boundary condition cL, the hydrogen ions concentration was calculated for several cL values. The results showed that the concentration not only decrease near the cathode, as already determined by cL values, but also through the whole distance between the anode and cathode and on the anode itself. This is due to the effect of cL, as an individual term in Equations (11) and (13).
4.3. Open Circuit Voltage (OCV)
4.3.1. OCV Dependence on Buffer Concentration
Open Circuit Voltage (OCV) is an important parameter of fuel cells. In this case .
.
The OCV, in Equations (14) and (15), depends on the hydrogen ions concentration on the anode—c0—and on the cathode—cL hence on the gradient of hydrogen ions between the electrodes. As the concentration on the cathode—cL—decreases, OCV increases. As the concentration on the anode c0 increases, OCV increases. The OCV depends also on buffer concentration .Since in Equations (14) and (15) the buffer concentration is added both to the cathode concentration term (in the numerator) and to the anode concentration term (in the denominator), when a buffer concentration cb is decreasing the voltage is increasing. Hence, the maximum OCV can be obtained by neglecting the buffer concentration, as in Equation (16).
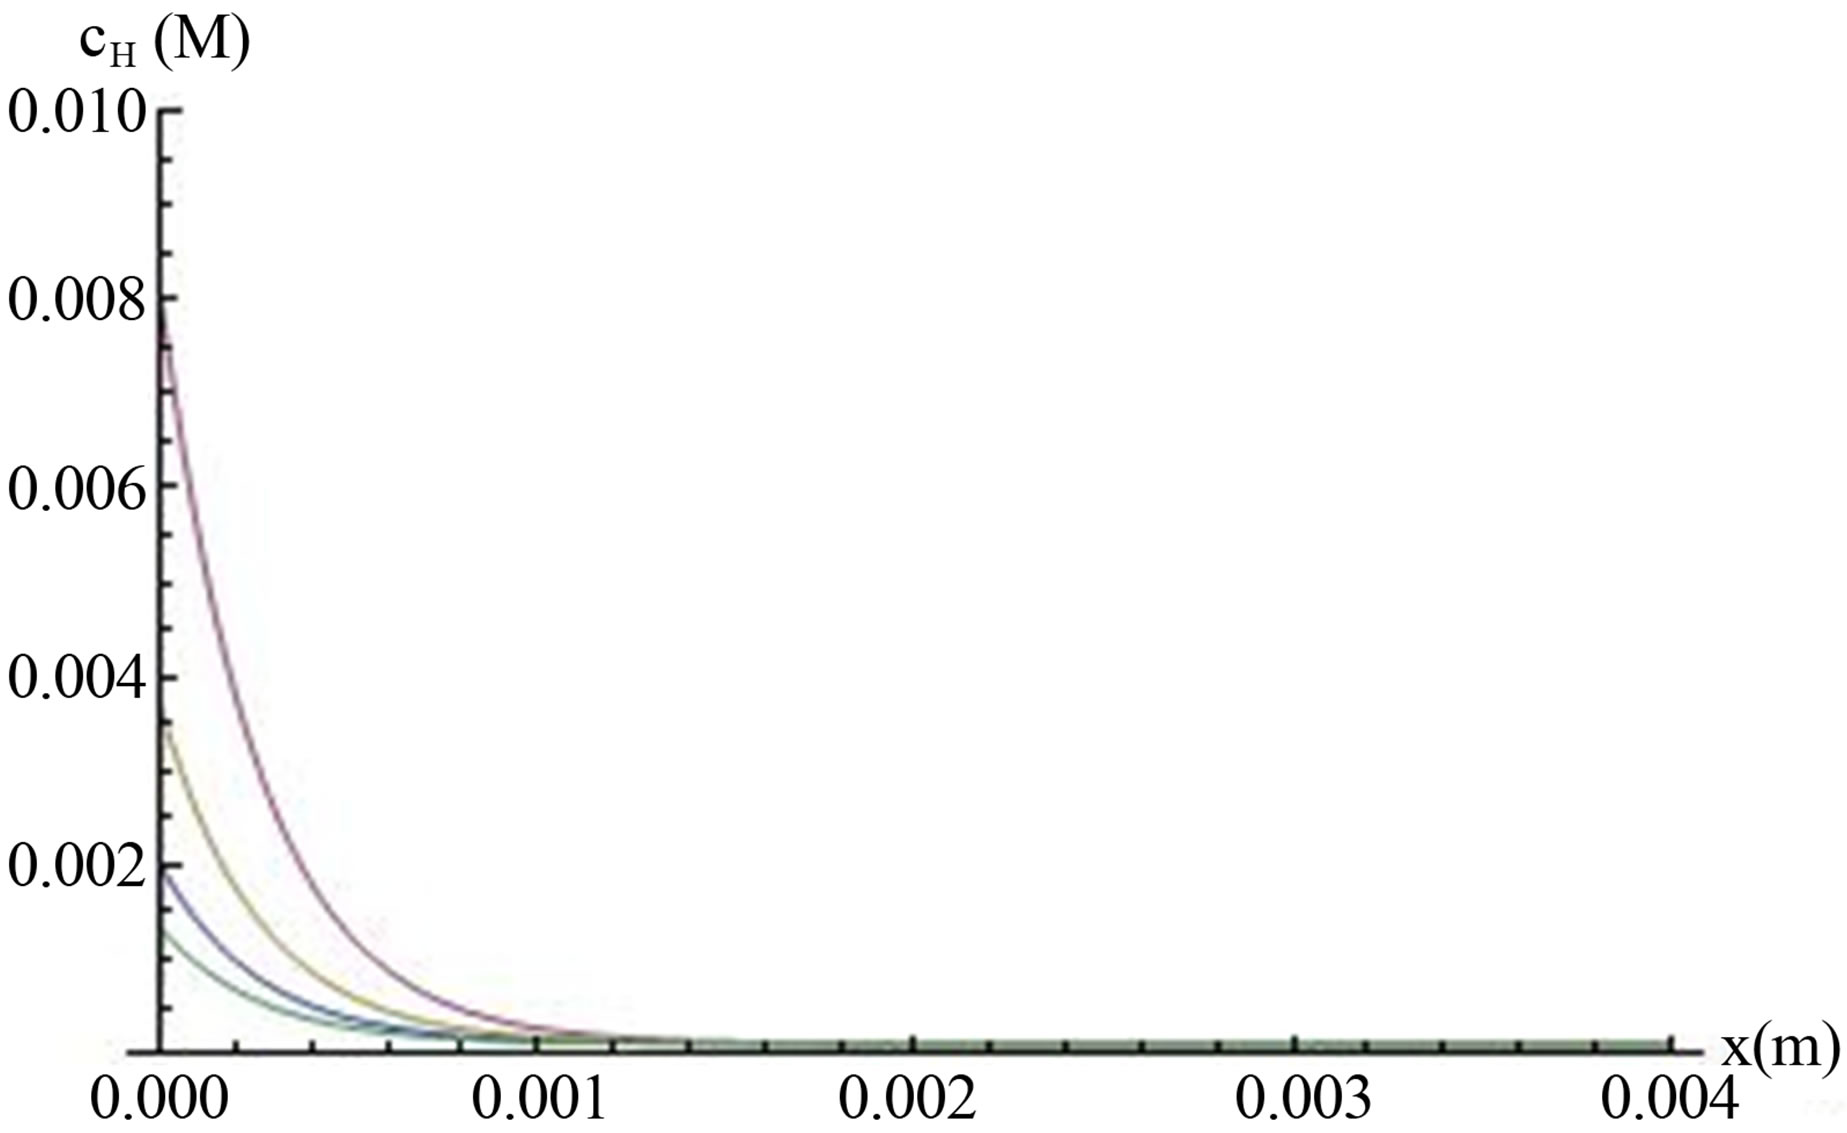
Figure 4. The concentration of hydrogen ions (mol×m‒3) in fuel cell (Equation (14)) is plotted against distance from the anode for different hydrogen ions generation rates. cL = 0.0001 M, L01 = 10‒9 m, E = 100 V/m. Lines from top to the bottom: g1s = 0.087 mol/(sec·m2), 0.036 mol/(sec·m2), 0.016 mol/ (sec·m2), 0.006 mol/(sec·m2). The electric field E was calculated from the open-circuit voltage U of the fuel cell by E = U/L. When the parameter is unknown, as in our fuel cell, cL has to be chosen as the boundary condition, so its value will fit the experimental results of OCV.
In this case, the OCV depends only on the ratio of the electrodes ion concentrations. The calculation of the voltage obtained as function of buffer concentration (Equation (15)), and the maximum OCV when the buffer is neglected (Equation (16) is shown (Figure 5)).
It is shown that when the buffer concentration is neglected (Equation 16), the voltage is determined entirely by the hydrogen ions gradient. When buffer concentration is considered (Equation (15)), not only that the voltage decreases with increasing buffer concentration, but at as low as 0.01 M the two graphs with different hydrogen ions gradient are coincided to one. It can be explained by the fact that the buffer screens the effect of the hydrogen ions gradient through the electrodes. Hence the buffer concentration should be kept as minimal as possible to provide, on one hand, optimal environmental condition to the enzyme, without interfering, on the other hand, with obtaining the voltage. The decrease in voltage with increasing buffer concentration is in agreement with the experimental results (Table 1).
4.3.2. OCV Dependence on Glucose Concentration
In order to express OCV (Equation (15)) as a function of glucose concentration, the following propositions are followed: From Equation (13), c0 is in proportion with the surface generation, hence
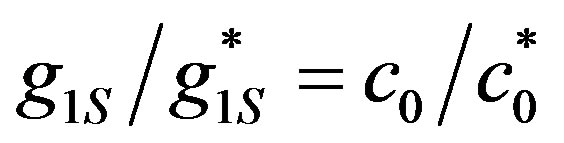 (18)
(18)
were  is the boundary hydrogen ions concentration on the anode obtained for the surface generation value
  (Figure 3).
  is the calculated value of hydrogen ions surface generation for the experimental results parameters (Table 1). Equations (17) and (18) are substituted in Equation (15).
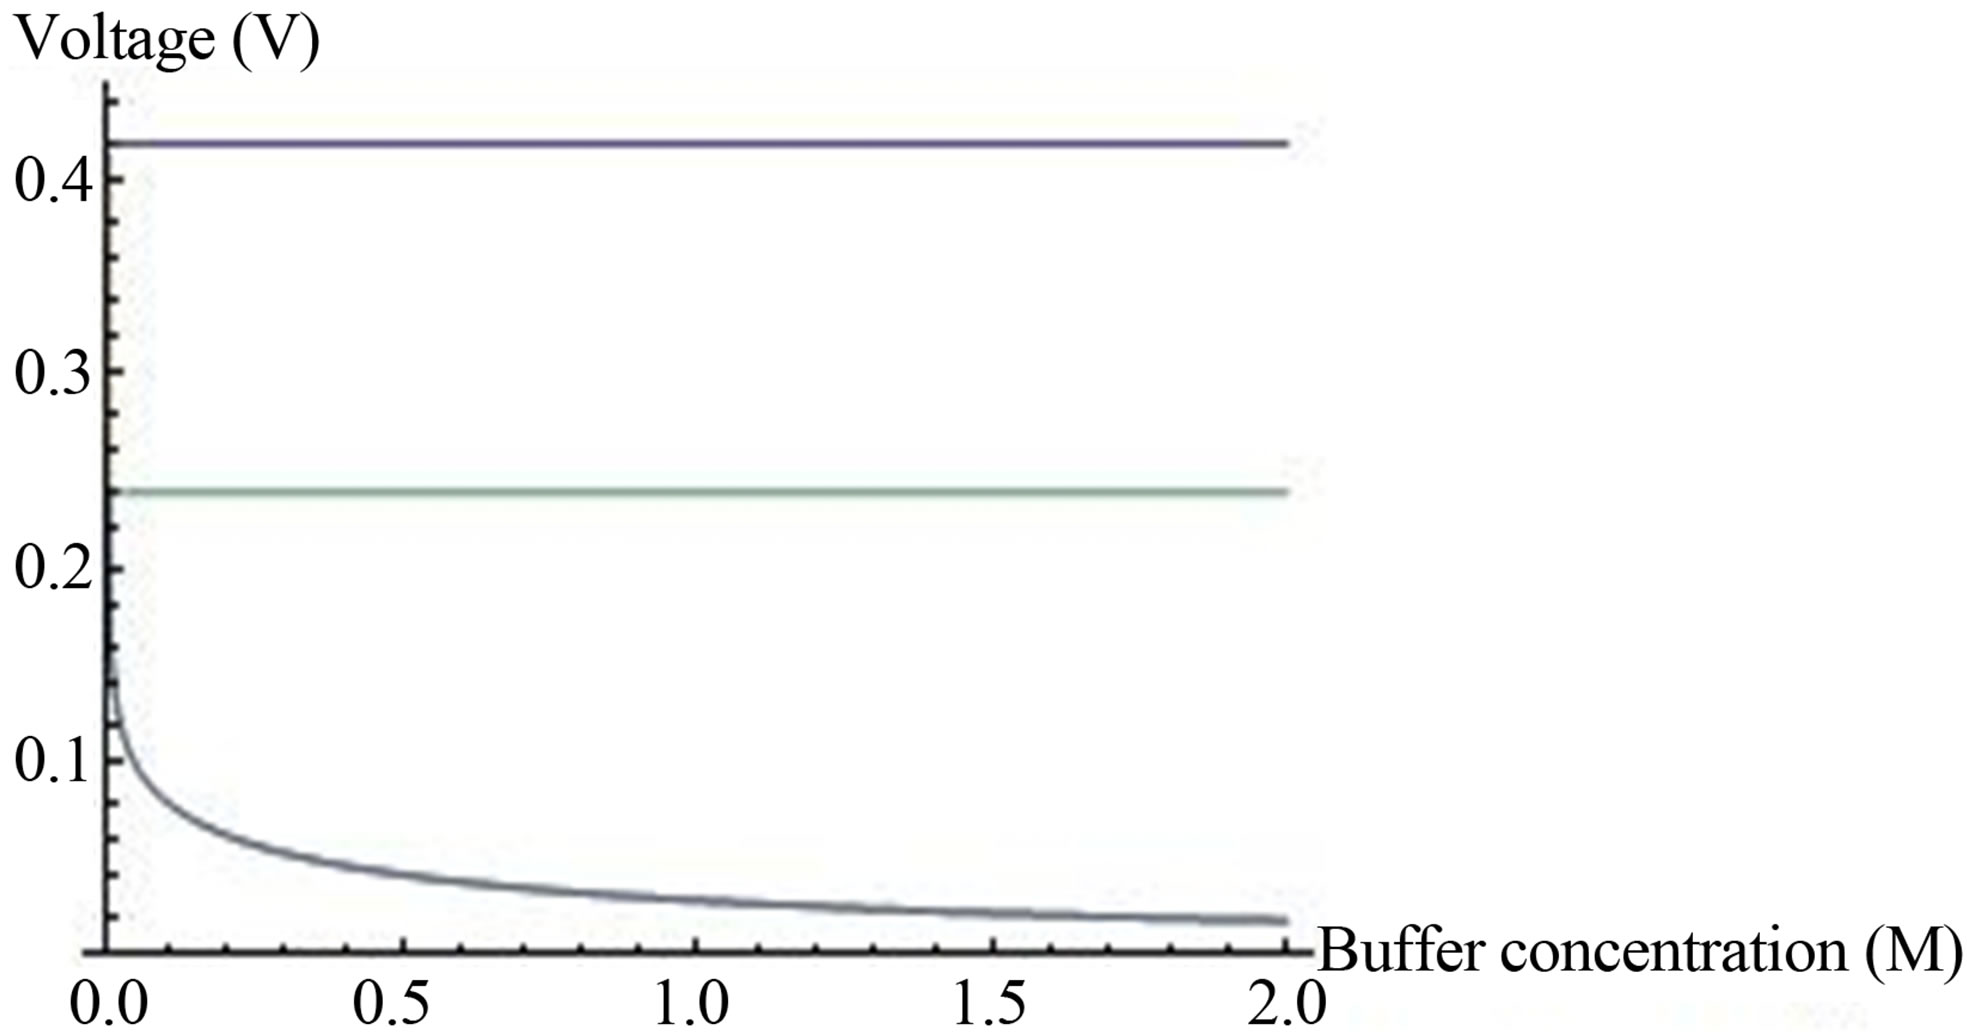
Figure 5. OCV, (V, axis y), is plotted against buffer concentration (M, axis x) for two cases, when buffer concentration is taken into account (Equation (15)) and when the buffer concentration is neglected (Equation (16)). c0 = 0.002 M (from Figure 3). The lines from top to bottom:  (Equation (16)),
  , (Equation (16),
  (Equation (15)),
  (Equation (15)). Both lines of Equation (15) are coincided in the bottom’s line of the graph.
The obtained Equation (19) reveals the dependence of OCV on glucose and enzyme concentrations.
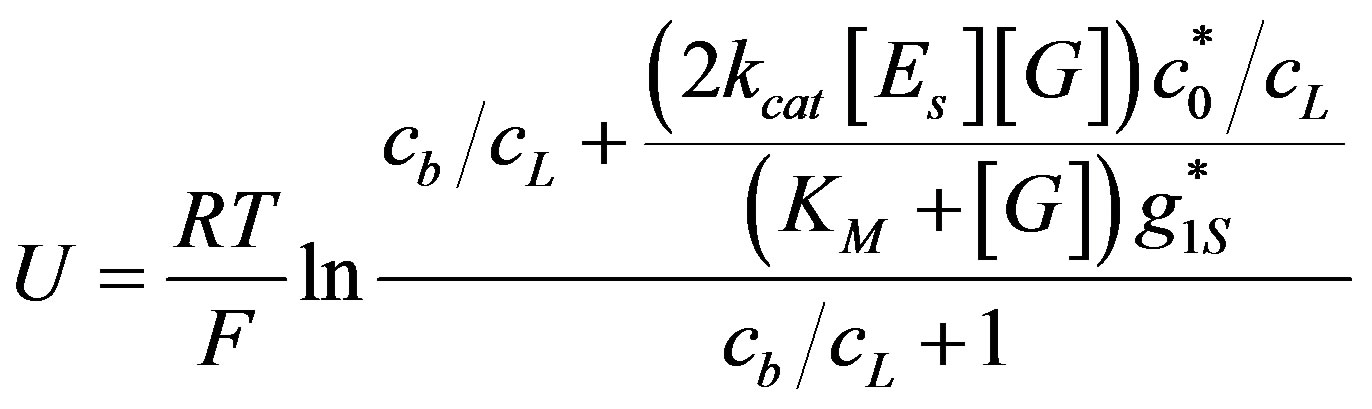 (19)
(19)
The OCV as a function of glucose concentration is plotted in Figure 6" target="_self"> Figure 6 up to 0.01 M.
The voltage is saturated in the experimental concentration range of glucose. It happened because the rate of ions generation almost saturated by glucose in this range of glucose concentrations. Hence, the same OCV can be obtained in lower glucose concentrations, which contribute to the efficiency of the enzymatic fuel cell.
4.3.3. OCV Dependence on Enzyme Concentration
The numerator in the expression for OCV (Equation (19)) composes of two terms: the first term depends on buffer concentration, and the second term depends, aside from enzyme concentration, on  . When the second term predominates, due to high value of
 , the OCV is logarithmic with enzyme concentration, as shown in Figure 7, top line. When the value of
  is low (bottom line in Figure 7), the dependence of OCV on enzyme concentration is not logarithmic for the entire range of enzyme concentrations. Only in high enzyme concentration, relative to buffer concentration, a logarithmic dependence exists. The voltage was calculated up to enzyme concentration of 0.01 mol/m2, which gave OCV of 0.505 V, the maximal theoretical fuel cell standard potential, for the electrochemical reaction of the fuel cell. Hence the fuel cell voltage can be increased up near its theoretical value, by increasing the surface enzyme concentration. This can be done, until a full coverage of the surface is achieved. Further increase in surface enzyme concentration can be achieved only by increasing the porosity of the electrode.
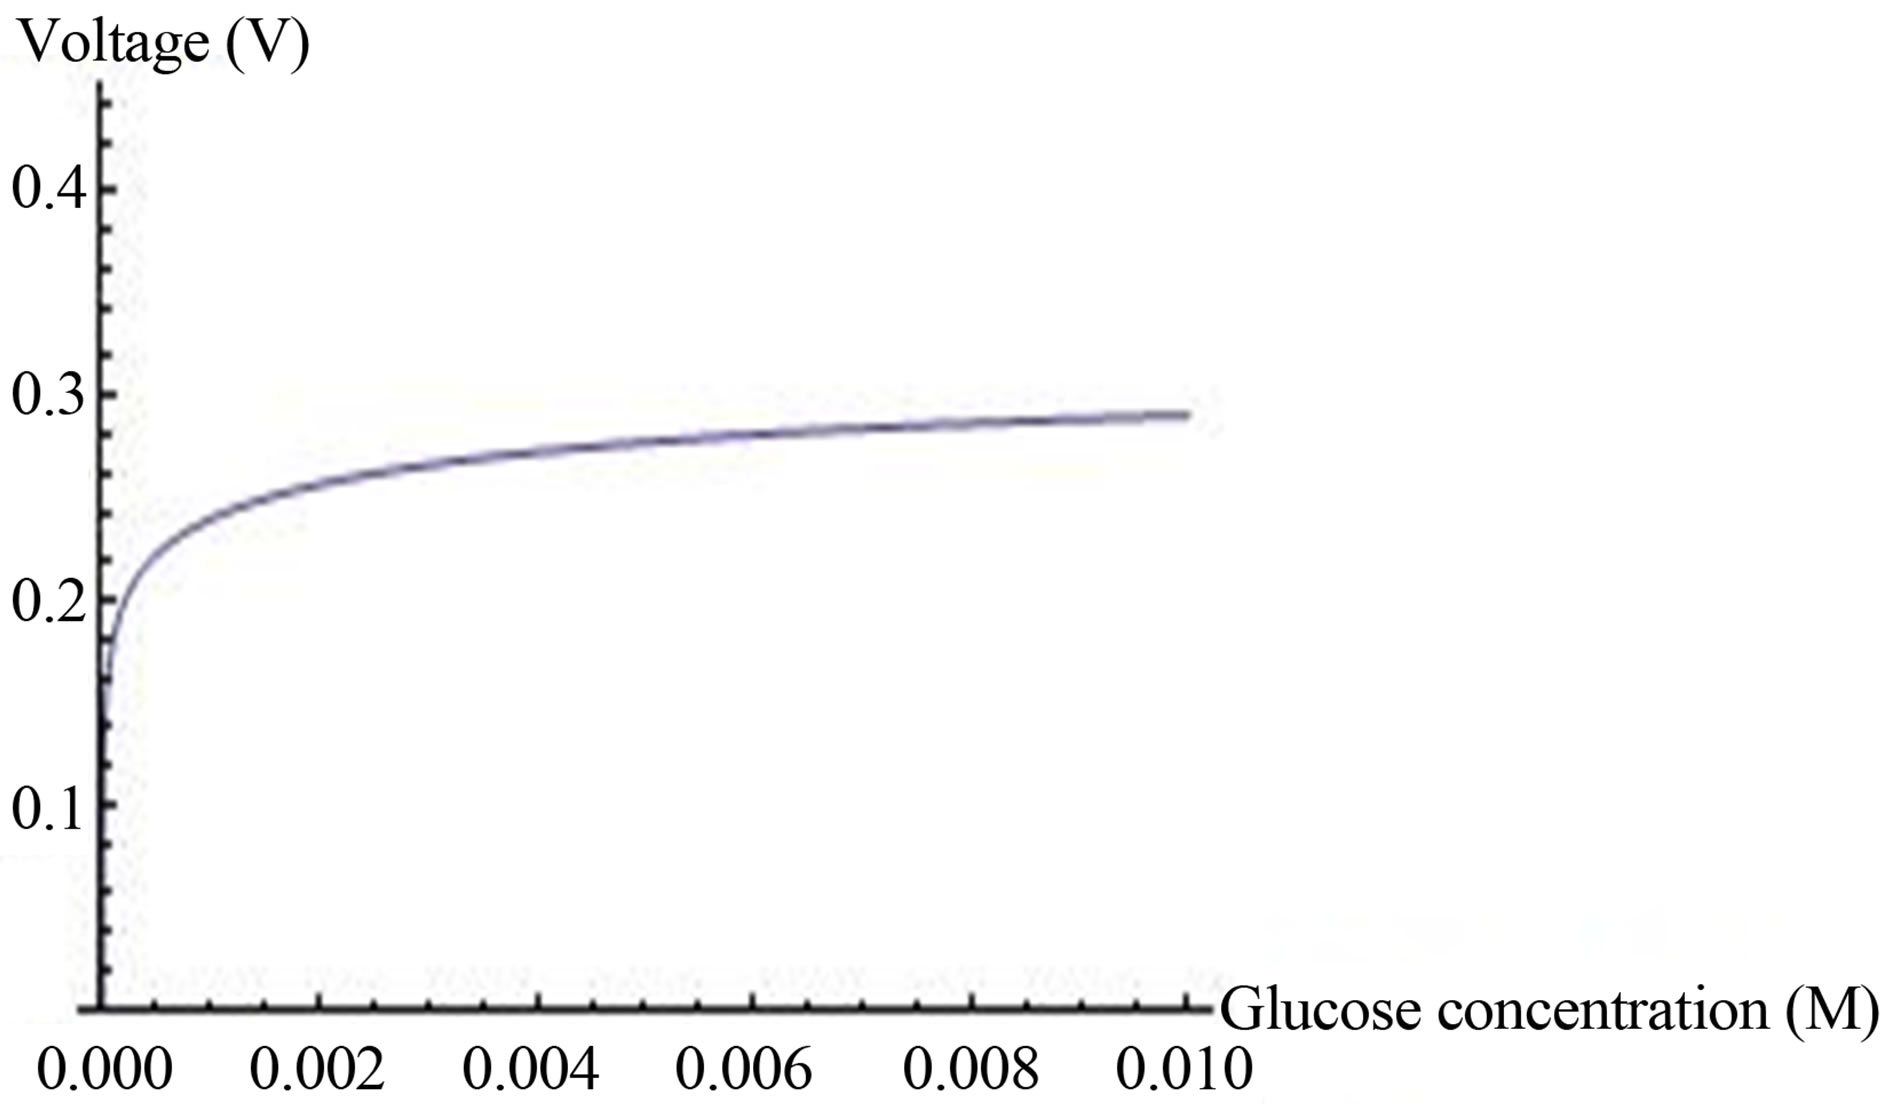
Figure 6. Voltage (Equation (15)) (axis y, (V), as a function of glucose concentration axis x, kcat = 1.6 × 10³ sec−5, KM = 0.019 M, [ES] = 2.8 × 10⁻⁵ mol/m2, C0* = 0.019 M,  ,
, .
.
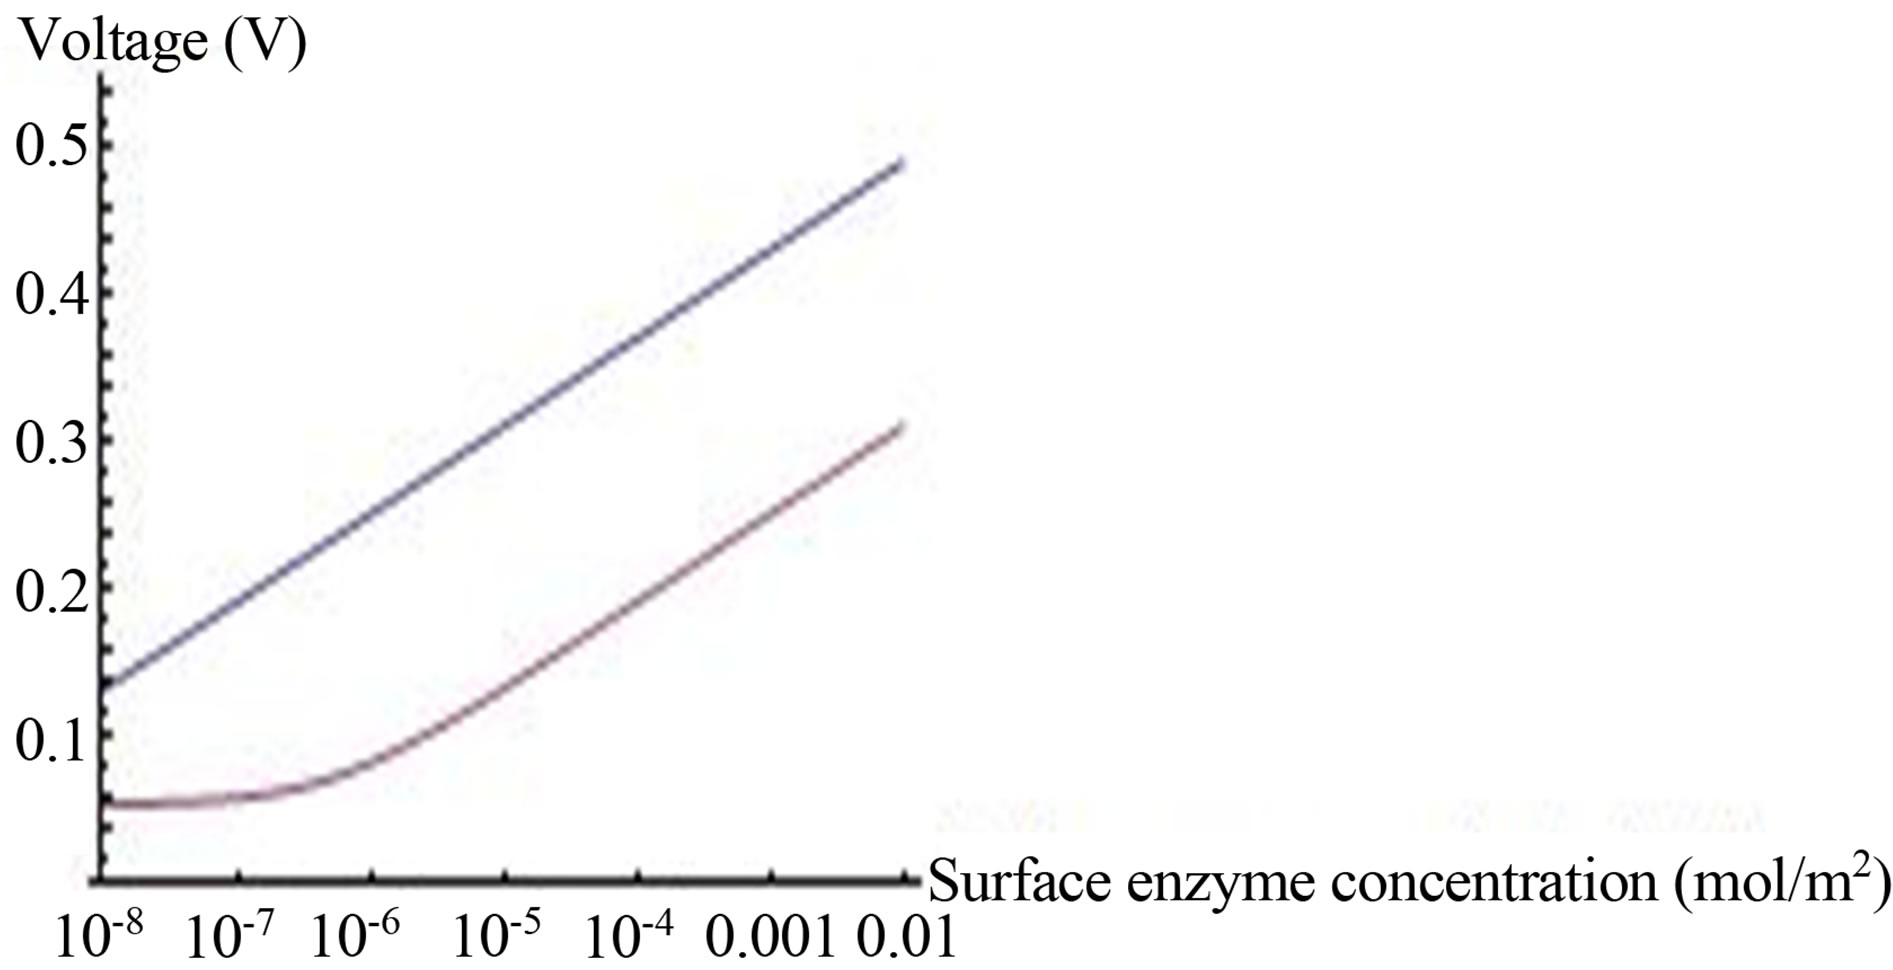
Figure 7. Voltage (Equation (19) (axis y, (V)) as a function of enzyme concentration (axis x, ES mol/m2, kcat = 1.6 × 10³ sec−1, KM = 0.019 M, L = 0.004 m, L10 = 10−9, C0* = 0.019 M, . Top line
  , bottom line
 .
.
5. Discussion
Usually the maximum voltage is not obtained, due to several limitation of the fuel cell. In the extensive experimental work done on fuel cells, several parameters of the fuel cell are investigated, in order to increase the voltage. Using a simple analytical model enables investigating the effect of various parameters of the fuel cell on the voltage accepted. In this paper, a simple analytical model of a glucose fuel cell, with enzymatic catalyzed anode and an enzymatic or chemical catalyzed cathode is brought up.
Generation and consumption functions. The model suggests mathematical exponential functions to approximate the rate of generation and consumption. The exponential functions include a depletion coefficient, whose values estimate the distance from the electrode, were the generation or consumption rates are significantly decreases. The value of the depletion coefficient was found to be 10‒9 m. This value has a physical meaning, since it is approximately the size of an enzyme molecule.
In our fuel cell, the cathode was a bare carbon cloth, with no chemical reactivity, hence, the consumption reaction is unknown. In this case, a simplified version of the model was used (Equation (13)) and the boundary concentration cL was chosen arbitrarily. These two processes, generation and consumption, determined the hydrogen ions gradient in the fuel cell, and as a result, they determined the OCV.
Effect of glucose and enzyme concentrations. The expression for surface hydrogen ions generation (Equation (17)) was adapted for the enzymatic anode by substituting enzyme surface concentration into Michaelis Menten equation, and substituting the kinetic parameters for the enzyme glucose oxidase from the literature. It was found (Figure 3) that the generation was increasing at very low glucose concentration and reached 90% of saturation value at 0.2 M glucose. Hence, glucose concentration can be decreased without affecting the efficiency of the fuel cell.
On the other hand, the effect of enzyme concentration is linear with generation rate, hence increasing enzyme concentration has an important effect on the fuel cell.
Ratio of the hydrogen ions concentration on electrodes c0/cL. The ratio c0/cL can be obtained from Equation (11) and (13). The ratio c0/cL increases with increasing the rate of generation or consumption. This has a physical meaning, because the hydrogen ions concentrations on the electrodes are determined by the generation and consumption rates on the electrodes.
The OCV Equations (14)-(16), (19) were developed using the expressions obtained for the hydrogen ions concentration near the electrodes. The OCV depends logarithmically on the ratio of hydrogen ions concentration near the electrodes—c0/cL. Hence, increasing the rate of hydrogen ions generation and (or) consumption by enzyme or chemical reactions leads to higher value of OCV.
Buffer concentration effect: The Equations (14), (15), (19) points also on the role of buffer on OCV. Increased buffer concentration screens the concentrations ratio between the electrodes, and hence, the voltage is decreasing. The effect of the buffer concentration can be shown by omitting it completely from expression Equation (16), which results in obtaining the highest OCV. These calculated results are in a good agreement with measurements. Generally, buffer phosphate is needed for the optimum biological activities, hence, it must be included, but its concentration should be carefully determined.
The effect of glucose and enzyme concentrations on OCV: The hydrogen ions surface generation g1S (Equation (17)) depends on glucose concentration and on surface enzyme concentration [ES]. Hydrogen ions surface generation increases, eventually, to a constant value that is independent of further increase in glucose concentration (Figure 3). In agreement with this conclusion an OCV almost doesn’t change in interesting range of glucose concentration (Figure 6). Hence, the same OCV can be obtained in lower glucose concentrations, which contribute to the efficiency of the enzymatic fuel cell.The fuel cell OCV reaches saturation with glucose concentration. Further increase in OCV is feasible only by increasing enzyme concentration. OCV increases logarithmically with surface enzyme concentration (Figure 7) according to Equation (19).
6. Conclusions
The useful analytical model for an enzymatic glucose-fuelled fuel cell was developed. Hydrogen ions generation was adapted for surface generation since the enzyme is coupled to the surface of the electrode. This enables calculating hydrogen ions concentration as a result of the surface ions generation.
The analytical calculations, for various parameters of the analytical model are in agreement with the experimental results.
The analytical model points out the role of a buffer in the open circle voltage. When a buffer concentration is rising, the voltage is decreasing. OCV reaches saturation from glucose concentration of 0.02 M. Hence, adequate OCV can be obtained at low glucose concentration.
The OCV increased logarithmically, up to the theoretical value received from Gibbs energy, with increasing enzyme surface concentration. Hence OCV can be increased by increasing electrode surface and by increasing its porosity. Increasing the catalytic power of the electrodes, which increases the rate of hydrogen ions generation and (or) consumption by enzyme or chemical reactions leads to a higher value of OCV.
7. Acknowledgements
This study was supported by a grant from the ORT Braude College research committee. The technical assistance of Mrs. J. Bassan and Mrs. R. Asakla are acknowledged.
REFERENCES
- Z. Rubin and L. Mor, “Electrode Resistance Dependence on Alkaline Glucose Fuel Cell Electrolyte Concentration,” Proceedings of the International Conference of Fundamentals and Developments of Fuel Cells, Nancy, December 2008, pp. 115-116.
- E. Bubis, L. Mor, N. Sabag, Z. Rubin, U. Vaysban, et al., “Electrical Characterization of a Glucose-Fueled Alkaline Fuel Cell,” Proceedings of the 4th International ASME Conference on Fuel Cell Science, Engineering and Technology, FuelCell2006, Irvine, Vol. 2006, 2006, 8 p.
- L. Mor, Z. Rubin and P. Schechner, “Measuring Open Circuit Voltage in Glucose Alkaline Fuel Cell Operated as a Continuous Stirred Tank Reactor,” Journal of Fuel Cell Science and Technology, Vol. 5, No. 1, 2008, Article ID: 014503.
- V. (Zeev) Rubin and L. Mor, “Physical Models of the Conductivity in Glucose Alkaline Fuel Cell,” 221st ECS Meeting Seattle, Washington, 6-10 May 2012, p. 61.
- L. Mor and V. Rubin, “Experimental and Theoretical Considerations of Electrolyte Conductivity in Glucose Alkaline Fuel Cell,” Circuits and Systems, Vol. 3, No. 1, 2012, pp. 111-117.
- J. Ge, R. Schirhagl and R. N. Zare, “Glucose-Driven Fuel Cell Constructed from Enzymes and Filter Paper,” Journal of Chemical Education, Vol. 88, No. 9, 2011, pp. 1283-1286. http://dx.doi.org/10.1021/ed100967j
- I. Ivanov, T. Vidacovic-Koch and K. Sundmacher, “Recent Advances in Enzymatic Fuel Cells: Experiments and Modelling,” Energies, Vol. 3, No. 4, 2010, pp. 803-846. http://dx.doi.org/10.3390/en3040803
- A. S. Bedekar, J. J. Feng, S. Krishanamoorthy, K. G. Lim, G. T. R. Palmore and S. O. Sundaram, “Limitation in Microfludic Biofuel Cells,” Chemical Engineering Communications, Vol. 195, No. 3, 2008, pp. 256-266. http://dx.doi.org/10.1080/00986440701569036
- E. Kjeang, D. Sinton and D. A. Harrigton, “Strategic Enzyme Patterning for Microfluidic Biofuel Cells,” Journal of Power Sources, Vol. 158, No. 1, 2006, pp. 1-12.
- S. W. Jeon, J. Y. Lee, J. H. Lee, et al., “Optimization of Cell Conditions for Enzymatic Fuel Cell Using Statistical Analysis,” Journal of Industrial and Engineering Chemistry, Vol. 14, No. 3, 2008, pp. 338-343.
- D. J. Glycys and S. Banta, “Metabolic Control Analisis of an Enzymatic Biofuel Cell,” Biotechnology and Bioengineering, Vol. 102, No. 6, 2009, pp. 1624-1635. http://dx.doi.org/10.1002/bit.22199
- A. S. Bedekar, J. J. Feng, K. Lim, S. Krishanamoorthy, G. T. R. Palmore and S. Sundaram, “Computational Analysis of Microfludic Biofuel Cells,” Austin, TX, United, 2004.
- A. Zebda, C. Innocent, et al., “Enzyme-Based Microfluidic Biofuel Cell to Generate Micropower,” In: C. M. Drapcho, N. P. Nhuan, T. H. Walker, Eds., Biofuels Engineering. Process Technology, Graw Hill, New York, 2008, pp. 574-576.
- R. P. Pinto, B. Sprinivasan, et al., “A Two-Population BioElectrochemical Model of Microbial Fuel Cell,” Bioresource Technology, Vol. 101, No. 4, 2010, pp. 5256-5265. http://dx.doi.org/10.1016/j.biortech.2010.01.122
- A. Z. Weber and T. Ikeda, “Modeling Transport in Polymer Electrolyte Fuel Cells,” Chemical Reviews, Vol. 104, No. 10, 2004, pp. 4679-4726.
- P. N. Barlett, et al., “Modeling Biosensor Responses,” Bioelectrochemistry, Wiley, England, 2008, pp. 267-325.
- Enzyme Kinetics. web.virginia.edu/Heidi/…/chp14.htm
- G. S. Erzinger, M. M. Silveira, M. Vitolo and R. Jonas, “Determination of Glucose-Fructose Oxidoreductase Activity in Whole Cells,” World Journal of Microbiology and Biotechnology, Vol. 1, No. 12, 1996, pp. 22-24.
- A. J. Bard and L. R. Faulkner, “Electrochemical Methods,” 2nd Edition, J. Wiley & Sons, New York, 2001.
- Jens Hagen, “Industrial Catalysis: A Practical Approach,” 2nd Edition, WILEY-VCH, 2006.
- J. Kulys, L. Tetianec and P. Schneider, “Specificity and Kinetic Parameters of Recombinant Microdochium nivale carbohydrate Oxidase,” Journal of Molecular Catalysis B: Enzymatic, Vol. 13, No. 4-6, 2001, pp. 95-101. http://dx.doi.org/10.1016/S1381-1177(00)00233-2
- J.-X. Shi and X.-En Zhang, “Improvement of Homogeneity of Analytical Biodevices by Gene Manipulation,” Analytical Chemistry, Vol. 76, No. 3, 2004, pp. 632-638. http://dx.doi.org/10.1021/ac020796f
- V. Tegoulia, B. B. Gnedenko and A. D. Ryabov, “Ferricenium Salts Instead of Dioxygen in Glucose Oxidase Catalysis,” Biochemistry and molecular biology, International, Vol. 31, No. 4, 1993, p. 769.
- N. Eryomin, L. A. Zhukovskaya and R. V. Mikhailova, “Effect of Salts and Triton X-100 on Ultrafiltration Purification and Properties of Extracellular Glucose Oxidase,” Applied Biochemistry and Microbiology, Vol. 45, No. 3, 2009, p. 248.
- E. L. Cussler, “Diffusion—Mass Transfer in Fluid Systems,” Cambridge University Press, Cambridge, 1984.