Journal of Transportation Technologies
Vol.06 No.02(2016), Article ID:63425,10 pages
10.4236/jtts.2016.62007
Identifying Smartphone Based Intelligent Messages for Worker’s Crossing in Work Zones
Fengxiang Qiao, Ruksana Rahman, Qing Li, Lei Yu
Innovative Transportation Research Institute, Texas Southern University, Houston, TX, USA

Copyright © 2016 by authors and Scientific Research Publishing Inc.
This work is licensed under the Creative Commons Attribution International License (CC BY).
http://creativecommons.org/licenses/by/4.0/


Received 24 December 2015; accepted 13 February 2016; published 16 February 2016
ABSTRACT
A smartphone warning system is a feasible option to notify motorists about a safety threat and/or pedestrian crossings ahead. In this paper, a smartphone-based warning system was proposed to enhance workers’ safety in work zones. Three different warning message systems, including sound, male voice and female voice, were designed to alert drivers. Twenty-four subjects were recruited for a total of ninety-six rounds driving simulator test in a work zone to investigate the impacts of smartphone-based warning messages on subjects’ driving performance, in terms of driving speed, speed variation, acceleration, and brake reaction distance. The outcome showed that, with the assistance of the sound and voice (either female or male) warning messages, drivers could effectively reduce their accelerations and speeds. Meanwhile, such a warning system can induce subjects to shorten their brake reaction distances for worker crossings. All participants found that this warning system is applicable to enhance their defensive driving behaviors while driving through a work zone.
Keywords:
Simulator Test, Smartphone Messages, Vehicle-to-Infrastructure (V2I), Work Zones

1. Introduction
The invention of the first automobile by Benz in 1886 [1] followed by Ford’s improvement in 1908 [2] , enabled people’s accessibility through roadway transportation all over the world. For years, significant development had been achieved in terms of the improved reliability, safety and performance of motorized vehicle. However, in both developing and developed countries, transport related human fatalities, economic loss and environmental impacts have increased staggeringly in recent decades. As a significant portion of the United States infrastructure reaches the end of its life cycle [3] , maintenance works have been undertaken all the time. Work zones are becoming more prevalent. The increasing number of crashes in work zones continues to draw attentions of current safety measures. It is calculated that road users approximately find an active work zone out of every hundred miles driven on the national highway system [4] . In 2010, there were 87,606 work zone crashes nationwide and 37,476 related injuries to drivers and workers. Unfortunately, on an average, there was one injury caused at every 14 minutes in 2010 [5] . Road construction workers are the most vulnerable due to the moving traffic in construction road zones. According to the United States Department of Transportation (USDOT), more than 20,000 people experience work-related injuries in road construction zones each year [6] . In the roadway construction worksites, the main causes of injury and death of workers are run-overs/back-overs (often by dump trucks), collisions between moving construction vehicles and equipment, caught in between or struck by objects [6] [7] . The majority of work zone crash related research identified the activity (work) area as the most hazardous crash location [8] [9] . [10] and [11] investigated that 70% and 80% of crashes, respectively occurred in the activity area. Existing studies in work zones are inadequate to capture the impacts of the great variability in lengths of each work zone component of different projects. However, whether or not the activity area is indeed the most unsafe element in a work zone, more advanced safety measures are warranted.
Speed is accounted as the number one contributing factor in work zone crashes. According to USDOT’s reports in 2010, approximately 31% of work zone fatalities were attributed by over-speed [6] . Speeding in a work zone area is not only endangering drivers’ lives but also putting the lives of roadside workers potentially at risk by operating their vehicles recklessly [12] . According to the Bureau of Labor Statistics and US Federal Highway Administration (FHWA) reports, about 101 to 133 workers were killed in road construction sites between 2008 and 2013. Texas ranked as the State with the most worker deaths in work zones [7] [13] .
Intelligent Transportation System (ITS) based Vehicle-to-Infrastructure (V2I) and Connected Vehicle (V2V) technologies have been proposed and tested in various hazardous situations in simulation environments as well on real roads [14] -[19] . The results were promising. Meanwhile, it is found that the technologies could also minimize vehicle emissions in practice [20] -[23] . Estimates, however, are that these mature technologies will be available around 2017 [24] . Current technologies are challenging the applicability and costs of such on-board warning systems [25] . A smartphone-based warning system could be another promising tool to provide drivers with warning messages in the activity area of a work zone to be aware of possible worker’s crossings.
The research objective of this paper is to investigate how the smartphone based warring messages, including sound, male and female voice warning, influenced rivers’ driving behaviors, thereby enhance the safety of workers in the activity area of work zones. This includes finding out the best message options from a smartphone based on driving behaviors in the activity area of a work zone.
2. Vehicle to Infrastructure Communication Strategy to Improve Traffic Safety
To enhance the safety in work zones, previous studies focused on the proper use of traffic control devices, work activity scheduling, and personnel training [26] . Recently, a significant amount of research has made efforts in a wireless communication in a work zone as a supplement for the conventional traffic control devices. Li, Qiao, and Yu proposed and tested a Pedestrian-to-Infrastructure (P2I) wireless communication system in a simulated work zone, where a pedestrian crossed suddenly. They found that the P2I system was able to induce drivers to slow down their driving speeds in the work zone, thereby gaining sufficient time to react to the pedestrian’s crossing from the activity area smoothly [27] . Liao examined a smartphone application equipped with GPS and Bluetooth technologies, which generated vibrations with an audible message to notify visually impaired pedestrians about the presence of the oncoming work zone [28] . In fact, a well-designed wireless communication system is able to improve drivers’ driving behaviors in a work zone, in terms of lane change distance, lane change time, and brake distance for a hazardous situation [29] . The wireless communication system is achieved by using a 5.9 GHz Dedicated Short-Range Communications (DSRC) technology, which is similar to the Wi-Fi that offers a link between a vehicle and another vehicle (V2V), and a vehicle and the approaching infrastructure (V2I) [30] . Such a wireless communication is dedicated to improve drivers’ awareness of dynamic traffic situations, thereby preventing crashes from occurring.
3. Proposed Smartphone-Based Worker Warning Message System
In this research, a smartphone-based Safe Worker to Driver (SWD) App was developed to deliver warning messages to drivers via a smartphone. Such a developed system is an Android-based application that can be easily downloaded to any compatible smartphone in the current global market. This system was created with the help of the Massachusetts Institute of Technology (MIT) App Inventor, which is a cloud-based tool so that anyone might be able to develop desired Apps via these open-source web application originally provided by Google [31] . The App Inventor service for general public access was launched by the MIT Center for mobile learning in the first quarter of 2012 [32] . To create an app, it is recommended that creator Android Device and Developing Computer are connected to the same Local Area Network (LAN). A conceptual framework of this research to transfer work zone messages to drivers is shown in Figure 1.
In this study, the smartphone is pre-installed an application that can detect if a work zone is approaching based on the geo-location positions of the phone and mobility of the objects, such as vehicles and pedestrians on roads. A warning message in the form of a deep tone or an audio phrase will be triggered to alert drivers once the geo-location and driving direction of motorist matches. The communication between driver’s smartphone and a cloud-based ITS management server could be maintained by a Wi-Fi, a phone network system or a DSRC system. A pool of warning messages could be used for the app and downloadable for drivers. In this study, three types of warning messages (Sound, Male Voice, and Female Voice) were prepared during test runs to determine their comparative effectiveness. A detected range of 80 m Wi-Fi communication system was assumed to use throughout the study. This means when the subject vehicle is within 80 m to the spot, where a worker crosses, a designed warning message will be provided to the subject and the worker simultaneously. In this way, the communication between the subject and the worker is built up, so that they are able to react properly to avoid a conflict situation.
4. Driving Simulator Test
4.1. Test Design
A driving simulator test was designed, the test views of which are shown in Figure 2. This simulator has comprised with advanced features of real automobile cabins, such as seats, a windshield, complete dashboard, steering wheel, braking and acceleration systems. Subjects drove this simulator as a real-time automobile and their driving behaviors were recorded at sampling of 60 Hz, including acceleration, braking, velocity and braking, gear, lane position, collision velocity, and angle on a real-time basis.

Figure 1. Conceptual framework of this research to transfer message.
The layout of the urban road work zone in the test was created on the basis of the Manual on Uniform Traffic Control Devices (MUTCD) with the right lane closed [33] . The path of the urban roadway was designed in a way that participants only drove through a straight path with no stops. An advance warning area is comprised of three parts: Part A (Construction Ahead), Part B (Speed Limit) and Part C (Right/Left lane closed). In this test, the urban road speed limit of 64 km/h (40 mph) was designed. The advance warning area started at the position 1351 m and ended at 1672 m (Figure 3). Designed messages were to advise driver to change their lane if any redirection is necessary.
The transition area of the work zone starts immediately after the advance warning area, starting from the position 1672 m to 1727 m. The activity area is the region where actual roadwork activities take place. In Figure 3, the activity area started from 1727 m and ended at 1847 m. A buffer space was considered 60 m (200 ft) and a work space 60 m. The termination area was from 1847 m to 2030 m.
4.2. Participants
A total of 24 participants (12 female and 12 male) with valid driver’s license were recruited following the demographics distribution in Houston from 2010 census data illustrated in Table 1 [34] , regarding gender, age, and education components. The distribution of recruited age groups was adjusted based on the total adult drivers


 (a) (b) (c)
Figure 2. (a) The test used driving simulator; (b) A subject approaching the activity area of the work zone; (c) a worker crosses suddenly.

Figure 3. Illustration of the basic principles of this Smartphone-based advanced warning message system for a work zone.
(18 years old above) from the census data, therefore 86% of participants is from the group of 18 - 64 and 14% from 65 plus.
4.3. Testing Process
In this test, a scenario vehicle was stopped on the left lane and a subject vehicle started from the position of 780 m. Subject vehicles were requested to accelerate to meet and follow the posted speed limit of 48 km/h (30 mph) strictly, then they might encounter two critical situations. The first one was on the adjacent left lane, where a scenario vehicle stopped near the merging position (1565 m). Another one was that, while the subject vehicle was close to the activity area, a worker stepped out from the position of 1831 m with a speed of 3.2 km/h (0.89 m/s or 2 mph) within the activity area of the work zone.
A total of four scenarios were examined with a road length of 2030 m. In Figure 3, the subject was notified by a message via either a sound, male voice or female voice that lasted for one second. With a posted speed limit of 48 km/h (13.41 m/s or 30 mph), the subject vehicle traveled a distance of Dm = 1 × 13.41 = 13.411 m during this period. According to Texas Department of Transportation (TxDOT), stopping sight distance is the sum of the brake reaction distance and braking distance level where perception reaction time is 2.5 sec [35] . In this test, the calculated stopping sight distance (Dsd) is about 61 m (or 196.7 ft for the sum of brake reaction 110.3 ft and braking distance 86.4 ft at 30 mph). The total distance for stop here was Dt = Dm + Dsd = 13.411 + 61 = 74.41 m. A warning message was designed to prompt when a subject vehicle was at the distance of 74.41 m away to the point of 1831 m (the worker stepped out). In other words, subject vehicles received the warning message at the point of 1756.59 m (1831 - 74.41) if they followed the speed limit strictly. Each participant was instructed under four scenarios as are illustrated in Table 2.
Messages of the three scenarios were randomized for this test except for the base scenario. There were exactly six sequences in this test followed by three combinations. For the best results, these six sequences were repeated (Table 3) four times. This test lasted for 10 minutes followed by a questionnaire survey on the subjective feelings of test experience.

Table 1. Demographics of subjects based on 2010 census data in Houston.
Table 2. Different scenarios with different message options.
Table 3. Different sequence of messages.
5. Results and Discussion
5.1. Safety Performance Measure
The driving performances from the twenty-four participants in all scenarios were analyzed based on the data recorded from the simulator. Four measures of effectiveness (MOE) were examined, including: speed profile, speed variations, acceleration, and braking distance.
5.2. Speed Profile
Improper speed is one of the major causes of conflicts in an activity area. Figure 4 gives an overview of subjects’ speed profile in the four scenarios. It is shown that until the warning messages were provided at position 1756 m, little differences were observed among scenarios. After receiving a voice warning message (in the scenarios with male voice and female voice in green and purple lines, respectively), subjects speeds decreased sharply from the position 1773 m to 1814 m, until reaching the gap of 20 m with the crossing worker.
For the scenario with sound warning (the red line), the speed profile gradually decreased first, then sharply dropped from the position 1779 m to 1815 m, which is very close to the worker. For all these three scenarios (male, female, and sound), the speeds all declined from 60 km/h to 30 km/h. However, the speeds for the base scenario dropped from 60 km/h to 45 km/h, only from 1794 m to 1831 m (37 m). This implied that, without the smartphone warning messages, participants might drive at relatively higher speeds when reaching the conflict area with the crossing worker. Among the three warning messages, the male and female messages resulted in better effects on driving speeds.
5.3. Speed Variations
The distribution of speed could be another important indicator for the effectiveness of the designed messages. The position 1811 m was 20 m back from the worker’s crossing point 1831 m. The speed distribution of subject vehicle is shown in Figure 5, where the speeds in the base scenario varied from the bin 10 - 20 km/h to 60 - 70 km/h, while the speeds for other scenarios varied until the bin 40 - 50 km/h.
The speeds for sound scenario (the red column) were approximately 35% at the very low speed bin 10 - 20 km/h, but less than 10% in the relatively high speed bin 40 - 50 km/h. The similar phenomenon could be found for the scenarios of male and female messages. This means most of the subjects reduced their speeds at position 1811 m when approaching the crossing worker.
5.4. Acceleration/Deceleration
Acceleration (deceleration) is a realistic performance measure as it reflects the reactions of drivers to a scene and/or message. The shadowed oval area in Figure 6, from 1756 m to 1830 m, depicted the accelerations when approaching the worker’s crossing segment for all scenarios.
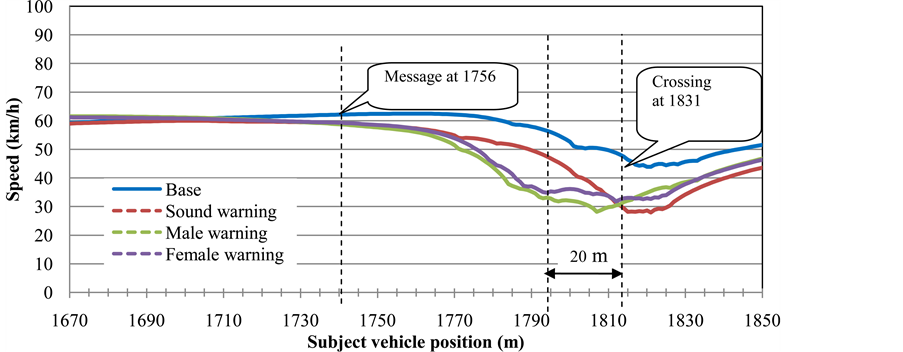
Figure 4. Comparison of speed vs. subject vehicle position in different scenarios.
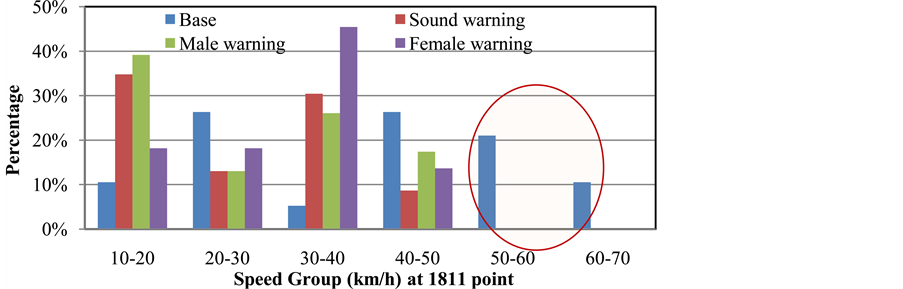
Figure 5. Comparison of speed frequency distribution at different point in activity area.
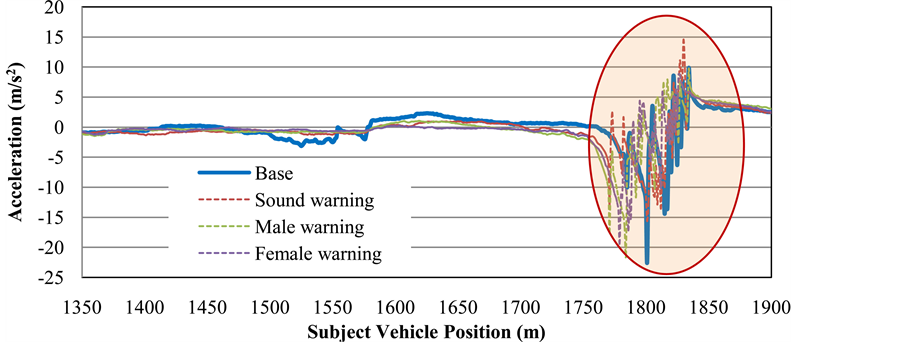
Figure 6. Comparison of acceleration vs. subject vehicle position in different scenarios.
In Figure 6, the decelerations for all three study scenarios (sound, male, and female) started earlier than the base scenario (the blue curve), approximately decelerated from position 1773 m and accelerated from position 1815 m. However, the deceleration rates for the base decelerated later and last until the locations which were very close to worker’s crossing position (1831 m).
5.5. Brake Distance
The brake distance is defined as the distance to a conflict point when the drivers first applied a brake, which is an important parameter to indicate subjects’ reaction distance to a hazardous situation. The mean brake distances in the four scenarios are shown in Figure 7. The brake distance in the base scenario is the shortest with 37.28, which is shorter than others by 12.45 m in the sound warning scenario, 20.11 m in the male warning scenario, and 19.59 m in the female warning scenario. It seems that subjects reacted to the situation earlier in the scenario with voice messages.
5.6. Posterior Questionnaire Survey
The posterior questionnaire survey results expressed that, eighty-five percent of the test participants felt that the smartphone message would enhance their defensive driving behaviors in work zones. Eighty percent of the participants were interested in the installation of this app in their smartphone. Seventy-five percent of the participants did not feel that the audio instruction/warning increased their workload. Throughout the test process, the smartphone warnings helped approximately 60% participants, in addition to the traffic signs. The highest percentage of participants (about 50%) liked the female voice message, 40% participants preferred the male voice message, whereas only 10% chosen the sound warning. This survey results were consistent with the measured performances stated in the previous sections.
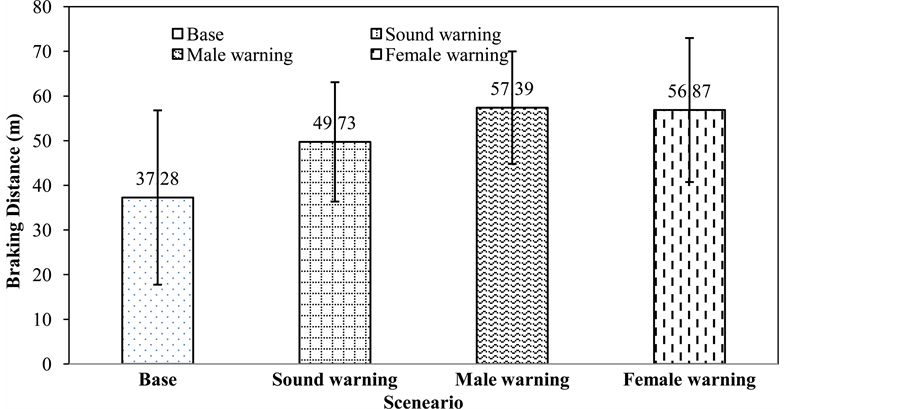
Figure 7. Comparison of brake reaction distance for different scenarios.
6. Conclusion
In this paper, three types of smartphone-based warning messages were tested by 24 participants in the activity area of a simulated work zone, in which a worker crossed suddenly, including sound, male voice and female voice. Results showed that participants drove slowly with less variation in the scenarios with the voice warning messages. Additionally, the sound and voices messages were able to guide participants to decelerate earlier when driving through the work zone. Among the three message scenarios, the participants started to decelerate earlier than in the base scenario. Further, in the scenario with the voice warning messages (male and female), participants reacted earlier to the hazardous situation, a worker’s crossing. The results from the posterior questionnaire demonstrated that 85% of the participants felt that the smartphone message would improve their defensive driving behaviors in work zones.
Acknowledgements
The authors acknowledge that this research is supported in part by the Tier 1 University Transportation Center TranLIVE # DTRT12GUTC17/KLK900-SB-003 and the National Science Foundation (NSF) under grants #1137732.
Cite this paper
FengxiangQiao,RuksanaRahman,LeiYu,QingLi, (2016) Identifying Smartphone Based Intelligent Messages for Worker’s Crossing in Work Zones. Journal of Transportation Technologies,06,76-85. doi: 10.4236/jtts.2016.62007
References
- 1. Benz, C. (2001) The Life of a German Inventor: My Memories/Karl Benz. (In German). (autobiography) München: Koehler und Amelang.
- 2. The Life of Henry Ford. (2013)
http://www.thehenryford.org/exhibits/hf/ - 3. Reid, R.L. (2008) Special Report: The Infrastructure Crisis. American Society of Civil Engineers (ASCE), 78, 40-65.
http://dx.doi.org/10.1061/ciegag.0000156 - 4. Ullman, G., Holick, A., Scriba, T. and Turner, S. (2004) Estimates of Work Zone Exposure on the National Highway System in 2001. Transportation Research Record: Journal of the Transportation Research Board, 1877, 62-68.
http://dx.doi.org/10.3141/1877-07 - 5. Federal Highway Administration (FHA) (2015) Facts and Statistics—Work Zone Injuries and Fatalities. www.ops.fhwa.dot.gov/wz/resources/facts_stats/injuries_fatalities.htm
- 6. ORZOFF Law Offices (2014) Construction Workers Face High Risk of Injury on the Job. Construction Zone Workers Face High Risk of Injury.
http://www.orzofflawoffices.com/construction-workers-face-high-risk-injury-job/ - 7. Federal Highway Administration (FHA) (2015) Work Zone Mobility and Safety Research, Worker Safety.
http://www.ops.fhwa.dot.gov/Wz/workersafety/index.htm - 8. Salem, O.M., Genaidy, A.M., Wei, H. and Deshpande, N. (2006) Spatial Distribution and Characteristics of Accident Crashes at Work Zones of Interstate Freeways in Ohio. Proceedings of the IEEE Intelligent Transportation Systems Conference, Toronto, 17-20 September 2006, 1642-1647.
http://dx.doi.org/10.1109/itsc.2006.1707460 - 9. Akepati, S.R. and Dissanayake, S. (2011) Characteristics and Contributory Factors of Work Zone Crashes. Proceeding of Transportation Research Board 90th Annual Meeting, 23-27 January 2011, Washington DC, 16 p.
- 10. Garber, N.J. and Zhao, M. (2002) Distribution and Characteristics of Crashes at Different Work Zone Locations in Virginia. Transportation Research Record: Journal of the Transportation Research Board, 1794, 19-25.
http://dx.doi.org/10.3141/1794-03 - 11. Pigman, J.G.K. and Agent, R. (1990) Highway Accidents in Construction and Maintenance Work Zone. Transportation Research Record: Journal of the Transportation Research Board, No. 1270, 12-21.
- 12. Maryland State Highway Administration. Case Study: Maryland Needed a Wayto Enhance Motorist and Worker Safety in Work Zones.
http://www.xerox.com/downloads/usa/en/bpo/casestudies/bpo_casestudy_Maryland_workzone_speed.pdf
- 13. The National Institute for Occupational Safety and Health (NIOSH) (2014) Highway Work Zone Safety.
http://www.cdc.gov/niosh/topics/highwayworkzones/ - 14. Li, Q. and Qiao, F. (2014) How Drivers’ Smart Advisory System Improves Driving Performance? A Simulator Imitation of Wireless Warning on Traffic Signal under Sun Glare. LAMBERT Academic Publishing, Saarbrücken.
- 15. Qao, F., Jia, J., Yu, L., Li, Q. and Zhai, D. (2014) Drivers’ Smart Assistance System Based on Radio Frequency Identification. In: Transportation Research Record: Journal of Transportation Research Board, No. 2458, Transportation Research Board of the National Academies, Washington DC, 37-46.
http://dx.doi.org/10.3141/2458-05 - 16. Li, Q., Qiao, F. and Yu, L. (2015) Fuzzy Lane-Changing Models with Socio-Demographics and Vehicle-to-Infrastructure System Based on a Simulator Test. The Journal of Ergonomics, 5, Issue 4, pp. 1000144.
- 17. Qiao, F., Rahman, R., Li, Q. and Yu, L. (2016) Identifying Demographical Effects on Speed Patterns in Work Zones Using Smartphone Based Audio Warning Message System. The Journal of Ergonomics, In Press.
- 18. Li, Q., Qiao, F., Qiao, Y. and Yu, L. (2016) Implications of Smartphone Messages on Driving Performance along Local Streets. Proceedings of the 11th Asia Pacific Transportation Development Conference and 29th ICTPA Annual Conference—Bridging the East and West: Theories and Practices of Transportation in the Asia Pacific, Hsinchu, 27-29 May 2016, paper # 81.
- 19. Rahman, R., Qiao, F., Li, Q., Yu, L. and Kuo, P.-H. (2015) Smart Phone Based Forward Collision Warning Message in Work Zones to Enhance Safety and Reduce Emissions. Proceedings of the 94th Transportation Research Board Annual Meeting, Washington DC, 11-15 January 2015, Paper # : 15-0648.
- 20. Qiao, F., Li, Q. and Yu, L. (2014) Testing Impacts of Work Zone X2V Communication System on Safety and Air Quality in Driving Simulator. Proceedings of the 21st ITS World Congress, Detroit, 7-11 September 2014, Paper #: T64.
- 21. Li, Q., Qiao, F. and Yu, L. (2014) Impacts of Vehicles to Infrastructure Communication Technologies on Vehicle Emissions. Proceedings of the International Conference on Environmental Science and Technology, Houston, 9-13 June 2014, Paper #: 946.
- 22. Li, Q., Qiao, F. and Yu, L. (2015) Will Vehicle and Roadside Communications Reduce Emitted Air Pollution? International Journal of Science and Technology, 5, 17-23.
http://ejournalofsciences.org/archive/vol5no1/vol5no1_3.pdf - 23. Li, Q., Qiao, F. and Yu, L. (2016) Vehicle Emission Implications of Drivers Smart Advisory System for Traffic Operations in Work Zones. Journal of Air & Waste Management, In Press.
http://dx.doi.org/10.1080/10962247.2016.1140095 - 24. Harding, J., Powell, G., Yoon, R., Fikentscher, J., Doyle, C., Sade, D., Lukuc, M., Simons, J. and Wang, J., National Highway Traffic Safety Administration (NHTSA) (2014) Vehicle-to-Vehicle Communications: Readiness of V2V Technology for Application. Report #: DOT HS 812 014, August 2014.
- 25. Government Accountability Office (GAO) (2013) Intelligent Transportation Systems, Vehicle-to-Vehicle Technologies Expected to Offer Safety Benefits, but a Variety of Deployment Challenges Exist. GAO-14-13.
http://www.gao.gov/assets/660/658709.pdf - 26. Pigman, J.G. and Kenneth, R.A. (1988) Research Report UKTRP-88-13: Analysis of Accidents in Construction and Maintenance Work Zones.
http://uknowledge.uky.edu/cgi/viewcontent.cgi?article=1519&context=ktc_researchreports - 27. Li, Q., Qiao, F., Wang, X. and Yu, L. (2013) Impacts of P2V Wireless Communication on Safety and Environment in Work Zones through Driving Simulator Tests (Paper No. 26-179). Proceedings of the 26th Annual Conference on the International Chinese Transportation Professionals Association (ICTPA), Tampa, 24-26 May 2013, Paper #: 26-179.
- 28. Liao, C.F. (2014) Development of a Navigation System Using Smartphone and Bluetooth Technologies to Help the Visually Impaired Navigate Work Zones Safely. Department of Civil Engineering, University of Minnesota, MN/RC 2014-12, CTS Project No. 2013027, Final Report Minnesota Department of Transportation, Research Services & Library, February 2014.
http://www.dot.state.mn.us/research/TS/2014/201412.pdf - 29. Li, Q., Qiao, F. and Yu, L. (2015) Socio-Demographic Impacts on Lane-Changing Response Time and Distance in Work Zone with Drivers’ Smart Advisory System. Journal of Traffic and Transportation Engineering, 2, 313-326.
http://dx.doi.org/10.1016/j.jtte.2015.08.003 - 30. Najm, W.G., Koopmann, J., Smith, J.D. and Brewer, J. (2010) Frequency of Target Crashes for Intelli-Drive Safety Systems. National Highway Traffic Safety Administration (NHTSA). DOT HS 811 381.
- 31. Massachusetts Institute of Technology (MIT) Tutorials for App Inventor 2.
http://appinventor.mit.edu/explore/ai2/tutorials.html - 32. Massachusetts Institute of Technology (MIT) Center for Mobile Learning @ The Media Lab.
http://mitmobilelearning.org/ - 33. Federal Highway Administration (FHWA). Manual on Uniform Traffic Control Devices (MUTCD). 2009 Edition.
http://mutcd.fhwa.dot.gov/htm/2009/part6/part6e.htm - 34. US Census 2010.
http://quickfacts.census.gov/qfd/states/48/4835000.html - 35. Texas Department of Transportation (TxDOT) (2015) Roadway Design Manual—Texas Department of Transportation.
http://onlinemanuals.txdot.gov/txdotmanuals/rdw/rdw.pdf