Journal of Transportation Technologies
Vol.3 No.2A(2013), Article ID:31805,10 pages DOI:10.4236/jtts.2013.32A002
How Cities Influenced by High Speed Rail Development: A Case Study in China
Institute of Transportation Engineering, Tsinghua University, Beijing, China
Email: jingshi@tsinghua.edu.cn
Copyright © 2013 Jing Shi, Nian Zhou. This is an open access article distributed under the Creative Commons Attribution License, which permits unrestricted use, distribution, and reproduction in any medium, provided the original work is properly cited.
Received January 11, 2013; revised February 11, 2013; accepted February 18, 2013
Keywords: WuGuang HSR; Accessibility Evaluation; Weighted Mean Travel Time; Generalized Weighted Travel Time; Transportation Equity; Gini Coefficient
ABSTRACT
This study aims at analyzing various extents of transportation equity change and the accessibility change of cities along High Speed Rail (HSR) line in China. To evaluate the accessibility change and transportation equity, certain cities along the transportation corridor which the successfully operating WuGuang HSR lies in are selected as samples of influenced ones first. Cities’ connection with HSR and their sizes are considered as choosing criteria. Weighted mean travel time and Generalized weighed travel time, which integrated with generalized cost, are both calculated in the two different scenarios to indicate accessibility changes of each city. The two scenarios are with or without the advent of WuGuang HSR. Accessibilities in different scenarios were carefully contrasted. It was found out that there is no significant change in the mean accessibility aspect of the region between the two scenarios. Then transportation equity issue of the transportation corridor is discussed based on the results of Gini coefficient using the data of Passenger Transportation Balance index. Passenger Transportation Balance index is proposed in this article to indicate the how much is one city’s transportation demand satisfied. The research found that cities had HSR stations built-in all attained a more accessibility improvement comparing with the others. And the gap between the accessibilities of the cities along the HSR line and those which are not is relatively wider. However, the equity evaluation using Transportation Balance Gini Coefficient reveals that massive investment in HSR has no potent evidence for equity improvement.
1. Introduction
This research is interested in how transportation equity and cities’ accessibility in a transport corridor would change after the advent of High Speed Rail (HSR). HSR differs from other transport modes mainly in three aspects, the higher speed comparing with conventional rail, the better quality of service and a relative high capacity among passenger transport modes. As a production of huge investment to the local transportation system, the influence HSR may have in changing transportation equity has been noticed as in [1]. Transportation equity is usually evaluated in four aspects: equity among different areas, different social groups, different traffic modes, and different generations [2]. The four all refer to the fairness and justice of the distribution of transportation resources on two or more units. Thus, there is no doubt that accessibility can be used in illustrating transportation equity, as accessibility is an important indicator of transportation resources. Accessibility has already been used in transportation equity evaluation by using the indicators such as Gini coefficient and Theil index [3]. This research will use the data of accessibility in transportation equity evaluation.
HSR was considered playing an important role in evaluating interregional accessibility early in 1997 [4]. For the meaning of accessibility varies as it is defined and operationalised in different scenarios [5], researchers who were interested in the accessibility changes caused by the operation of HSR have delved into this topic from different angles. Usually accessibility issue of HSR is analyzed together with competition and cooperation of HSR and other transport modes [6-12]. Aware of the fact that HSR mainly impacts on passenger transport, accessibility is defined as the extent to which transport systems enable groups of individuals to reach out for opportunities or destinations in this research. Travel time and transportation fare are the factors considered in this article.
This research is focusing on city level. They are acting as centripetal as well as centrifugal forces in the whole region [13].The importance of cities in the spatial organization as well as their roles as important locations of production, consumption, exchange and control is recognized by researchers years ago [14]. A large part of the literature on HSR, which basically linking cities together, focused on impacts it brings to cities in aspects of economic development [15,16], labor market [17] and other relevant aspects [18-22]. The reason why cities were studies instead of regions in those researches is that most of economic activities occur in cities and they provide most of the attractive workplaces. That is to say the accessibility of cities is more suitable for revealing the impact of HSR.
Although there are plenty of studies on relative issues on accessibility and city development caused by the advent of HSR, little attention was allocated on the differences among cities’ transportation equity change and accessibility change in a region. Studying changes of accessibilities in the view of the system means concentrating more on whether or not city is more accessible comparing with others. China started establishing its HSR network since decades ago. While there is still a long period of time before the plan is accomplished, some HSR lines have already been put into use and the operation goes fairly well. How HSR impacts the accessibility of the systems of cities along the transportation corridor has attracted lots of attentions in Chinese scholars [23-25]. However, as the country with the longest HSR lines in operation and going to have the largest HSR network in the world, empirical study on the accessibility change is inadequate [26,27]. This paper aims at finding out how cities are influenced by HSR in China, basing on the case study of WuGuang HSR.
2. Methodology Approach
2.1. Accessibility Evaluation
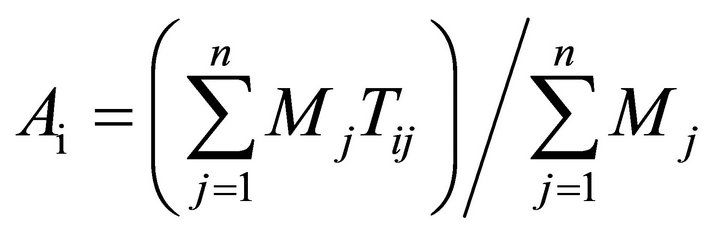
To find out how accessible the cities are and then to evaluate the transportation equity,accessibility evaluation needs to be taken first. In this study, accessibility indicator is a reflection of the impact of the advent of HSR on the passengers transferring and then the economic development. This means that accessibility should relate to the role of transport systems which will help groups of individuals to attain opportunities in different cities. Thus, accessibility is defined as the extent to which transport systems enable groups of individuals to reach out for opportunities or destinations. The selection of indicator is a very important issue for measuring changes in the accessibility, since the results of evaluations vary with indicators used. In this paper, we will analyze the variation of accessibility changes by the classic accessibility indicator weighted mean travel time first. This measure does not relate to the short distance and expresses the extent to which a changed link modifies the location by reducing access times to other urban areas [28]. It can be represented as Equation (1):
 (1)
(1)
where  is the accessibility of a node (city)
 .
.  is the shortest travel time between
  and
and .
.  is the weight (for example, population or gross domestic product) of the node
 . The factor
  is used to value the importance of the minimum-time
  [11].
[11]. ![]() is the number of cities studied.
is the number of cities studied.
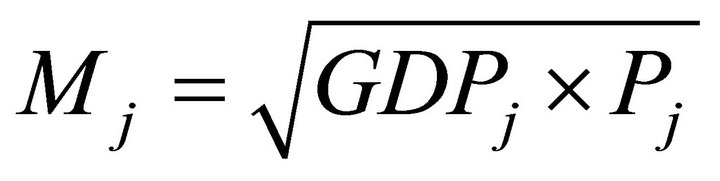
Weighted mean travel time considers all relationships within the area of study, but routes on short distances do not contribute more than other factors in the calculations since there is no distance decay. Thus it picks up impacts of new link more dispersal in location than other accessibility indicators, like daily accessibility indicator and economic potential indicator [28]. In this study, the weight  is specialized by using GDP, for economy is mainly concerned.
  is calculated using the Equation (2):
 (2)
(2)
where  is the gross domestic product, and
  is the number of resident population of city
 . The number of resident population is used to indicate the scale of the labor market as well as an indicator for job opportunities.
The weighted mean travel time was used in lots of researches [23,24]. In this article, the accessibility will be evaluated by this indicator as well. The result will show us how accessibilities changed if considering travel time only.
Shorten travel time is on reason why HSR caught much attention. However, HSR is also known for its ticket price beside of its high speed. The price of second class ticket is about 0.43 Yuan/km, while the traditional rail is 0.13 Yuan/km. A transportation mode beyond affordance is not an available choice for passengers and will not really help to improve accessibility. Thus, it is necessary to consider ticket price in evaluating accessibility. The Generalized weighed travel time, which integrated time and fare, is considered in this article.
 (3)
(3)
where  is the extent of accessibility between node (city)
  and
and .
.  is the shortest travel time by available transport mode
 .
.  is the weight of the node
  as in Equation (1).
 ![]() represents the number of cities studied.
represents the number of cities studied.  is the generalized travel time value of city
 .
.  is the travel fare due to transport mode
 .
.
It is a common belief that people from different social groups have different travel time values. There are plenty of methods to calculate . And different methods usually lead to different results. The following Equation is one of the most widely used methods in travel time evaluation in China [29].
 (4)
(4)
In Equation (4), WH is the number of legal working hours of a year in China, which is 2000.  equals the average amount of the GDP one person can contribute to city j per hour. And it differs from city to city. By using GDP, it is quite clear that the benefits to economy and social welfare from saved travel time were all included. However, travel time value in Equation (4) considered the value of work trip while failing to include the value of personal trip.
Researches concerns about the choice making of travelers would use average wage other than per capita GDP in calculations. Thus, travel time value of work trips is calculated as follows.
 (5)
(5)
 is the urban per capita disposable income. This indicator could well represent the wage according to the statistical indicator used in China.
Travel time value of personal trip is thought to have a linear relationship with those of work trip. And the ratio of time value between personal trip and work trip was recommended to choose from 0.2 to 0.6 in China [29].
This research considers the impact of HSR on cities, which means that the time value of work trip as well as the personal trip should be considered. Therefore, the following equation is used.
![]() (6)
(6)
where  is the travel time value calculated from Equation (4).
 is the travel time value calculated from Equation (5).
 is the ratio of work trip.
 is the ratio of time value of personal trip to the one of work trip.
In Equation (6), the former part is to represent the travel time value of work trip and the latter is to represent the time value of personal trip. Travel time value of each city is calculated separately.
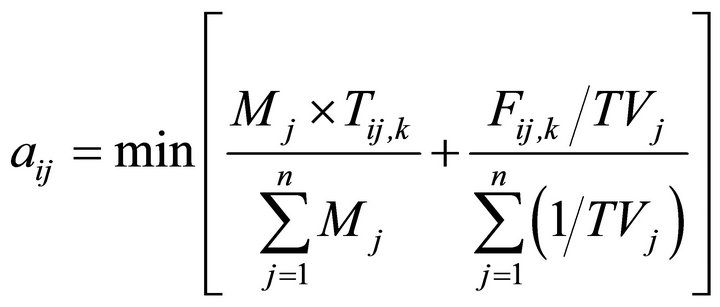
Because once travel fare is considered, passenger’s choice among different transportation modes may differ from the one with minimum travel time. In other words, HSR might be a preferable choice in some routes but no in all routes. Thus, to evaluate the accessibility of a city, the accessibility of each route should be decided first by Equation (3). In Equation (1), the minimum travel time is selected directly as it is assumed that the shorter time the more preferable the choice. The evaluation results of the two indicators will be contrasted to see how fare impacts on accessibility.
As can be seen from the Equation (3), travel fare is integrated in accessibility similarly to travel time in this research. Firstly, the data of travel fare of every mode between every two cities is collected. Then the accessibility between two cities is defined as the minimum one.
 (7)
(7)
where  is the accessibility of the city i evaluated by Generalized weighed travel time.
The Generalized weighed travel time considers all relationships within the area of study. But there is still no distance decay as weighed mean travel time.
To get a full view, the whole of any cities that might be influenced are seen as the population and the cities selected and calculated are seen as samples. One sample Kolmogorov-Smirnov (K-S) test will be carried out to identify what kind of distribution the population is. Then independent-samples t-test will be implemented to find the differences of mean accessibility between the two scenarios.
2.2. Transportation Equity Evaluation
Keep making investments to improve transportation system is important for the development of the society. However, the resource available for investing is limited. Which means that to overfulfil one city’s transportation demand is unfair to the others. In other words, the distribution of investment among different cities would affect transportation equity.
The definition of transportation equity requires balance between transportation demand and transportation capability. In this research we define the Passenger Transportation Balance Index to indicate such a balance. The passenger transport is considered only here because HSR influence it most. And in the evaluation process how the freight transport is not included. The indicator, which is represented by , is calculated by the following equation.
 (8)
(8)
 is the accessibility of city i, which is derived from Equation (1) or Equation (3).
  and
and  respectively represent the number of residents and gross domestic product of city i. 1/
 here is to represent the passenger transportation capability of the city.
  is in the position of denominator. Because the smaller its numerical value the better the accessibility. And ceteris paribus, the better the accessibility the larger value of the Passenger Transportation Balance Index is.
 , which is the reciprocal of the per capita GDP, is the representative of Passenger transportation demand.
 is a relative indicator, as the accessibility indicator
 . It would vary as the cities chosen for study changed. Thus, there is no certain meaning of its numerical value. It should only be used for comparisons among cities in the same evaluation process. By comparing value of
![]() , it is easy to find out which city’s transportation demand was more satisfied.
, it is easy to find out which city’s transportation demand was more satisfied.
Basing on accessibility data, the transportation equity is discussed by Passenger Transportation Balance Gini coefficient, which is calculated by the data of accessibility evaluation. Gini coefficient (also known as the Gini index or Gini ratio) is an indicator for statistical dispersion. It is originally used to measure the inequality among values of a frequency distribution (for example levels of income). And it has been used in transportation research, too. Santos Bruno [3] used it to indicate the dispersion of accessibility values across all centers. Gini coefficient theoretically ranges from 0 to 1. A Gini coefficient of zero expresses perfect equality where all values are the same, corresponding to complete equality. A low value of Gini coefficient indicates a more equal distribution, while higher Gini coefficients indicate more unequal distribution. To be validly computed, no negative goods can be distributed, which the data of Transportation Balance could well satisfied.
If the probability function  is discrete, which is the case of Transportation Balance Index distribution, and where
  (
( to
to![]() ) is the points with nonzero probabilities, indexed in increasing order (
) is the points with nonzero probabilities, indexed in increasing order ( ), then Transportation Balance Gini coefficient is calculated using Equation (9). Gini coefficient indicates the inequality state, which can be expressed with Lorenz curve as shown in Figure 1, and it is obtained by the ratio of
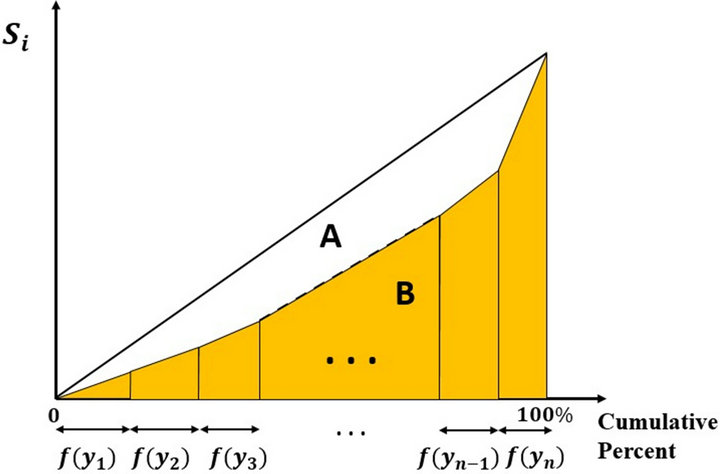
Figure 1. Transportation Balance Index distribution expressed in Lorenz curve and Gini coefficient.
two areas: A/(A+B).
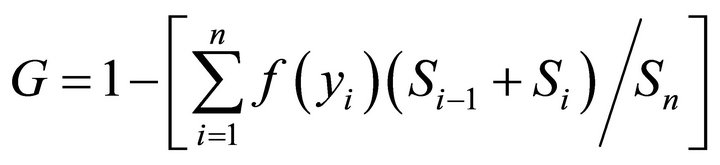 (9)
(9)
Where 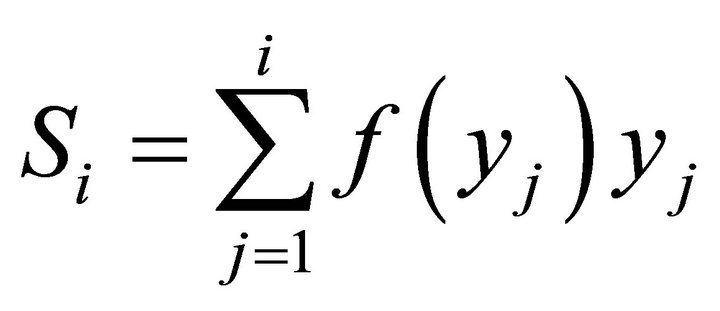 and
and .
.
3. Case Study
3.1. Introduction to WuGuang HSR
WuGuang HSR is one of the most successful lines since it started commercial service at the end of the 2009. It is part of the unfinished 2100-km long Beijing–Guangzhou High-Speed Railway (JingGuang HSR). The main line of WuGuang HSR is 968-kilometre long, with Wuhan (capital of Hubei Province) and Guangzhou (capital of Guangdong Province) as its two ends. It costs three hours and thirty-three minutes in transferring passengers between the two ends by the fastest commercial service. With 15 stations in operation, WuGuang HSR crosses three provinces, Hubei, Hunan and Guangdong (as shown in Figure 2).
The corridor WuGuang HSR goes along is very busy since the accomplishment of the conventional JingGuang Railway in 1957. These two railways have an approximately same route. Wuhan, Guangzhou and Changsha are set as the three original stations, providing services with different combinations of intermediate stations.
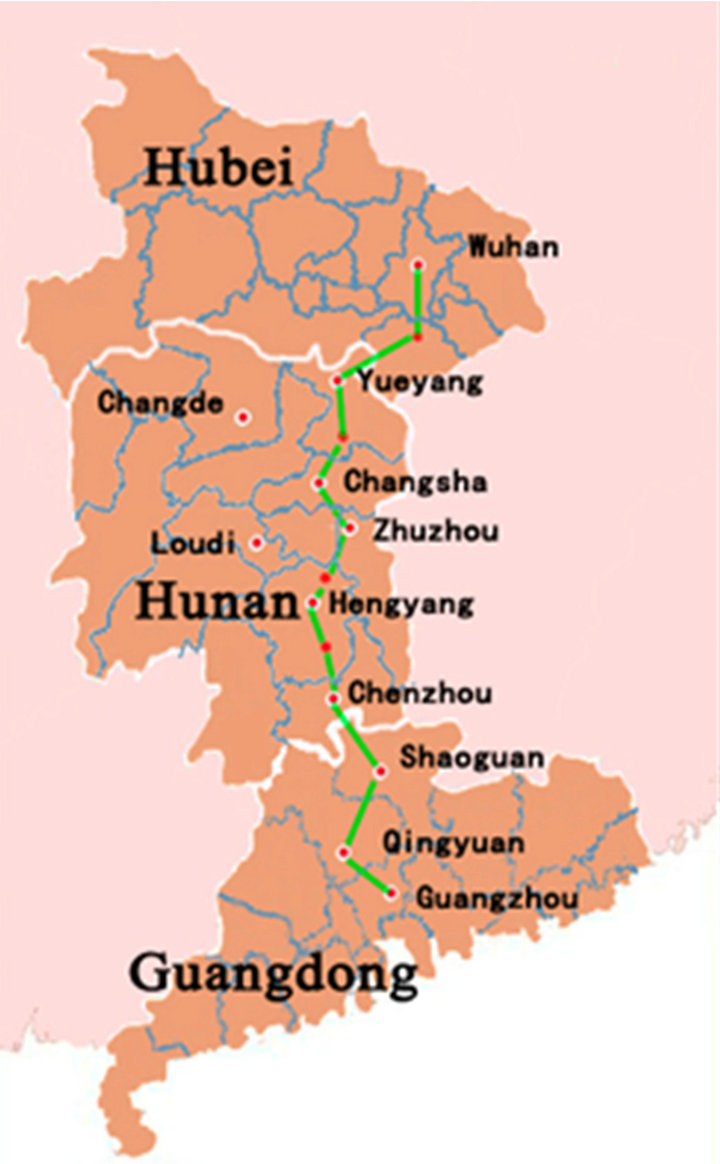
Figure 2. Location of WuGuang HSR.
The majority of seats are of the second class and the fare is about ¥ 0.46 per kilometer. A few seats are in the first class, and seats of the deluxe class are also available, which charge about 60% and 80% high respectively more comparing with those in the second class. The price of the second class is only like a half of the price of the flight between Wuhan and Guangzhou even considering the usual discount (about 50%). Each station’s distance from the end of Wuhan and its administration in provincial level and city above the prefecture level is illustrated in the Table 1.
These stations are neither of the same size nor the same importance for the line. Wuhan, Changsha South, Guangzhou South and Guangzhou North are much bigger than the others not only because they are located in the capitals of the three provinces, but also because they are already serving as or planned to be important transport hubs. And what should be informed is that only the four cities, namely Wuhan, Changsha, Hengyang and Guangzhou, have an airport.
Among all these stations, Chibi North, Miluo East, Hengshan West, Leiyang West are smaller because they
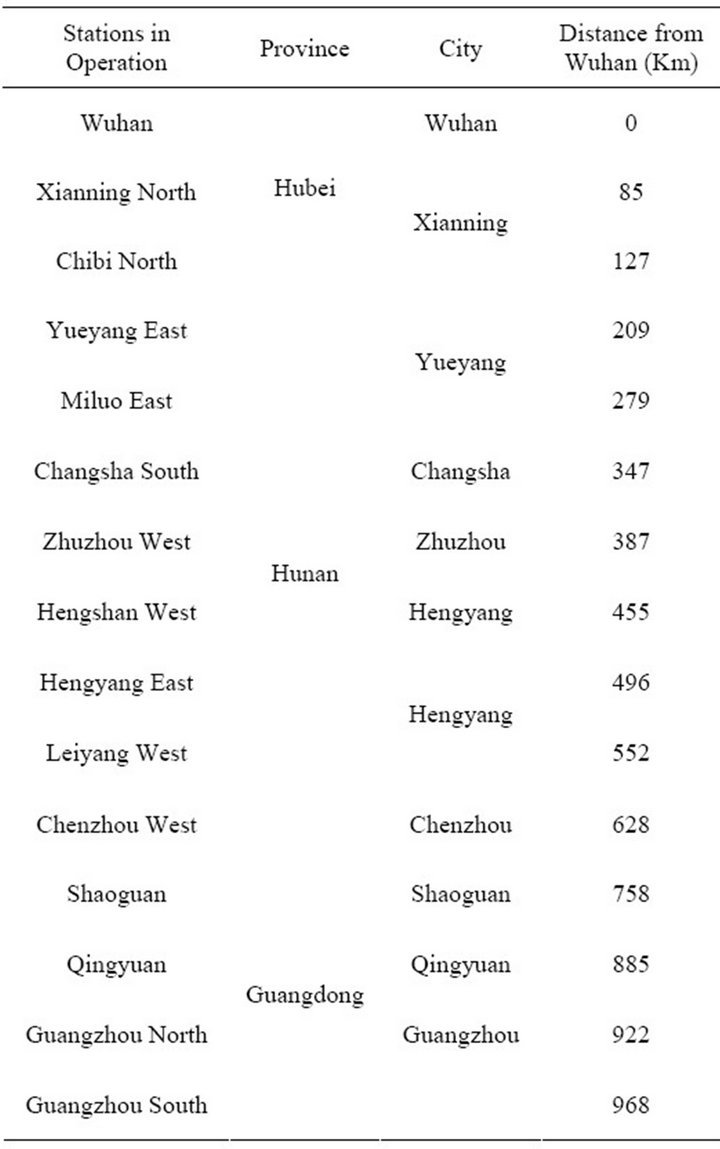
Table 1. Stations along the WuGuang HSR line.
are newly built stations in small developing counties, where there is only small travel demand comparatively. The statistical survey conducted by the Statistic Bureau of Hunan province could well prove it. See Table 2.
HSR is now the most convenient when travel time as well as travel cost is considered in all public passenger transportation. From January to October, just the Hunan section of WuGuang HSR has already transferred 12.5 million passengers, which indicates that HSR has become an important transport mode.
3.2. Cities to Be Analyzed
The transportation equity is revealed by the data of accessibility in this research. To find out the changes of the accessibilities is more important than getting a precise numerical evaluation result of accessibility. Cities to be analyzed are firstly selected from all the cities which might be influenced by HSR. Because it is merely impossible to evaluate all the cities been influence at the same time, for the hardness of identifying them all. HSR is a huge investment which not only influences the cities which are along the line, but also the cities sharing the same transportation system. Thus, sampling is concerned to estimate characteristics of the whole population, which is all the cities be influenced.
The primary criterion in selecting cities is that the selected cities should be along WuGuang HSR or have direct train service to cities along WuGuang HSR. In other word, cities studied should be in the transport corridor. This criterion would help to get a clear result of the accessibility change by analyzing the impact of HSR. Secondly, the administration demarcations are considered to ensure the data is comparable in this study. That’s because the statistic survey is done by different local administration, which usually has some differences in statistic method. To take a sample analysis, cities from one province would be helpful to make the results potent.
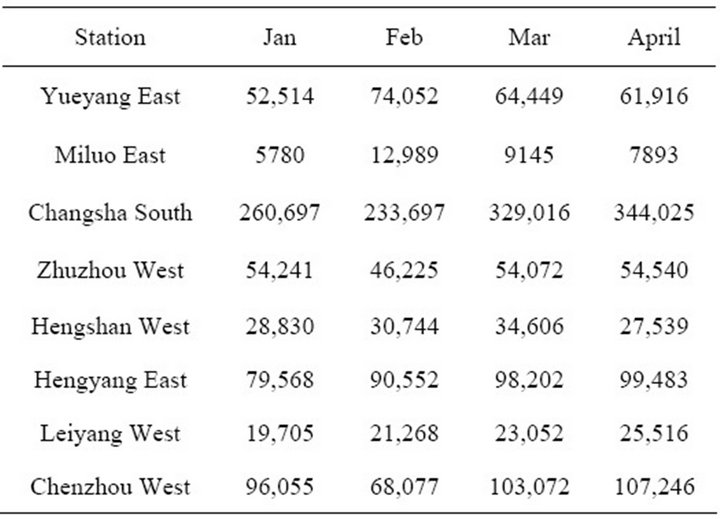
Table 2. Passengers transferred in the first four months of 2010 (unit: person).
Also, the level of the city is considered. There are three levels of cities which have an HSR station, decreasing in order of the sub-provincial level, the prefecture level and the county level. These levels do not only reveal cities’ political status but also reflect their economic development. In this paper, cities of the county level are not considered for both their economic aggregate and the populations are small comparing with cities from higher levels. From Table 2. it can be found that stations in county level cities only share small part of the passenger flow. And in this specific case, county level cities are only short distances away from prefecture level cities which are taking charge of them in the politically hierarchy.
Considering criteria aforementioned, cities in Hunan province are chosen. Besides the five cities Yueyang, Changsha, Zhuzhou, Hengyang, and Chenzhou which have an HSR station, Loudi and Changde are selected. Loudi and Changde are prefecture level cities which are of importance to regional development. The nine cities are illustrated in Table 3.
The accessibility of a certain city is not only influenced by other cities within the region it belongs, but also cities beyond the region [30]. So Wuhan and Guangzhou are used in the evaluating process to ensure the result more attached to the reality. These seven cities are all at the prefecture level. Also, it is easy to find that Wuhan, Guangdong and Changsha, capitals of the respective province, are more developed than other cities from this table. Thus, Yueyang, Changsha, Zhuzhou, Hengyang, Chenzhou, Wuhan, Guangzhou, Loudi, Changde and Wuhan, Guangzhou are analyzed in the accessibility evaluation process.
4. Empirical Analysis
There are nine cities to be analyzed in the accessibility
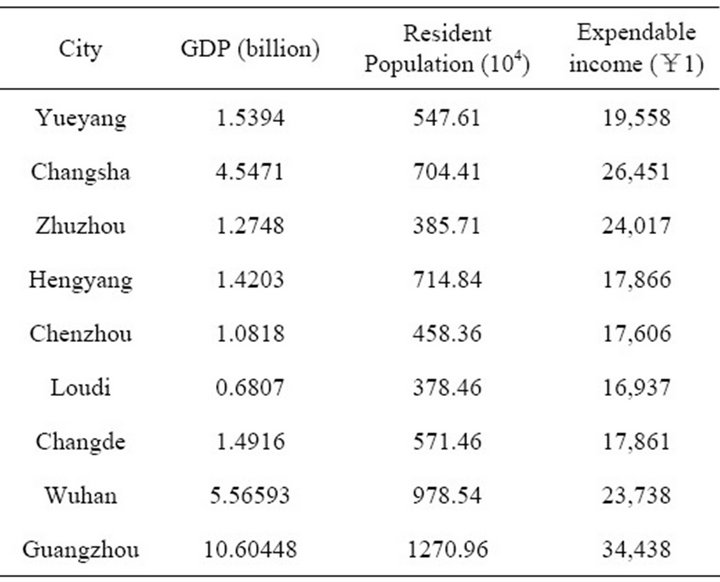
Table 3. Cities selected for evaluationa.
evaluation process. However, the evaluation results of Wuhan and Guangzhou are not discussed in this paper. Because as mega city of sub-province level, both Wuhan and Guangzhou have lots of transportation connections with cities allocated in a broad area. So only considering a few cities along HSR line is insufficient for the accuracy of their accessibility evaluation.
As aforementioned, there are only 4 cities which have airline services. Among those 4 cities, there are only direct flights between Wuhan and Guangzhou, which take 1 hour and 40 minutes on the plane. According to the administration provisions, passengers traveling by plane need to arrive at the airport, which usually located in the suburban area, to board the plane at least half an hour before the plane took off. Thus, minimum travel time between Wuhan and Guangzhou would add up to two and a half hours. Railway, buses are also considered in comparing with HSR while private vehicles are not considered in this paper.
4.1. Accessibility Evaluation by Weighed Mean Travel Time
The latest minimum travel time is collected in two scenarios, with or without the HSR taken into consideration. Accessibility represented by here is rather a comparative indicator, which reveals the change of accessibility other than showing the absolute value of accessibility.
According to Equations (1) and (2), the accessibility variation can be evaluated. And the evaluation results of are presented in Table 4.
According to the definition of accessibility measurement, the smaller the numerical value of is, the more accessible the city is. From evaluation results, it can be found that all the cities along HSR were exalted in accessibility. And these accessibilities have been promoted in similar ratios. Though no HSR station in, the accessibili-
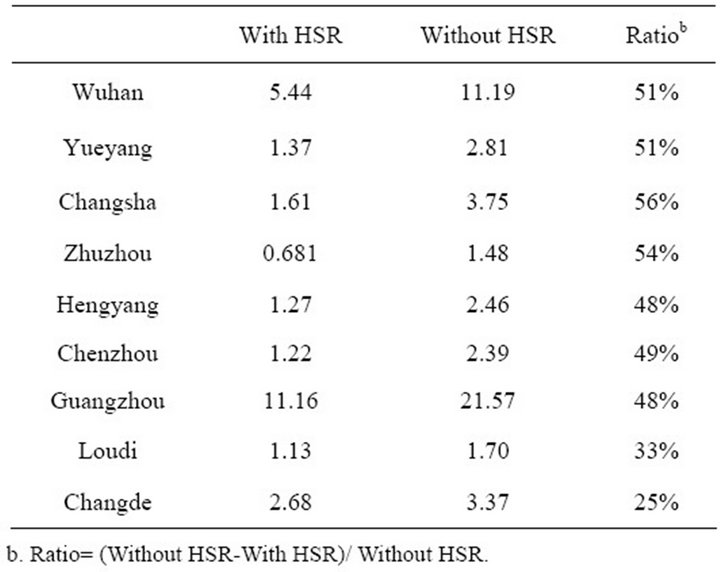
Table 4. Accessibility evaluation results using weighed mean travel time.
ties of Loudi and Changde have been improved too. That is because both direct trips and transfer are considered and passengers can move to a city with HSR and take it. Thus, Loudi and Changde also benefit from the advent of HSR.
4.2. Accessibility Evaluation by Generalized Weighed Indicator
The travel time and travel fare of each transport mode are collected in two scenarios, with or without the HSR taken into consideration. In the evaluation process, r in Equation (6) is 0.5 according to an investigation implemented on WuGuang HSR [31]. And  is valued 0.4 as recommended [32].
According to Equations (3), (4) and (6) the accessibility evaluation results of  calculated by Generalized weighed travel time are presented in Table 5.
After travel fare is taken into account, HSR is not attractive for it is more expensive than rail and bus. Passengers will choose the traditional railway or bus if they do not find the time saved by HSR worth the increase of fare. Thus, it is easy to interpret that the accessibility promotion illustrated is Table 5 is not as much as in Table 4.
By contrasting the difference of evaluation results by weighed mean travel time and integrated indicator, it is found that the ticket price of HSR has great impact on accessibility. And the results in Table 5 are closer to the observation that the accessibilities of cities with HSR do not have a promotion of about 50%.
Only find out the accessibility change of the seven cities is not sufficient to understand the impact of the HSR to the transportation corridor. In order to understand the differences between the two scenarios, the non-parameter analysis is carried out to find the distribution of accessibility. The results shown in Table 5 are used in this procedure. The result is shown in Table 6.
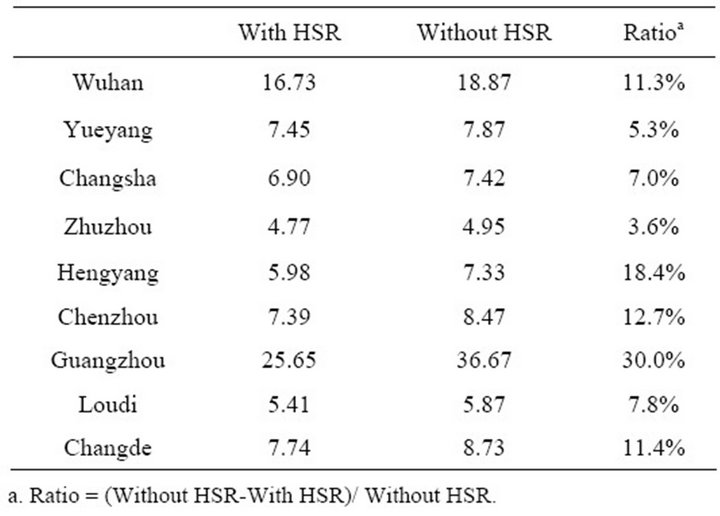
Table 5. Accessibility Evaluation using Generalized Weighed Travel Time.
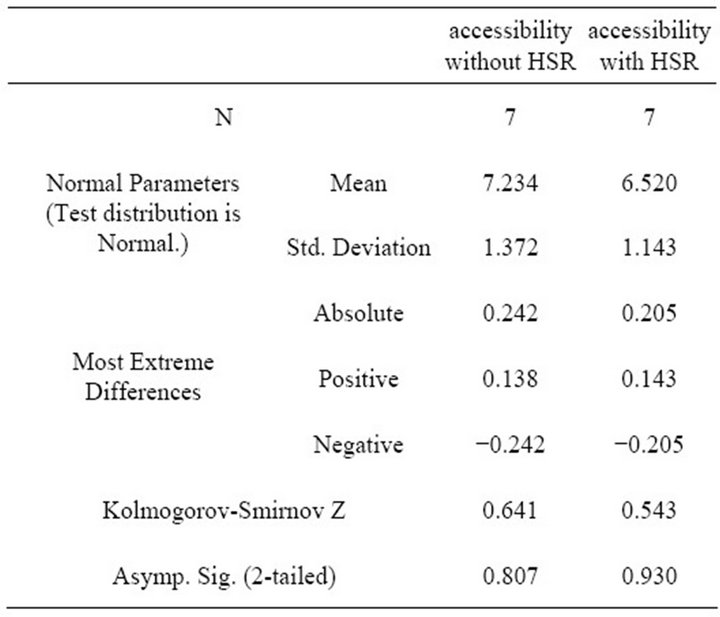
Table 6. One-Sample kolmogorov-smirnov test.
Distribution of accessibilities in both scenarios can be seen as normal according to the results. The samples are independent of each other. To further understand the gap of standard deviations between the two scenarios, independent-samples t-test is carried out. The final results are shown in Table 7.
The purpose of independent-samples t-test is to test for significant differences between means. Levene’s test checks for whether their variances are relatively similar or not. The significance for Levene’s test is above 0.05. Thus the “Equal Variances Assumed” test is used.
The significance is 0.839 (0.839 > 0.05), which means there is no significant difference between values of mean accessibility in two scenarios.
In other words, despite the difference of mean accessibilities caused by the advent of WuGuang HSR, there is no significant accessibility change statistically. This conclusion dose not conflict with the evaluation result in Table 4 that cities have HSR stations built in have an over 30% accessibility improvement. Because when one sample K-S test and independent T-Test are accomplished, all the cities been influenced are considered other than the samples chosen.
4.3. Transportation Equity Analysis
Cities are acting as centripetal as well as centrifugal forces in the whole system [33], which are both connected to the accessibility. The more accessible one city is the more benefit it would have in economic aspect. However, if decisions are made considering monetary aspect only, the disparities between developed regions and undeveloped ones will increase [2]. So the equity issue is an important one to be considered. And the equity among different regions is going to be considered. The following part is going to reveal the equity change through analyzing the change of accessibility. The
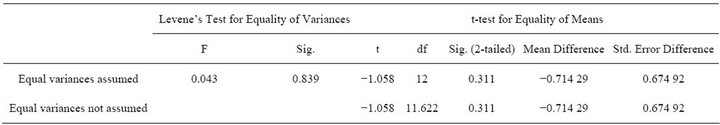
Table 7. Independent samples t-test of accessibility.
Passenger Transportation Balance indexes of the two scenarios are calculated using Equations (3) and (7). Results are presented in Table 8.
By using the data in Table 8, Gini Coefficient can be calculated in Table 9.
The Gini coefficients calculated shows that after HSR is built, the cities influenced are slightly falling into a more unequal situation. However, due to the limited change, there is no potent evidence that WuGuang HSR has changed transportation equity along the transportation corridor.
There are some possible explanations for this slight influence. One is that the HSR would benefit cities in close extent, which resulted in similar change ration of accessibilities. Another is that because the network of HSR is still unfinished, the impacts brought in by a single line are limited.
In conclusion, the advent of HSR would improve the extent of satisfaction of cities’ transportation demand. And it has also slightly worsened the transportation equity.
5. Discussion and Conclusions
This study analyzed various extents of transportation
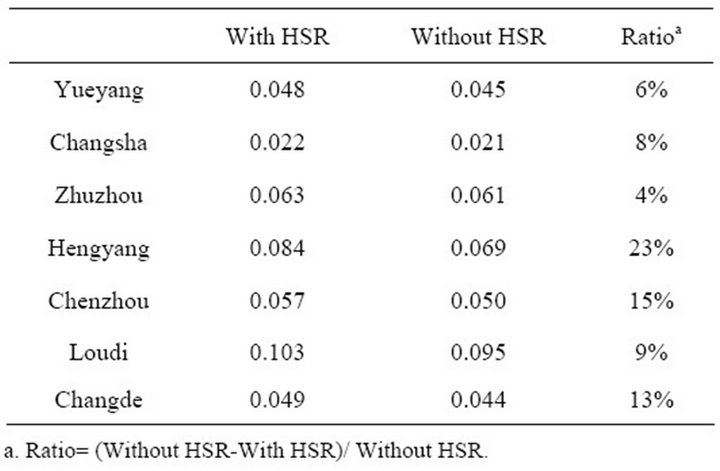
Table 8. The value of Passenger Transportation Balance indexes (Using the data of Generalized weighed travel time).
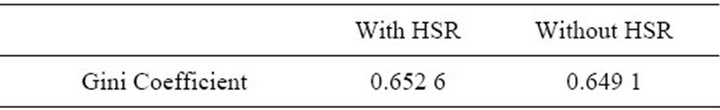
Table 9. Gini coefficient.
equity change and the accessibility change of cities along WuGuang High Speed Rail (HSR) line in China.
High speed is one of the most important features of HSR. According to accessibility evaluation, if travel time is considered only, cities with HSR stations attained a significant improvement in accessibility. The improvement is about 50% comparing with situation without HSR.
However, if the high price due to the cost of building and operating HSR is considered, it is found that there are only small improvements in accessibility, which for the majority of the cities the improvement rate is under 12%. In the process of using the generalized weighed travel time, the time value is slightly overvalued by using per capita GDP. If it is estimated by real income, which will result in a smaller time value, the evaluation would reveal a less impacted accessibility. This should have drawn the attention of HSR planners, that the ticket price of HSR is still unaffordable for a large part of citizens under the current income level in China. The high price determines that most of the WuGuang HSR users are on business trip and their companies will afford the cost. Thus, we suggest administers of HSR to supply discount tickets in low seasons and off-peak hours. Such measures could benefits more people on the one hand. On the other hand, it could help to improve the usage of HSR.
It is commonly believed that accessibility would improve greatly once HSR was built. In this research, the mean accessibility of the region WuGuang HSR lies in is evaluated to find out whether great improvement has occurred. It is found that WuGuang HSR did not statistical change accessibility of the region. The ticket price might be an important reason. Moreover, WuGuang HSR is still a single line other than part of a HSR network at present. And it is not well connected with conventional railway network. This could be possible explanations for the finding that no significant accessibility change is found in this region. That is to say how to take advantage of network effect should be considered in the planning process of HSR lines.
In this research, transportation resource versus transportation demand is defined as Passenger Transportation Balance index. And Transportation equity discussed here, which is a kind of equity among different areas, concerns about the distribution of Passenger Transportation Balance index among different cities. Transportation equity is indicated by Gini coefficient with the results of Passenger Transportation Balance index. According to the evaluation, transportation equity has not been significantly affected. However, it is obvious that cities are not benefiting equally from HSR according to Passenger Transportation Balance index.
What have been achieved could well illustrate how cities would be influenced by HSR in aspects of accessibility and transportation equity. The degrees of the impacts are not only determined by the travel time shorten by HSR, but also determined by some other factors like income level. In future researches, more measurements could be applied to describe how cities would be influenced in more detailed way, like which social groups would benefit most from HSR. Further, how citizens of different group would be influenced as well as how transport equity among different groups would change will be studied by combining residents’ travel choice model with this research in the future.
REFERENCES
- A. Monzón, E. Ortega and E. López, “Efficiency and Spatial Equity Impacts of High-speed Rail Extensions in Urban Areas,” Cities, Vol. 30, 2013, pp. 18-30. doi:10.1016/j.cities.2011.11.002
- J. Shi and N. Zhou, “A Quantitative Transportation Project Investment Evaluation Approach with both Equity and Efficiency Aspects,” Research in Transportation Economics, Vol. 36, No. 1, 2012, pp. 93-100. doi:10.1016/j.retrec.2012.03.002
- B. Santos, A. Antunes and E. J. Miller, “Integrating Equity Objectives in a Road Network Design Model,” Transportation Research Record, Vol. 2089, pp. 35-42.
- U. Blum, K.E. Haynes and C. Karlsson, “Introduction to the Special Issue: The Regional and Urban Effects of High-speed Trains,” The Annals of Regional Science, Vol. 31, No. 1, 1997, pp. 1-20. doi:10.1007/s001680050036
- K. T. Geurs and B. van Wee, “Accessibility Evaluation of Land-Use and Transport Strategies: Review and Research Directions,” Journal of Transport Geography, Vol. 12, No. 2, 2004, pp. 127-140.
- M. Givoni and D. Banister, “Airline and Railway Integration,” Transport Policy, Vol. 13, No. 5, 2006, pp. 386- 397. doi:10.1016/j.tranpol.2006.02.001
- C. Hsu, Y. Lee and Liao C, “Competition between HighSpeed and Conventional Rail Systems: A Game Theoretical Approach,” Expert Systems with Applications, Vol. 37, No. 4, 2010, pp. 3162-3170.
- C. Román, R. Espino and J. C. Martín, “Competition of High-Speed Train with Air Transport: The Case of Madrid-Barcelona,” Journal of Air Transport Management, Vol. 13, No. 5, 2007, pp. 277-284.
- N. Adler, E. Pels and C. Nash, “High-speed Rail and Air Transport Competition: Game Engineering as Tool for Cost-Benefit Analysis,” Transportation Research Part B: Methodological Modelling Non-urban Transport Investment and Pricing, Vol. 44, No. 7, 2010, pp. 812-833. doi:10.1016/j.trb.2010.01.001
- E. Cascetta, A. Papola, F. Pagliara and V. Marzano, “Analy-sis of Mobility Impacts of the High Speed RomeNaples Rail Link Using within Day Dynamic Mode Service Choice Models,” Journal of Transport Geography, Vol. 19, No. 4, 2011, pp. 635-643. doi:10.1016/j.jtrangeo.2010.07.001
- J. Gutiérrez and P. Urbano, “Accessibility in the European Union: the Impact of the Trans-European Road Network,” Journal of Transport Geography, Vol. 4, No. 1, 1996, pp. 15-25. doi:10.1016/0966-6923(95)00042-9
- C. Chen and P. Hall, “The Impacts of High-speed Trains on British Economic Geography: A Study of the UK’s InterCity 125/225 and Its Effects,” Journal of Transport Geography, Vol. 19, No. 4, 2011, pp. 689-704. doi:10.1016/j.jtrangeo.2010.08.010
- A. Reggiani, P. Bucci, G. Russo, A. Haas and P. Nijkamp, “Regional Llabour Markets and Job Accessibility in City Network Systems in Germany,” Journal of Transport Geography, Vol. 19, No. 4, 2011, pp. 528-536. doi:10.1016/j.jtrangeo.2010.05.008
- D. A. Smith and M. Timberlake, “Conceptualising and Mapping the Structure of the World System’s City System,” Urban Studies, Vol. 32, No. 2, 1995, pp. 287-302. doi:10.1080/00420989550013086
- P. Coto-Millán, V. Inglada and B. Rey, “Effects of Network Economies in High-Speed Rail: The Spanish Case,” The Annals of Regional Science, Vol. 41, No. 4, 2007, pp. 911-925. doi:10.1007/s00168-007-0134-6
- J. Martín and G. Nombela, “Microeconomic Impacts of Investments in High Speed Trains in Spain,” The Annals of Regional Science, Vol. 41, No. 3, 2007, pp. 715-733. doi:10.1007/s00168-007-0116-8
- K. E. Haynes, “Labor Markets and Regional Transportation Improvements: the Case of High-speed Trains: An introduction and Review,” The Annals of Regional Science, Vol. 31, No. 1, 1997, pp. 57-76. doi:10.1007/s001680050039
- K. S. Kim, “High-speed Rail Developments and Spatial Restructuring: A Case Study of the Capital Region in South Korea,” Cities, Vol. 17, No. 4, 2000, pp. 251-262. doi:10.1016/S0264-2751(00)00021-4
- M. Givoni, “Development and Impact of the Modern High-Speed Train,” Transport Reviews, Vol. 26, No. 5, 2006, pp. 593-611. doi:10.1080/01441640600589319
- M. Garmendia, J. M. Urea and J. M. Coronado, “Longdistance Trips in A Sparsely Populated Region: The Impact of High-Speed Infrastructures,” Journal of Transport Geography, Vol. 19, No. 4, 2011, pp. 537-551. doi:10.1016/j.jtrangeo.2010.06.002
- D. Banister and M. Thurstain-Goodwin, “Quantification of the Non-Transport Benefits Resulting from Rail Investment,” Journal of Transport Geography, Vol. 19, No. 2, pp. 212-223. doi:10.1016/j.jtrangeo.2010.05.001
- J. M. Urea, P. Menerault and M. Garmendia, “The High-Speed Rail Challenge for Big Intermediate Cities: A National, Regional and Local Perspective,” Cities, Vol. 26, No. 5, 2009, pp. 266-279.
- L. Gou, “The Impact of Inter-City Express Rail Access to Major Metropolitan Area,” Master Thesis, Southwest Jiaotong University, Chengdu, 2009.
- D. Meng, W. Chen and Y. Lu, “Impacts of High-Speed Railway on the Spatial Pattern of the Regional Accessibility in China (in Chinese),” Areal Research and Development, No. 4, 2011, pp. 6-10.
- B. Yang, “Study on the Influence of High-speed Railways on Regional Development,” Master Thesis, East China Normal University, Shanghai, 2011.
- C. Zhang, “High-speed Rail Development Impact of the Urban System,” Master Thesis, Nankai University, Tianjin, 2009.
- H. Zhu, T. You and J. Zhang, “High-Speed Railway Development Impact on Wuhan City (in Chinese),” Comprehensive Transportation, No. 3, 2011, pp. 43-48.
- G. Javier, “Location, Economic Potential and Daily Accessibility: An Analysis of the Accessibility Impact of the High-Speed Line Madrid-Barcelona-French Border,” Journal of Transport Geography, Vol. 9, No. 4, 2001, pp. 229-242. doi:10.1016/S0966-6923(01)00017-5
- H. Jiping, “The Significance and Methods of Research on Travel Time Value and Methods (in Chinese),” Comprehensive Transportation, No. 10, 2008, pp. 64-67.
- X. Ren, “Transportation Infrastructure, Factor Mobility and Manufacturing Location,” Master Thesie, Chongqing University, Chongqing, 2010.
- L. Jianbin, “Survey and Analysis on Passenger Travel Characteristics and Distribution Features of WuhanGuangzhou High Speed Railway,” Railway Standard Design, No. 11, 2011, pp. 1-4.
- Y. Tao, “Research on Economic Impacts of HSR,” Railway Transport and Economy, Vol. 29, No. 1, 2007, pp. 4- 6.
- J. Gutirrez, R. Gonzlez and G. Gmez, “The European High-Speed Train Network: Predicted Effects on Accessibility Patterns,” Journal of Transport Geography, Vol. 4, No. 4, 1996, pp. 227-238.