Journal of Signal and Information Processing
Vol.5 No.1(2014), Article ID:42694,6 pages DOI:10.4236/jsip.2014.51002
Characterisation of Real-World Bus Acceleration and Deceleration Signals
Faculty of Health and Social Sciences, Institute of Complex Health Research, Fresenius University of Applied Sciences, Idstein, Germany.
Email: *haas@hs-fresenius.de
Copyright © 2014 Marietta Kirchner et al. This is an open access article distributed under the Creative Commons Attribution License, which permits unrestricted use, distribution, and reproduction in any medium, provided the original work is properly cited. In accordance of the Creative Commons Attribution License all Copyrights © 2014 are reserved for SCIRP and the owner of the intellectual property Marietta Kirchner et al. All Copyright © 2014 are guarded by law and by SCIRP as a guardian.
Received November 12th, 2013; revised December 12th, 2013; accepted December 19th, 2013
KEYWORDS
Bus Acceleration Signal; Complexity Index; Similarity; Legendre Polynomials; Postural Control; Perturbation; Ecological Validity
ABSTRACT
Public transportation by bus is an essential part of mobility. Braking and starting, e.g., approaching a bus stop, are documented as the main reason for non-collision incidents. These situations are evoked by the acceleration forces leading to perturbations of the passenger’s base of support. In laboratory studies perturbations are applied to getting insight into the postural control system and neuromuscular responses. However, bus perturbations diverge from laboratory ones with respect to duration, maximum and shape, and it was shown recently that these characteristics influence the postural response. Thus, results from posturographic studies cannot be generalised and transferred to bus perturbations. In this study, acceleration (ACC) and deceleration (DEC) signals of real traffic situations were examined. A mathematical approach is proposed in order to identify characteristics of these signals and to quantify their similarity and complexity. Typical characteristics (duration, maximum, and shape) of real-world driving manoeuvres concerning start and stop situations could be identified. A mean duration of 13.6 s for ACC and 9.8 s for DEC signals was found which is clearly longer than laboratory perturbations. ACC and DEC signals are more complex than the used signals for platform displacements in the laboratory. The proposed method enables the reconstruction of bus ACC and DEC signals. The data can be used as input for studies on postural control with high ecological validity.
1. Introduction
Mobility is an important component of most activities of daily living. Its maintenance is necessary for well-being as it allows us to be active within our community. Mobility is essentially based on public transport (e.g., bus, coach, train) in which an increasing number of passengers are reported [1]. Although transportation systems ensure passenger safety, loss of postural control, falls, and serious injuries are well-known side effects [2]. Kirk et al. [3] report over 300,000 casualties per year in Great Britain investigating the time period 1999 to 2001, but only 3% of these casualties involved buses or coaches. Albertsson and Falkmer [4] refer to the Enhanced Coach and Bus Occupant Safety project [5] which found 35,000 people injured in the European Union caused by bus and coach crashes. Moreover, noncollision incidents within standing or driving buses, which are not associated with crashes, are reported regularly in local city transport [3]. Björnstig et al. [6] report 54% non-collision incidents during bus or coach journey within a city in Sweden and suggest that non-crash injuries are as important as crash injuries. Halpern et al. [2] identified situations of braking and starting, e.g., approaching a bus stop or a traffic light, as the main reason for non-collision incidences. These manoeuvres are accompanied by acceleration induced forces exerted to the passenger, hence, leading to perturbations. As in situation of starting from or approaching a bus stop passengers are often not yet or no longer seated, we propose that those situations are especially critical in terms of a high probability of stability loss and resultant falls and injuries.
In order to get insight into mechanisms of postural control, researchers conducted various laboratory experiments and clinical tests. Traditionally, upright stance is analysed under static and dynamic conditions with subjects standing on a platform. Under dynamic conditions, the platform is translated leading to an (un)expected perturbation with the aim to analyse the motor response in terms of balance per formance [7].
Since the early studies of e.g., Nashner [8] or Maki et al. [9], until more recent experiments of e.g., Trivedi et al. [10], various types of perturbations have been investigated due to different commercial or self-manufactured devices (e.g., Figure 1). These perturbations mainly differ with respect to three characteristics, namely duration, maximum, and shape [11,12]. For instance, perturbations applied in laboratory experiments typically last for a fraction of a second up to approximately three seconds [13]. It is clear that the length of the device limits the duration of the generated perturbation (e.g., think of an accelerating sled). It could be shown that the underlying control mechanisms diverge between different types of perturbations [11,13,14]. Tokuno et al. [13] found that longer acceleration-deceleration intervals reveal more age-related differences in the motor response than short intervals. Numerous authors have investigated the question of balance recovery after a perturbation of the supporting platform in laboratory experiments. These studied situations are obviously different from the type of perturbations in public transport [12]. Characteristics of bus acceleration signals described by Palacio et al. [14] diverge from the typical sinusoidal signal applied in laboratory experiments [11]. Thus, different control mechanisms occur and the transferability of the results is limited concerning the demands that a standing passenger faces in the bus. Visser et al. [15] remark that the investigation of real-life conditions and the copy of such situations improves ecological validity of posturography. The goal of the present paper was to characterize real-world acceleration/deceleration signals of buses in daily traffic with a focus on situations of starting from or approaching a stop. This helps to generate input parameters for studies on postural control with the aim of simulating real-life conditions.
2. Methods
Bus acceleration was recorded during everyday traffic in Frankfurt am Main, Germany. An accelerometer was fixed to the floor in the middle of the bus without drivers being aware of the measurement in order to ensure objectivity. Horizontal acceleration (ACC)—starting from a bus stop—and deceleration (DEC)—approaching a bus stop—situations were identified with the help of a realtime commentary on the driving manoeuvres. As the tilt angle of the bus is small, the error introduced into the data due to changes in axis alignment is small and therefore negligible [16]. The data were measured with a sampling frequency of 1000 Hz in units of volt with the software DASYLab10.0. Over a two-point linear calibration the data were transformed into units of gravitation acceleration (g = 9.81 m/s2). The data were low pass filtered (2nd order Butterworth filter) with a cutoff frequency of 2 Hz which was beforehand proved appropriate by a frequency analysis.
The ACC and DEC signals were characterised with respect to their duration, maximum value, and shape. The duration was quantified in units of seconds [s]. The maximum [g] was extracted from the absolute values of the data. In order to quantify the shape of the perturbations, the signals were decomposed in simpler (basis) functions. All signals were transformed into a n-dimensional vector 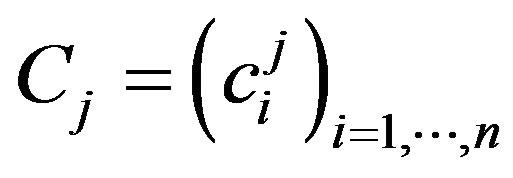 which contains the respective correlation coefficients with the n basis functions (Equation (4)). The choice of the number of basis functions was based on the criterion that a minimum of 90% of the signals variation could be explained (Equation (5)). This resulted in n = 30 for the DEC signals and n = 70 for the ACC signals. Normalised Legendre polynomials
 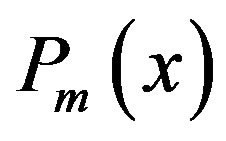 (mth-degree polynomial,
 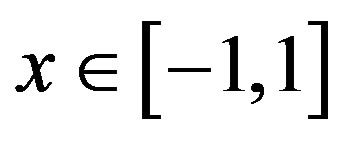 , Section 3.1) were used as basis functions. Polynomials and signals were time-normalised (total duration was set 100%) and up-sampled to 10000 data points by cubic spline interpolation. In addition, the signals were detrended by the mean so that the correlation with
  (constant function) was set zero. Based on the correlation vectors, the complexity of each signal was computed in a first step. The complexity of the signals is defined as the entropy of the squared correlation coefficients. Hence, the complexity of the signal
  is given by:
 . (1)
. (1)
Here,  = 100 Legendre polynomials were used in order to have almost the same variation explained for all signals. Strictly speaking, for every signal
  it should hold
 . The complexity is the higher the more Legendre Polynomials are needed to explain the signals variations. Hence, a low index indicates that the signal can be reconstructed well by a few polynomials.
In a next step, the similarity of the shape between two signals  and
and  was quantified. Therefore, the correlation vectors of each two signals were correlated yielding a similarity index SI with
  (Sec-
(Sec-

Figure 1. Exemplary perturbation signal (right panel) applied in a laboratory experiment by means of a typical laboratory device (left panel). In dynamic posturography a perturbation signal is applied to a movable platform on which a subject is instructed to maintain upright posture.
tion 3.2: Equation (1)). The similarity index is a normalised value between −1 and 1.  implies a 100% positive fit and
  a 100% negative fit (Figure 2). All computations were done in Matlab (R2008b).
3. Calculation
In this section we present the underlying calculation methods concerning Legendre Polynomials, correlation between the signal and Legendre Polynomials, and the reconstruction of the signals.
3.1. Legendre Polynomials
The nth-degree Legendre polynomial 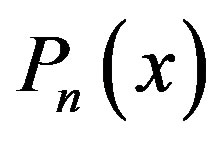 can be expressed using Rodrigues formula:
 . (2)
. (2)
The family  forms an orthonormal basis (ONB) on the Hilbert space V after normalisation which means that the following equation holds
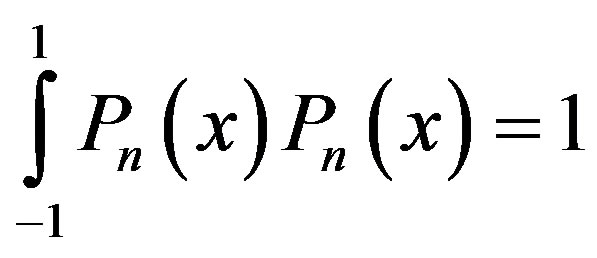 . (3)
. (3)
3.2. Correlation
Computation of the n-dimensional correlation vector between the jth signal  and the Legendre polynomials up to degree n:
 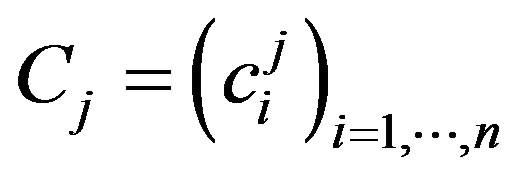 with
with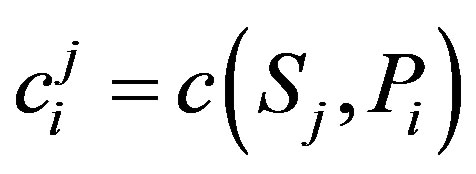 .
.
The correlation coefficient 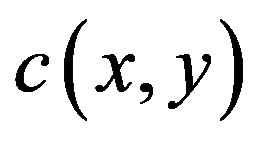 between two discrete signals
 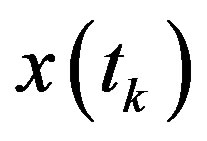 and
and 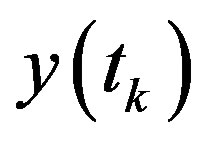 of length
  with respect to the
  (space of square integrable functions) inner product is defined as
 .(4)
.(4)

Figure 2. Similarity index (SI) between three exemplary curves. SI = 1 implies a 100% positive fit.
The number  of Legendre polynomials was determined by the amount of polynomials which are necessary to explain a minimum of 90% of the signals variation. Thus,
  was chosen so that the following inequality holds
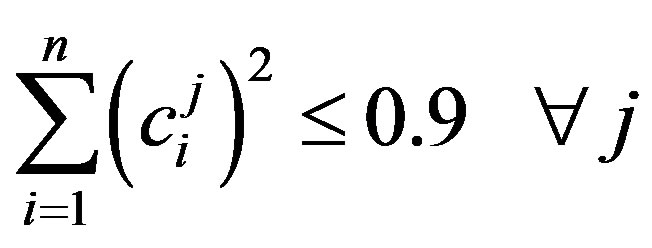 . (5)
. (5)
3.3. Reconstruction of Signals
Each signal  can be represented as a weighted sum of the basis functions:
 ,
,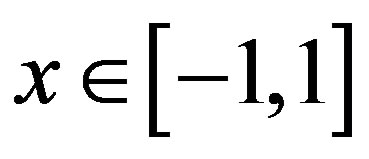 (6)
(6)
with  is the ith-degree Legendre polynomial and
  is the ith weight given by the formula:
 (7)
(7)
with  = 10000 (number of data points). The signals are reconstructed (Figure 3) based on the weights
 ,
,  ( Appendix) which correspond to the
  Legendre polynomials (n = 30 for DEC and n = 70 for ACC).
4. Results
35 DEC and 34 ACC situations were extracted. Table 1 summarises descriptive data concerning duration and

Figure 3. Typical bus deceleration DEC (left) and acceleration ACC (middle, right) signals (black line) and their reconstruction (turquoise line) based on Legendre ploynomials (Section 3.3, Appendix). Acceleration is measured in g = 9.81m/s2. Signals are time normalised.

Table 1. Sample mean ± standard deviation concerning the duration, maximum (g = 9.81 m/s2), and complexity of DEC (approaching a bus stop) and ACC (starting from a bus stop) signals.
maximum, as well as complexity of the perturbation signals. On average, ACC situations have a longer duration, a smaller maximum and a larger complexity value than DEC situations (Table 1). Looking at the similarity of the shape between DEC signals, it is SI > 0.7 for 80% with respect to one identified typical signal profile (Figure 3, left). The other 20% have a low similarity (SI < 0.6) to all the other signals. Concerning the ACC signals, the similarity indices rarely exceed 0.9. However, two typical profiles are identified where 79% of the signals can be related to with SI > 0.7 (Figure 3, middle and right).
5. Discussion
In this study, acceleration (starting) and deceleration (stopping) profiles of real traffic situations were examined. A mathematical approach is proposed to identify and describe common characteristics of these signals. It is shown that real-world driving manoeuvres result in mainly similar acceleration and deceleration profiles. Typical characteristics concerning duration, maximum and shape of the signals could be identified which are different from signals applied in laboratory settings. Furthermore, the proposed method enables the reconstruction of bus acceleration and deceleration perturbations. This can be used as input data for further research on postural control. For instance, in a previous investigation we applied the proposed method to verify that simulated bus accelerating and bus stopping maneuvres are similar to real world signals Haas et al. [17]. Concerning observed maximum values, acceleration and deceleration signals are rather consistent, and fit to those reported in earlier studies on bus perturbations [14,18,19]. This indicates a generalisation of results with respect to different regions.
Maximal acceleration values are quite similar to laboratory values (e.g., [13]). The duration of real-world perturbations is clearly longer than perturbations generated in laboratory experiments. The longest interval of a perturbation signal in a laboratory setting was approximately three seconds [13,20]. The purpose of dynamic posturography is to get insight into human postural control (e.g., the response of the neuromuscular system) by perturbing the base of support of a standing subject which is comparable to bus perturbations from a mechanical point of view. Although various studies have evaluated postural responses to support surface translations of standing persons, the transferability of these results to bus perturbations should be seen rather critical. Frank and Patla [21] remark that situations in sterile environments (e.g., laboratory) do not simulate the environmental challenges one faces in the community. To our knowledge, there is only one experiment that has the scope to simulate driving manoeuvres of buses by means of an accelerating sled [22]. The authors investigated human behaviour towards abrupt bus stopping situations (emergency breaking, or collisions), but not usually occurring starting or stopping events in daily traffic. Moreover, their analysed perturbations only last for about 400 ms which deviates from real-world bus perturbations.
In the present study, the proposed method enables the characterisation and reconstruction of bus acceleration and deceleration signals. These signals have a complex structure due to the occurrence and amount of acceleration changes (jerk), and consequently, are different from the rather simple composition of postural perturbations obtained in laboratory settings. Hence, standing in a bus implies a more challenging situation. With regard to prevailing limitations in laboratory studies, future studies have to investigate real-world driving manoeuvres and their influence on the postural response to standing passengers. Horak et al. [7] argue that results of laboratory perturbation experiments can account for knowledge of postural responses when passengers in public transport are perturbed. However, this implication does not hold as postural reactions are dependent on the duration [13,20], maximum [23], shape [11,13], and jerk events [18]. On account of these facts, Haas et al. [17] examined the effect of starting and stopping manoeuvres of subjects while standing in a bus. This procedure seems to be the most valid method to comply with the complex structure of real-world bus perturbations. However, as we have shown that these perturbations can be classified in terms of similarity, the identified bus perturbations could deliver relevant input data for further research on postural control. Palacio et al. [14] recorded bus acceleration signals from usual starting and stopping manoeuvres which they used as input for computer simulations to investigate possible injuries of a standing passenger in the bus. However, the simulations were only based on three exemplary pulses which were short intervals of 4 - 5 s duration. This approach has to be enlarged by considering the whole signal in order to model the complete starting/ stopping situation. It is well known that the human postural control system is nonlinear [24,25]. Thus, balance is dependant on initial standing conditions (e.g., standing direction, foot placement, anticipation) and small variations in perturbation timing, force, or complexity could result in completely different outcomes.
6. Conclusion
Typical characteristics of bus perturbations could be identified which deviate from perturbations generated in laboratory settings. They deliver relevant input data for further research on postural control, giving rise to a higher ecological validity. The identification of thresholds (mechanical or physiological) for critical situations (e.g, falls) concerning the three parameters duration, maximum, and shape is essential to prevent injuries in public transport. This may be the first step to classify real-world perturbation signals and to create a risk model for public transportation.
Acknowledgements
This research was supported by the LOEWE focus PreBionics.
REFERENCES
- U. Reim and B. Reichel, “Öffentlicher Personenverkehr mit Bussen und Bahnen 2011,” Technical Report, Statistisches Bundesamt, Wirtschaft und Statistik, 2013.
- P. Halpern, M. Siebzehner, D. Aladgem, P. Sorkine and R. Bechar, “Non-Collision Injuries in Public Buses: A National Survey of a Neglected Problem,” Emergency Medicine Journal, Vol. 22, No. 2, 2005, pp. 10-110. http://dx.doi.org/10.1136/emj.2003.013128
- A. Kirk, R. Grant and R. Bird, “Passenger Casulaties in Non-Collision Incidents on Buses and Coaches in Great Britain,” Proceedings of the 18th International Technical Conference on the Enhanced Safety of Vehicles, Nagoya, 2003.
- P. Albertsson and T. Falkmer, “Is There a Pattern in European Bus and Coach Incidents? A Literature Analysis with Special Focus on Injury Causation and Injury Mechanisms,” Accident Analysis & Prevention, Vol. 37, No. 2, 2005, pp. 225-233. http://dx.doi.org/10.1016/j.aap.2004.03.006
- ECBOS, “Task 1.1 Statistical Collection,” Concept Report (Annex, No. 1:1), Technical Report, Technical University Graz, 2001.
- U. Björnstig, P. Albertsson, J. Björnstig, P.-O. Bylund, T. Falkmer and J. Petzäll, “Injury Events among Bus and Coach Occupants—Non-Crash Injuries as Important as Crash Injuries,” IATSS Research, Vol. 29, No. 1, 2005, pp. 79-87.
- F. B. Horak, S. M. Henry and A. Shumway-Cook, “Postural Perturbations: New Insights for Treatment of Balance Disorders,” Physical Therapy, Vol. 77, No. 5, 1997, pp. 517-533.
- L. M. Nashner, “Adapting Reflexes Controlling the Human Posture,” Experimental Brain Research, Vol. 26, No. 1, 1976, pp. 59-72. http://dx.doi.org/10.1007/BF00235249
- B. E. Maki, P. J. Holliday and G. R. Fernie, “Aging and postural control. A comparison of Spontaneousand Induced-Sway Balance Tests,” Journal of the American Geriatrics Society, Vol. 38, No. 1, 1990, pp. 1-9.
- H. Trivedi, J. A. Leonard, L. H. Ting and P. J. Stapley, “Postural Responses to Unexpected Perturbations of Balance during Reaching,” Experimental Brain Research, Vol. 202, No. 2, 2010, pp. 485-491. http://dx.doi.org/10.1007/s00221-009-2135-4
- L. Brown, J. Jensen, T. Korff and M. Woollacott, “The Translating Platform Paradigm: Perturbation Displacement Waveform Alters the Postural Response,” Gait Posture, Vol. 14, No. 3, 2001, pp. 256-263. http://dx.doi.org/10.1016/S0966-6362(01)00131-X
- M. Tillmann, P. Schubert, T. Getrost, D. Schmidtbleicher and C. Haas, “Pattern Analysis of Perturbations in Public Transport,” VII International Association of Gerontology and Geriatrics (IAGG) Congress “Healthy and Active Ageing for All Europeans II”, Bologna, 2011, p. 223.
- C. Tokuno, A. Cresswell, A. Thorstensson and M. Carpenter, “Age-Related Changes in Postural Responses Revealed by Support-Surface Translations with a Long Acceleration-Deceleration Interval,” Clinical Neurophysiology, Vol. 121, No. 1, 2010, pp. 109-117. http://dx.doi.org/10.1016/j.clinph.2009.09.025
- A. Palacio, G. Tamburro, D. ONeill and C. Simms, “Non-Collision Injuries in Urban Buses—Strategies for Prevention,” Accident Analysis & Prevention, Vol. 41, No. 1, 2009, pp. 1-9. http://dx.doi.org/10.1016/j.aap.2008.08.016
- J. Visser, M. Carpenter, H. van der Kooij and B. Bloem, “The Clinical Utility of Posturography,” Clinical Neurophysiology, Vol. 119, No. 11, 2008, pp. 2424-2436. http://dx.doi.org/10.1016/j.clinph.2008.07.220
- J. Kavanagh and H. Menz, “Accelerometry: A Technique for Quantifying Movement Patterns during Walking,” Gait Posture, Vol. 28, No. 1, 2008, pp. 1-15. http://dx.doi.org/10.1016/j.gaitpost.2007.10.010
- C. T. Haas, P. Schubert, M. Kirchner, T. Getrost and M. Liebherr, “Der Stehende Fahrgast im Stadtbus. Biomechanische Anforderungen und assoziiertes Sturzrisiko,” Der Nahverkehr, Vol. 31, No. 6, 2013, pp. 51-55.
- B. D. Graaf and W. V. Weperen, “The Retention of Balance: An Exploratory Study into the Limits of Acceleration the Human Body Can Withstand without Losing Equilibrium,” Human Factors, Vol. 39, No. 1, 1997, pp. 111-118. http://dx.doi.org/10.1518/001872097778940614
- J. Zaworski, K. Hunter-Zaworski and M. Baldwin, “Bus Dynamics for Mobility-Aid Securement Design,” Assistive Technology, Vol. 19, No. 4, 2007, pp. 200-209. http://dx.doi.org/10.1080/10400435.2007.10131877
- M. Carpenter, A. Thorstensson and A. Cresswell, “Deceleration Affects Anticipatory and Reactive Components of Triggered Postural Responses,” Experimental Brain Research, Vol. 167, No. 3, 2005, pp. 433-445. http://dx.doi.org/10.1007/s00221-005-0049-3
- J. S. Frank and A. E. Patla, “Balance and Mobility Challenges in Older Adults. Implications for Preserving Community Mobility,” American Journal of Preventive Medicine, Vol. 25, No. 3, 2003, pp. 157-163. http://dx.doi.org/10.1016/S0749-3797(03)00179-X
- T. Robert, P. Beillas, A. Maupas and J. P. Verriest, “Conditions of Possible Head Impacts for Standing Passengers in Public Transportation: An Experimental Study,” International Journal of Crashworthiness, Vol. 12, No. 3, 2007, pp. 319-327. http://dx.doi.org/10.1080/13588260701433552
- B. E. Maki and W. E. McIlroy, “The Role of Limb Movements in Maintaining Upright Stance: The ‘Change-inSupport’ Strategy,” Physical Therapy, Vol. 77, 1997, pp. 488-507.
- L. H. Ting, K. W. van Antwerp, J. E. Scrivens, J. L. McKay, T. D. Welch and J. T. Bingham, “Neuromechanical Tuning of Nonlinear Postural Control Dynamics,” Chaos, Vol. 19, No. 2, 2009, Article ID: 026111. http://dx.doi.org/10.1063/1.3142245
- J. T. Cavanaugh, K. M. Guskiewicz and N. Stergiou, “A Nonlinear Dynamic Approach for Evaluating Postural Control: New Directions for the Management of SportRelated Cerebral Concussion,” Sports Medicine, Vol. 35, No. 11, 2005, pp. 935-950. http://dx.doi.org/10.2165/00007256-200535110-00002.
In the following, the weights of the typical DEC (WDEC) signal (Figure 3, left panel) and two ACC (WACC) signals (Figure 3, middle and right panel) are presented:
WDEC1 = 10 − 2(−7.089, 3.078, 2.268, 0.974, 0.307, 1.289, 1.066, 0.831, 0.350, −0.738, 0.378, 0.122, −0.389, 0.448, 0.026, −0.068, −0.127, 0.332, − 0.004, −0.290, 0.213, 0.088, 0.010, −0.385, −0.150, 0.439, −0.095, −0.209, 0.022, 0.183)
WACC1 = 10 − 2(−3.097, −0.602, 1.204, −0.761, 0.222, −0.512, 0.801, −1.114, 0.303, −0.269, −0.017, 0.232, −0.444, 0.137, −0.310, 0.211, −0.106, −0.105, 0.169, −0.157, 0.104, −0.175, 0.141, 0.168, −0.156, 0.042, 0.096, −0.167, 0.036, 0.074, 0.013, −0.090, −0.006, 0.268, −0.330, 0.102, 0.293, −0.379, 0.147, −0.068, −0.100, 0.208, −0.242, 0.033, 0.027, 0.010, 0.087, −0.173, 0.155, −0.103, −0.166, 0.168, 0.008, 0.193, 0.005, −0.511, 0.314, 0.186, −0.431, 0.257, 0.011, −0.095, 0.048, −0.126, 0.272, −0.245, −0.021, 0.183, −0.308, 0.287)
WACC2 = 10 − 2(−1.411, −4.088, 1.118, −0.608, 0.406, −0.790, −0.371, 0.693, −0.130, 0.029, 0.253, −0.135, 0.007, 0.358, −0.312, −0.296, −0.233, 0.368, 0.444, −0.515, −0.123, 0.134, 0.224, −0.104, 0.077, 0.153, −0.400, 0.058, −0.024, 0.054, 0.205, −0.245, 0.015, 0.277, −0.296, −0.367, 0.615, 0.042, −0.458, 0.343, 0.043, −0.442, 0.102, 0.228, −0.162, 0.067, 0.119, −0.131, 0.050, −0.151, −0.143, 0.359, 0.135, −0.492, 0.075, 0.328, −0.353, − 0.032, 0.379, −0.191, −0.199, 0.239, −0.039, −0.255, 0.236, 0.092, −0.228, 0.045, 0.065, −0.186)
NOTES
*Corresponding author.

