Journal of Biomaterials and Nanobiotechnology
Vol.4 No.2A(2013), Article ID:29840,10 pages DOI:10.4236/jbnb.2013.42A002
Physicochemical Properties of Pyrolysis Bio-Oil from Sugarcane Straw and Sugarcane in Natura
![]()
1Instituto de Química, Universidade Federal do Rio de Janeiro (UFRJ), Rio de Janeiro, Brazil; 2Escola de Química, Universidade Federal do Rio de Janeiro (UFRJ), Rio de Janeiro, Brazil; 3Faculdade de Engenharia Mecânica, Universidade Estadual de Campinas (UNICAMP), Campinas, Brazil; 4Faculdade de Engenharia Agrícola, Universidade Estadual de Campinas (UNICAMP), Campinas, Brazil; 5Instituto de Química, Universidade do Estado do Rio de Janeiro (UERJ), Rio de Janeiro, Brazil.
Email: *maciel@iq.ufrj.br
Copyright © 2013 Josilaine A. C. Durange et al. This is an open access article distributed under the Creative Commons Attribution License, which permits unrestricted use, distribution, and reproduction in any medium, provided the original work is properly cited.
Received January 16th, 2013; revised February 20th, 2013; accepted April 5th, 2013
Keywords: Sugarcane; Pyrolysis; Bio-Oil Characterization
ABSTRACT
Under the renewable energy context, sugarcane biomass pyrolysis has been growing as a convenient route to produce bio-oil, which can be set into the chemical industry and refineries as building blocks or combustion fuel. In this work sugarcane straw was submitted to direct pyrolysis in a fluidized bed pilot plant at 500˚C, in presence of air. Sugarcane in natura was also pyrolysed as a model for comparison, in order to determine the viability of processing different sources of raw biomass. The physicochemical characterization of the biomass precursors as well as of the bio-oils was also carried out, which points both biomass feedstocks as suitable for bio-oil production in terms of viscosity, surface tension, density and acidity. The bio-oil obtained from sugarcane in natura presented higher carbon and hydrogen content as well as lower oxygen content. On the other hand, the metal content is higher in the bio-oil obtained from sugarcane straw, in special the iron and potassium contents were 807 ppm and 123 ppm against 27 ppm and 1 ppm in the bio-oil from sugarcane in natura. Aliphatic and aromatic compounds as well as carbohydrates scaffolds were identified as the main components of the bio-oil. GC-MS analyses showed aromatic products from lignine fragmentation and free sugars and sugar derivatives.
1. Introduction
The reduction of the use of fossil fuels has been proposed and encouraged in order to minimize the greenhouse gases and particulate emissions, pointed out by some authors as one of the causes for the global warming [1]. Under this context, biomass has emerged as a renewable source of energy, contributing to a clean and sustainable fuel economy [2]. Some of the biomass derivatives destinations include production of combustion fuel by catalytic improvement [3], manufacture of feedstocks and building blocks for chemical industry, derived from both cellulosic carbohydrates [4] and lignin components [5], production of H2 through chemical reforming [6], among others.
Sugarcane is an excellent source of biomass in Brazil, where the sugar and alcohol industries are well established and have a high capacity of production [7,8]. Considering the stimulus for the production of ethanol as complement to the fossil fuel obtained from refineries, the linkage between the alcohol industry and the sugarcane bagasse processing is mandatory to take out the maximum energy from the biomass, minimizing at the same time the impact in the environment and increasing the profitability of the sugarcane plantations. Besides the use of biomass as a second generation fuel feedstock, it can also be considered as a primary source of renewable energy, which can progressively enhance the CO2 mitigation.
Pyrolysis has been the most employed thermochemical conversion for transformation of biomass residues into charcoal and bio-oil, by one side due to the easy implementation of the technology nearby the farm crops and by other side due to the easy transportation of a denser product to further treatment in the refineries [9-11].
The liquid product obtained from biomass pyrolysis is a complex mixture of oxygenated, aromatic and carbohydrate derived compounds, with a wide range of molecular weight, generated from the fragmentation of cellulose, hemicellulose and lignin, and from further polymerization and degradation reactions due to the high temperature used in the process [8-10,12,13]. Such bio-oils are viscous materials, with high acidity and corrosivity. They usually posses a high oxygen content and lower carbon and hydrogen content than the fossil fuel. Because the bio-oil is rich in functional groups, it is a thermodynamically unstable liquid.
Combustion tests of pyrolysis bio-oil showed high burning efficiency, comparable to those of commercial fuels [12]. The high potential of these products as combustion fuel is counterbalanced by their high water content (around 15%), high viscosity (0.04 0.1 Pas·s at 50˚C) and by the presence of residual solid particles [14]. Therefore, its properties can be improved by performing a catalytic upgrade process, combined or not with previous hydrotreatment. This sequence of treatment has being successfully applied to several types of bio-oils [15-17] and the more hydrogen amount is used in the hydrotreament the lower oxygen content is observed in the final products. Moreover, bio-oil has also been upgraded over conventional acid catalysts as zeolites for oxygen removal and cracking into light olefins and aromatics, important feedstocks for petrochemical industry [15].
Considering the increasing appeal for the use of renewable sources of energy, the aim of this work is to produce a pyrolysis bio-oil in a pilot plant, from sugarcane straw, a new second generation biomass sources, and from sugarcane in natura, as an example for directly introduced biomass into pyrolysis process. The determination of the physicochemical properties of the product was carried out in order to evaluate the feasibility of its application in the refinery for further catalytic improvement to combustion fuel. Although most of this sort of study has been done with sugarcane bagasse, in natura samples could also be used as feedstock from specially dedicated farm crops.
2. Material and Methods
2.1. Preparation and Characterization of the Sugarcane Samples
The sugarcane samples used in this work are from a special variety rich in fiber, developed for energetic purpose and provided by the company Canavialis. The sugarcane was dried and milled. A random sampling of the sugarcane was carried out, and two feedstocks for the pyrolysis studies were selected: sugarcane in natura (whole sugarcane), producing the bio-oil named BIOSC, and sugarcane straw (green and dry leaves), giving the bio-oil named BIOSS. Granulometric analyses (ASTM E828) were carried out using a set of W.S. TYLER™ Stainless Steel Test Sieves. The mean diameter of the particles were calculated based on the Sauter mean diameter expression: , where: xi is the mass fraction of the particles with mean diameter dpi; dpi is the mean diameter of the particles retained between one test sieve and its subsequent, in mm.
The humidity of the fresh sugarcane samples was determined for the sugarcane in natura and straw. Analyses to determine the fractions in weight for humidity, volatiles, ashes and fixed carbon on the dry samples were carried out. The humidity was determined according to the regulation ASTM E871, the samples were oven dried at 104˚C - 110˚C under air circulation until no mass variation was observed. The volatile fraction was determined by heating the samples in an open crucible at 850˚C for six minutes, according to the regulations ASTM E872 and ASTM E897. The ashes were quantified by heating the samples at 750˚C for two hours, according to the regulation ASTM D1102. The calorific power was determined by the calorimetric bomb technique (ASTM D2015), where the heat released by the combustion of the biomass with oxygen (initiated by an electric ignition) was measured. The water-bath temperature was measured over time, and from the plots of heating and cooling, the energy released during the combustion process was determined. The experiment was conducted under adiabatic conditions, which allowed the determination of the superior calorific power at constant volume, which can be converted to inferior calorific power by analytic calculations.
2.2. Sugarcane Pyrolysis in the Thermogravimetric Balance
Pyrolysis tests of the sugarcane in natura were carried out in a thermogravimetric balance, BP Engenharia, Model RB-300-200. The sugarcane feedstock was grounded and sun dried, with 10% - 15% of humidity. In the experiments, 5 grams of biomass was placed in a nickel crucible. The liquids and gases formed during the experiments were collected through the condensers (cooled with ice) and the electrostatic precipitator, respectively. The collected gases were analyzed by gas chromatography using a CG-90 equipment, with a thermal conductivity detector, using argon as carrier gas, equipped with three columns: a 5 Å molecular sieve column, of 3.15 ´ 10−3 m of diameter and 2 m of length; a Porapak N column, with 3.175 ´ 10−3 m of diameter and 6 m of length; a Chromosorb column, with 1.18 ´ 10−3 m of diameter and 1 m of length. The chromatography was calibrated with a standard gas mixture containing N2 (60%), H2 (10%), CH4 (10%), CO (10%) and CO2 (10%), in volume. The data analyses were performed using the software PeakSimple 2.83, from SRI Instruments, USA. This set of columns allowed the analyses of the gases H2, O2, N2, CH4, CO and CO2. The analysis condition is: line pressure: 608 kPa; gas flow: 30 mL/min; detector temperature: 100˚C; oven temperature: 35˚C; filament current: 70 mA.
2.3. Sugarcane Pyrolysis in the Pilot Plant
The pyrolysis tests of the sugarcane in natura and straw were also carried out under fast pyrolysis conditions, in a Bioware pilot plant, model PPR-20, with a fluidized bed reactor (Figure 1). The pilot plant has a feed capacity of 20 kg of biomass per hour. Figure 2 shows a scheme with the main components of the plant. The feed of the reactor with the biomass was carried out by a dosimeter with a silo (1), at a regulated velocity of transportation into the pyrolysis reactor (2). After the fast pyrolysis, solid (coal), gases and bio-oil were formed. The coal was separated by the cyclones (3) and stored in a silo (4). The bio-oil was separated in the recovery system (5). The combustion chamber is coupled to a heat exchanger. The heat was used to warm the fluidization air. Temperature and pressure in different parts of the plant were monitored by an acquisition data system.
Initially, the reactor is fed with 6 kg of sand, which functions as a bed improving the heat and mass transfer in the reactor. Through an electric resistance, the sand temperature is raised to 500˚C before starting the operation. Then, the biomass is transferred from the silo to the reactor, the air flow is controlled by a rotameter to keep
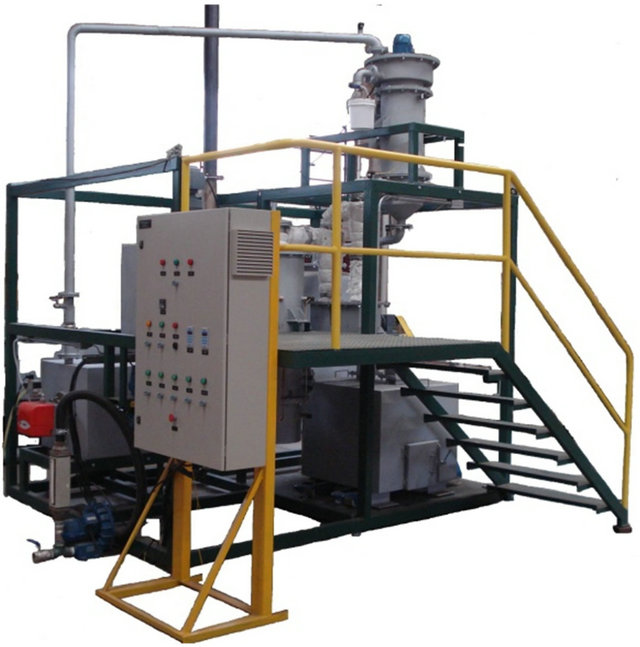
Figure 1. Picture of the bioware pilot plant, model PPR-20.
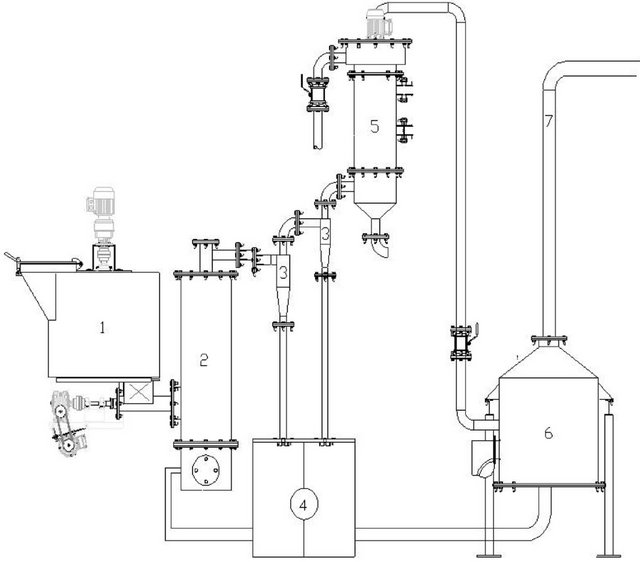
Figure 2. Diagram of the fast pyrolysis pilot plant, model PPR-20, Bioware: (1) silo, (2) fluidized bed reactor, (3) two cyclone separators units, (4) silo for coal storage, (5) bio-oil separator, (6) combustion chamber.
the temperature of the reactor and the fluidized bed between 470˚C - 500˚C. The bio-oil recovery system and the combustion chamber are then turned on. In the recovery, the bio-oil is separated in light bio-oil (acid extract) and heavy bio-oil (more viscous fraction). The parameters of the plant operation are: sugarcane granulometry = 0.78 mm; inert granulometry = 0.27 mm; height of the inert bed = 150 mm; air flow = 10 m3/h; pressure inside the reactor = 50 - 80 mmH2O; biomass fed rate = 19.5 kg/h; water flow in the bio-oil separator = 2 L/min. The biomass space-time is estimated as 10 seconds.
Mass balance: the mass balance for the pyrolysis process was calculated according to the following mathematical expressions:
fed biomass + air flow Þ light bio-oil + heavy bio-oil + coal + gases Gas flow in the outlet:
 (1).
(1).
Product yields:
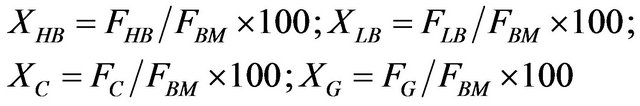 (2)
(2)
where: F = flow; X = yield; BM = fed biomass; air = fluidization air; HB = heavy bio-oil; LB = light bio-oil; C = coal; G = gases.
Energy balance: the energy balance for the pyrolysis process was calculated according to the following mathematical expressions:
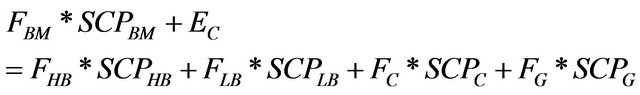 (3)
(3)
where: Ec is the energy consumed during the process; SCPHB is superior calorific power of the component i. SCPG was estimated based on the ideal gas mixture determined in the thermogravimetric balance experiment, considering for the gases H2, CH4 and CO the following superior calorific power, 34,000 kcal·kg−1, 13,250 kcal·kg−1 and 2440 kcal·kg−1, respectively. The oxygen and nitrogen mass balance can not be properly estimated once the former can be partially incorporated into the liquids and solids products and the latter was used as carrier gas for performing the GC analysis. The formed gas amount was estimated by difference according to Equation (1), then this value was subtracted to the nitrogen amount in the airflow stream, therefore the gas composition was used without considering the nitrogen content. It is important to point out that the contribution of the gas flow is largely inferior to those values observed for the others fractions and did not contribute much to the overall energy balance, as shown in the discussion part. Therefore, the above assumptions did not compromise at all the pilot plant energy balance.
2.4. Determination of the Bio-Oil Physicochemical Properties
The preparation of the bio-oil samples for characterization was carried out as follow: crude bio-oil was filtered to remove solid residues, and then solubilized in acetone. The insoluble material was filtered out under reduced pressure to give the polar fraction. Subsequently, the residue was suspended in toluene to extract the non-polar components, the solid residue was filtered out again under reduced pressure. The polar and non-polar fractions were combined and the solvent was removed in a rotary evaporator.The water content was determined by Karl Fisher titration using a 841 Methrom equipment, applying the methodology used to determine water in petrochemicals (ASTM D6304). The acidity of the bio-oil was determined by potentiometric titration according to the methodology ASTM D664 (841 Titrando with Touch Control, 803 KF Titration Stand and Reagent Organizer). Viscosity was measured using a ARES TA rheometer with a Couette geometry and the temperature was set to 25˚C and 60˚C. The methodology employed was step rate test with a shear rate of 200 s−1, 100 s−1, 75 s−1, 10 s−1 and 5 s−1. Density and surface tension were determined by a Kruss-processor K-100 tensiometer, using the Wilhelmy plate method to determine the surface tensions. X-ray fluorescence analyses were carried out in a Bruker AXS spectrometer S4-Explorer Model. Elemental analyses (CHN) were acquired in a Perkin Elmer 2400 CHN apparatus with relative error in the measurements lower than 0.5%. The oxygen content was calculated by subtraction. The Fourier Transform Infrared (FT-IR)
spectroscopy was performed in a Nicollet-Magna 760 (4000 - 400 cm−1). NMR spectra were acquired in a Bruker 200 spectrometer, using deuterated acetone as solvent. GC-MS analyses were carried out in a HP6890 equipment, with a HP-5MS column (30 m ´ 250 mm ´ 0.25 mm), using He as carrier gas. Analysis conditions: initial temperature = 40˚C; initial holding time = 1 min; rate = 5˚C/min; final temperature = 290˚C; final holding time = 10 min.
3. Results and Discussion
The sugarcane used in this work is from a special variety rich in fiber, developed for energetic purpose and it is composed of 16.63 wt% of straw, 57.23 wt% of stalk and 26.14 wt% of tip leaf. Two samples were selected for the pyrolysis studies: the sugarcane straw and the sugarcane in natura (whole sugarcane). The humidity of the fresh samples differs considerably for the different parts of the plant. For the straw the humidity was only 15.83 wt%, and for the sugarcane in natura (whole sugarcane) it was 65.28 wt%, mainly because the high water content in the stalk (70.10 wt%).
The oven dried sugarcane feedstock samples were also characterized in order to determine their humidity, volatiles, fixed carbon and caloric power, and the results were quite similar for the different parts of the plant. The humidity in the straw was 10.41 wt% and in the sugarcane in natura was 10.74 wt%. The granulometry of the straw can be described by three populations: P1 (39.34 wt%; dp = 0.24 mm); P2 (37.30 wt%; dp = 0.84 mm); P3 (23.37 wt%; dp = 1.69 mm); weighted mean diameter = 0.81 mm, as well as for the sugarcane in natura: P1 (42.88 wt%; dp = 0.20 mm); P2 (35.72 wt%; dp = 0.85 mm); P3 (21.41 wt%; dp = 1.70 mm); weighted mean diameter = 0.76 mm.
The fixed carbon content (dry basis) was higher for the sugarcane in natura (15.37 wt%) than for the straw (12.68 ± 1.68 wt%). By other side, the volatiles content was higher in the straw (82.60 ± 1.13 wt%) than in the in natura sample (81.9 wt%), as well as the ashes (4.72 ± 0.1 wt% in the straw and 2.8 wt% in the sugarcane in natura). The calorific power in the sugarcane in natura (18.1 ± 0.7 MJ·kg−1) was higher than in the straw (17.8 ± 0.7 MJ·kg−1).
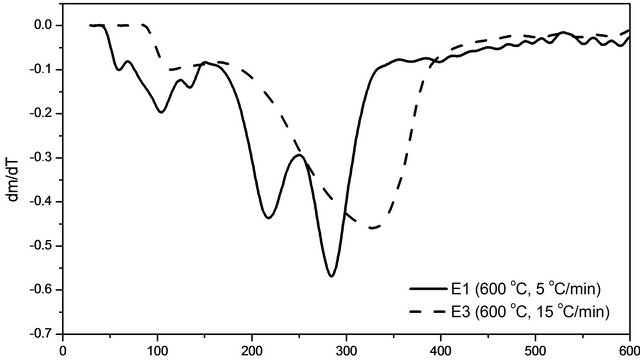
The thermogravimetric analyses were carried out for the sugarcane in natura at several heating rates and final temperatures, as an example the result at 5˚C/min and 600˚C is shown in Figure 3—solid line. Three peaks at 102˚C, 216˚C and 284˚C and a shoulder around 350˚C were observed. These peaks are related to water release and to hemicellulose, cellulose and lignin thermal decompositions, as reported in the literature. At higher a heating rate, it was not possible to discriminate the thermal
Temperature [˚C]
Figure 3. DTA curves for the sugarcane in natura.
degradation of the biomass components (Figure 3—dashed line).
In the experiments carried out in the thermogravimetric balance for the sugarcane in natura, the yields of the process were calculated. At a final temperature of 600˚C and heating rate of 5˚C/min, 57.34% ± 1.17% of liquids, 26.25% ± 0.79% of solids and 16.41% ± 0.58% of gases were formed. At the same heating hate and at higher final temperature (900˚C) more gases (19.47% ± 0.58%) and less liquid (55.12% ± 1.17%) and solids (25.41% ± 0.79%) were formed. By other side, at higher heating rate (15˚C/min) at the same final temperature (600˚C), more liquid (58.21% ± 1.17%) and gases (18.67% ± 0.58%) and less solid (23.12% ± 0.79%) were obtained. A maximum yield of liquid (63.20%) was obtained at 900˚C and 15˚C/min. At this condition 22.08% of solid and 14.72% of gases were obtained.
The gases formed during the experiment in the thermogravimetric balance were analyzed by GC and a composition of H2 (0.0236%), O2 (2.83%), N2 (97.5%), CH4 (0.0488%), CO (0.151%) and CO2 (0.300%) were quantified for a heating rate of 5˚C/min and a final temperature of 600˚C. O2 and N2 were used as combustion gas and as carrier gas from the plant to the GC, respectively.
The pyrolysis tests in the pilot plant were conducted for both sugarcane straw and sugarcane in natura, producing the bio-oils named BIOSS and BIOSC, respectively. The process temperature was maintained at 480˚C - 500˚C (T2, T3, T4) and the pressure at 50 - 80 mmH2O. During the reaction, around 18% of coal, 40% of bio-oil (1:1 of light oil:heavy oil) and 42% of gases, in wet basis, were produced for the sugarcane in natura. The calorific power of the heavy bio-oil was determined as 25.75 ± 0.6 MJ·kg−1 and of the light bio-oil as 10.05 ± 0.6 MJ·kg−1.
The coal obtained from the pyrolysis experiment was characterized and it presented 36.42% ± 0.23% of volatiles, 44.18% ± 0.11% of fixed carbon and 16.60% ± 0.03% of ashes. The ash in the coal is approximately 5- folds higher than in the sugarcane in natura. The calorific power of the coal was determined as 20.73 ± 0.7 MJ·kg−1.
It is important to measure the process energy expenses, and considering all the equipment that consumes electric energy, a total of 3.09 KWh is consumed per each operation cycle. The pilot plant energy balance is presented in Table 1, and the energy amount is calculated for both sides of Equation (3). For 1 h of reaction, 352 MJ was the input energy (left side) and 219 MJ was the output energy (right side), being 100, 39, 73 and 7.1 MJ the energy of the heavy bio oil, light bio oil, coal and gasses fraction, respectively. Part of the energy is consumed to maintain the pyrolysis reactor under autothermal condition, which means that the air used to fluidize the sand bed gets into combustion with part of the biomass, releasing energy to keep the reactor temperature at 480˚C - 500˚C. It was not estimated the amount of energy transfer to the surrounds during the pilot plant operation.
In order to determine the potential of the produced bio-oils as combustion fuels, their physicochemical properties were determined and are summarized in Table 2. In general, both samples presented very similar characteristics, as discussed below.
The presence of water diminishes the calorific power and ignition temperature of combustion fuels, but contributes to reduce the viscosity and to increase the fluidity of the oil [18]. The measured water content for BIOSS was of 5.3% and for BIOSC of 5.5%, lower values than those reported for bio-oils from different bio-massTable 1. Gas composition and parameters for estimating the energy of the gas flow.
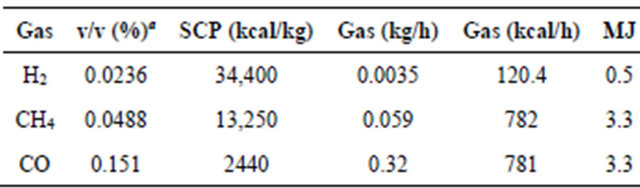
aGas volumetric composition determined by the thermogravimetric balance experiment at 600˚C at heating rate of 5˚C/min.
Table 2. Physicochemical properties of the bio-oils.
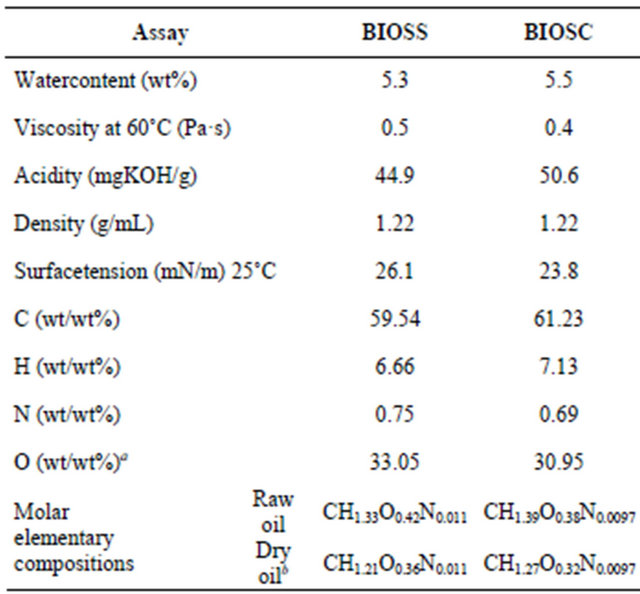
aOxygen (calculated from the difference between C, H and N contents). bCalculated after subtraction of the water content.
including sugarcane, which ranged from 15% to 30% [19]. As described in the literature, the water content is very dependent of the condensation process, fractions of bio-oils collected at different temperatures presented variable amounts of water, which increased at lower condensation temperatures [20]. In the present process, the condensation temperature was of 130˚C, which consequently lowered the water content of the oil.
Different temperatures and shear rates were tested to find the best conditions to measure the viscosity, i.e., at 60˚C with a shear rate of 5 s−1. BIOSS and BIOSC were not fluid enough to measure the viscosity at lower temperatures, but after a mild heating to 60˚C, it flowed, therefore, to use these bio-oils as fuels, a moderate preheating would be necessary to pump the viscous oil into the engines. The viscosity for BIOSS was 0.5 Pa·s and for BIOSC was 0.4 Pa·s, within the range reported for similar bio-oils (0.1 1.0 Pa·s) [11,17-19]. The viscosity of bio-oils varies in a large range, depending on the biomass precursor, on the pyrolytic processes and on the bio-oils properties such as water and solid particles contents, being also very dependent of the bio-oil recovery process. The density found for both bio-oils was 1.22 g·ml−1 at 25˚C, close to the values previously reported for similar bio-oils [13,19,21].
From the elemental analysis data it was possible to observe a higher carbon and hydrogen content in BIOSC (%C = 61.23; %H = 7.13) than in BIOSS (%C = 59.54; %H = 6.66), and consequently a lower oxygen content, 30.95% and 33.05%, respectively. This fits well with the larger fixed carbon content in the sugarcane in natura feedstock. The molar elementary compositions (Table 2) are in agreement with the reported data for other bio-oils, although the carbon and nitrogen contents are slightly higher and the oxygen content is bellow the reported average [19,22,23].
The surface tension was determined by the Wilhelmy plate method due to the high viscosity of the bio-oils at 25˚C. Relatively low values for surface tension were obtained for BIOSS and BIOSC, 26.1 mN·m−1 and 23.8 mN·m−1, respectively, which is an important feature of the fuel because it facilitates the formation of emulsion and its introduction into the fuel industry [24]. The acidity of the samples were determined by the method of total acidity index (TAI) and values of 44.9 mg KOH·g−1 and 50.6 mg KOH·g−1 were obtained for BIOSS and BIOSC, respectively. These values are relatively small due to the presence of weak carboxylic acids in the samples, and are in agreement with the literature (35.1 - 98.0 mg NaOH·g−1) [13,17].
From the X-ray fluorescence data it was possible to determine the presence of metallic elements in the biooils, as shown in Table 3. The main elements are Na, S, Cl and Fe. The elemental contents are very distinct between the two samples and in general the values are higher for BIOSS than for BIOSC. We can highlight the iron content, which is 807 ppm for BIOSS and only 27 ppm for BIOSC, and the potassium content that is 123 ppm for BIOSS and 1 ppm for BIOSC. These values are in agreement with those reported for other bio-oils from lignocellulosic biomass, which comprehends a large range of metal content [20]. The higher concentration of metals may have affected the pyrolysis, acting as catalyst and increasing the aromatic production, as observed in the FT-IR spectra (vide infra).
The GC-MS chromatograms of the two bio-oils (Figure 4) are quite similar in composition, differing slightly in the component contents. According to the mass spectra analysis it was possible to identify the major components of both samples as aromatic compounds and sugars, as summarized in Table 4. The aromatic components probably come from the lignine fragmentation, as suggested by the structural similarity with paracoumaryl, coniferyl and sinapyl alcohols, common monomeric unities of lignine. Free sugars and 5-hydroxymethyl-furfural from carbohydrates dehydration were also identified in high proportion.
Table 3. Metallic elements present in bio-oils.
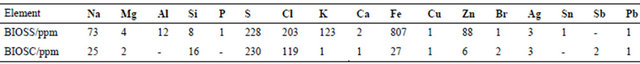
Table 4. GC-MS analyses for the bio-oils.
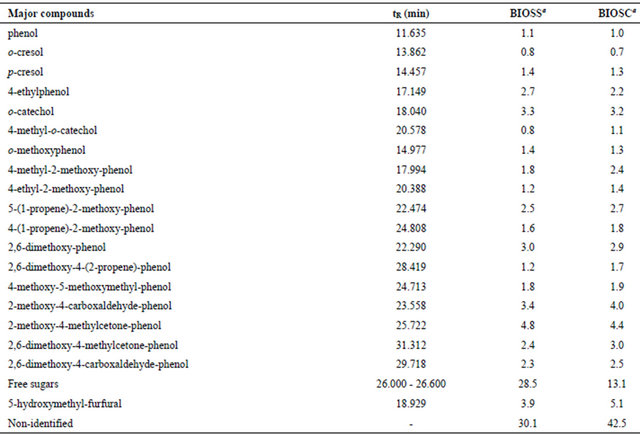
aRelative area percentage.
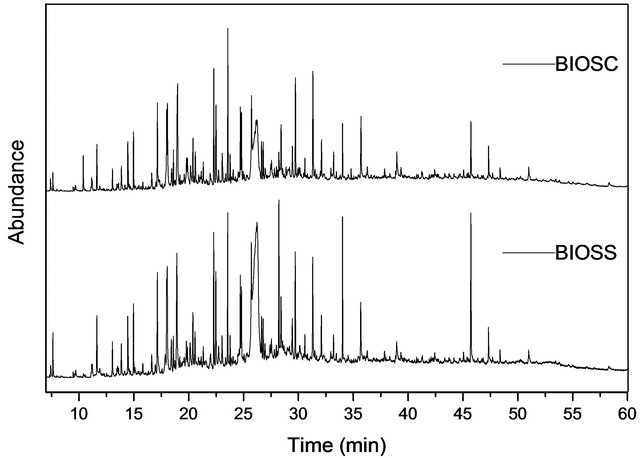
Figure 4. GC-MS chromatogram of BIOSS and BIOSC.
The FT-IR spectra of BIOSS and BIOSC (Figure 5) presented a very similar profile, with a broad band around 3382 cm−1 due to O-H stretching vibrations from the hydroxyl groups of the lignocellulosic derivatives and water molecules. Aliphatic C-H stretchings from -CH2 and -CH3 are observed at 3000 - 2800 cm−1. The band at 1709 cm−1 can be assigned to C=O groups possibly from carboxylic acids, esters, ketones and aldehydes. The bands at 1608, 1515 and 1463 cm−1 are characteristic of the C=C stretching mode of aromatic compounds. The bands in the region from 1300 to 1100 cm−1 can be assigned to C-O-C groups from ether linkages present specially in carbohydrates derivatives.
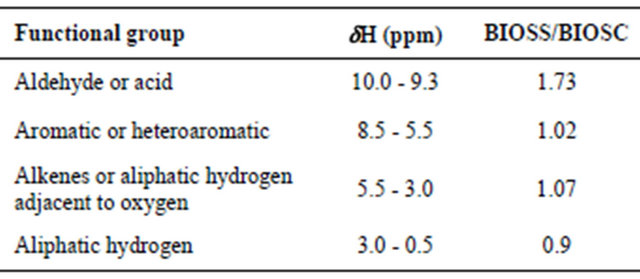
The 1H and 13C NMR spectra (Figures 6 and 7) also showed very similar profiles, with signals characteristic of aliphatic, aromatic and carbohydrate groups. In the 1H NMR spectra it was possible to identify four main regions, the first one from 0.5 to 3.0 ppm is characteristic of aliphatic hydrogen atoms in methylene and methyl groups. The region between 3 and 5 ppm can be assigned to the hydrogen atoms in the carbohydrates, i.e., C-H groups in proximity to oxygen atoms. The signals around 5.3 ppm can be assigned to the anomeric hydrogen from the carbohydrate skeleton. From 6 to 8 ppm it is possible to identify the aromatic or double bond hydrogens. The signals around 9.5 ppm can be attributed to aldehyde or carboxylic acid groups. Table 5 shows the integrated area for the four main regions in the 1H NMR spectra for both bio-oils as well as the ratio BIOSS/BIOSC for the respective integrals. Unlike the other regions, the aldehyde/acid proportion is different in the two samples, where a ratio BIOSS/BIOSC of 1.73 was obtained. This is in agreement with the larger oxygen content found for BIOSS in the elemental analysis data.
The 13C NMR spectra also show signals in different regions. From 180 to 150 ppm, the signals can be assigned to carbon from carbonyl compounds as ester and carboxylic acids and the signals from 150 ppm to 100 ppm can be attributed to aromatic or double bond carbons, specially from the lignin fragmentation products.
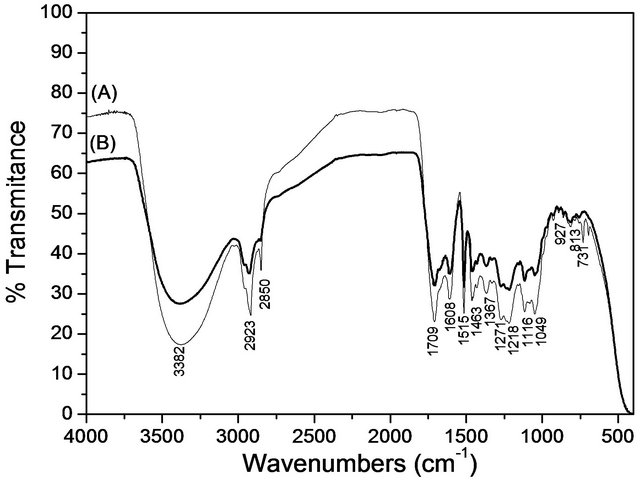
Figure 5. FTIR spectra of (A) BIOSS and (B) BIOSC.
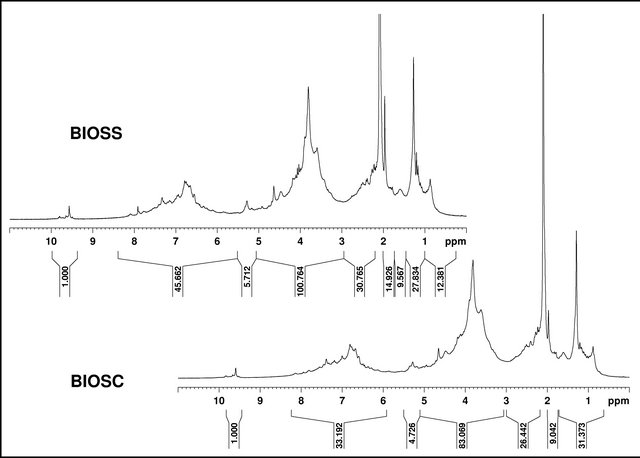
Figure 6. 1H NMR spectra of BIOSS and BIOSC (acetone-d6).
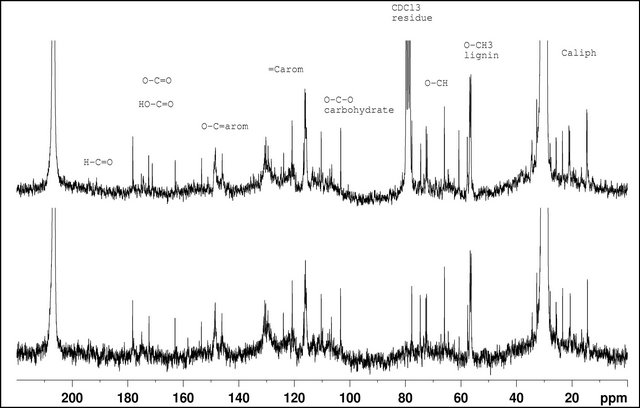
Figure 7. 13C NMR spectra of (A) BIOSS and (B) BIOSC (acetone-d6).
Table 5. Hydrogen integrals ratio of BIOSC/BIOSS in 1H NMR spectra.
The peaks between 110 and 100 ppm can be assigned to the anomeric carbons of carbohydrates. The region between 80 and 50 ppm can be assigned to aliphatic carbons bound to oxygen, characteristic of the carbohydrate derivatives. From 40 to 10 ppm the aliphatic carbons from -CH3 and -CH2 are present.
4. Conclusion
Two bio-oils, BIOSS and BIOSC, were obtained by fast pyrolysis in a pilot plant from sugarcane straw and sugarcane in natura. The measured physicochemical properties were quite similar for both samples, which points both biomass feedstocks as suitable for bio-oil production in terms of viscosity, surface tension, density and acidity. Furthermore, the bio-oil obtained from sugarcane in natura presented higher carbon and hydrogen content but a lower oxygen content. On the other hand, the metal content is higher in the bio-oil obtained from sugarcane straw, in special the iron and potassium contents were 807 ppm and 123 ppm against 27 ppm and 1 ppm in the bio-oil from sugarcane in natura. Aliphatic and aromatic compounds as well as carbohydrates scaffolds were identified as the main components of the bio-oils. GC-MS analyses showed aromatic products from lignine fragmentation and free sugars and sugar derivatives. Finally, thanks to the high unit flexibility concerning the different types of biomass suitable for the process, the bio-oil production in small farms can be largely improved, answering social, economics and environmental demands.
5. Acknowledgements
To Petrobras for financial support under contract 4600338530/ANPETRO14918
REFERENCES
- M. Oppenheimer, “Global Warming and the Stability of the West Antarctic Ice Sheet,” Nature, Vol. 393, No. 6683, 1998, pp. 325-332. doi:10.1038/30661
- C. Okkerse and H. van Bekkum, “From Fossil to Green,” Green Chemistry, Vol. 1, No. 2, 1999, pp. 107-114. doi:10.1039/a809539f
- G. W. Huber, S. Iborra and A. Corma, “Synthesis of Transportation Fuels from Biomass: Chemistry, Catalysts, and Engineering,” Chemical Reviews, Vol. 106, No. 9, 2006, pp. 4044-4098. doi:10.1021/cr068360d
- A. Corma, S. Iborra and A. Velty, “Chemical Routes for the Transformation of Biomass into Chemicals,” Chemical Reviews, Vol. 107, No. 6, 2007, pp. 2411-2502. doi:10.1021/cr050989d
- J. Zakzeski, P. C. A. Bruijnincx, A. L. Jongerius and B. M. Weckhuysen, “The Catalytic Valorization of Lignin for the Production of Renewable Chemicals,” Chemical Reviews, Vol. 110, No. 6, 2010, pp. 3552-3599. doi:10.1021/cr900354u
- D. Mohan, C. U. Pittman Jr. and P. H. Steele, “Pyrolysis of Wood/Biomass for Bio-Oil: A Critical Review,” Energy & Fuels, Vol. 20, No. 3, 2006, pp. 848-889. doi:10.1021/ef0502397
- A. Pandey, C. R. Soccol, P. Nigam and V. T. Soccol, “Biotechnological Potential of Agro-Industrial Residues. I: Sugarcane Bagasse,” Bioresource Technology, Vol. 74, No. 1, 2000, pp. 69-80. doi:10.1016/S0960-8524(99)00142-X
- J. Goldemberg, S. T. Coelho and P. Guardabassi, “The Sustainability of Ethanol Production from Sugarcane,” Energy Policy, Vol. 36, No. 6, 2008, pp. 2086-2097. doi:10.1016/j.enpol.2008.02.028
- J. A. Cunha, M. M. Pereira, L. M. M. Valente, P. R. de la Piscina, N. Homs and M. R. L. Santos, “Waste Biomass to Liquids: Low Temperature Conversion of Sugarcane Bagasse to Bio-Oil. The Effect of Combined Hydrolysis Treatments,” Biomass and Bioenergy, Vol. 35, No 5, 2011, pp. 2106-2116. doi:10.1016/j.biombioe.2011.02.019
- P. T. Williams and N. Nugranad, “Comparison of Products from the Pyrolysis and Catalytic Pyrolysis of Rice Husks,” Energy, Vol. 25, No. 6, 2000, pp. 493-513. doi:10.1016/S0360-5442(00)00009-8
- S. Zhang, Y. Yan, T. Li and Z. Ren, “Upgrading of Liquid Fuel from the Pyrolysis of Biomass,” Bioresource Technology, Vol. 96, No. 5, 2005, pp. 545-550. doi:10.1016/j.biortech.2004.06.015
- A. Oasmaa and S. Czernik, “Fuel Oil Quality of Biomass Pyrolysis Oils—State of the Art for the End User,” Energy & Fuels, Vol. 13, No. 4, 1999, pp. 914-921. doi:10.1021/ef980272b
- S. Czernik and A. V. Bridgwater, “Overview of Applications of Biomass Fast Pyrolysis Oil,” Energy & Fuels, Vol. 18, No. 2, 2004, pp. 590-598. doi:10.1021/ef034067u
- M. Garcìa-Pérez, A. Chaala and C. Roy, “Vacuum Pyrolysis of Sugarcane Bagasse,” Journal of Analytical and Applied Pyrolysis, Vol. 65, No. 2, 2002, pp. 111-136. doi:10.1016/S0165-2370(01)00184-X
- M. C. Samolada, W. Baldauf and I. A. Vasalos, “Production of a Bio-Gasoline by Upgrading Biomass Flash Pyrolysis Liquids via Hydrogen Processing and Catalytic Cracking,” Fuel, Vol. 77, No. 14, 1998, pp. 1667-1675. doi:10.1016/S0016-2361(98)00073-8
- T. P. Vispute, H. Zhang, A. Sanna, R. Xiao and G. W. Huber, “Renewable Chemical Commodity Feedstocks from Integrated Catalytic Processing of Pyrolysis Oils,” Science, Vol. 330, No. 6008, 2010, pp. 1222-1227. doi:10.1126/science.1194218
- G. Fogassy, N. Thegarid, Y. Schuurman and C. Mirodatos, “From Biomass to Bio-Gasoline by FCC Co-Processing: Effect of Feed Composition and Catalyst Structure on Product Quality,” Energy & Environmental Science, Vol. 4, No. 12, 2011, pp. 5068-5076. doi:10.1039/c1ee02012a
- D. S. Scott, P. Majerski, J. Piskorz and D. Radlein, “A Second Look at Fast Pyrolysis of Biomass—The RTI Process,” Journal of Analytical and Applied Pyrolysis, Vol. 51, No. 1-2, 1999, pp. 23-37. doi:10.1016/S0165-2370(99)00006-6
- Q. Zhang, J. Chang, T. J. Wang and Y. Xu, “Review of Biomass Pyrolysis Oil Properties and Upgrading Research,” Energy Conversion and Management, Vol. 48, No. 1, 2007, pp. 87-92. doi:10.1016/j.enconman.2006.05.010
- J. Lédé, F. Broust, F. T. Ndiaye and M. Ferrer, “Properties of Bio-Oils Produced by Biomass Fast Pyrolysis in a Cyclone Reactor,” Fuel, Vol. 86, No. 12-13, 2007, pp. 1800-1810. doi:10.1016/j.fuel.2006.12.024
- M. Garcìa-Pérez, A. Chaala, H. Pakdel, D. Kretschmer and C. Roy, “Vacuum Pyrolysis of Softwood and Hardwood Biomass: Comparison between Product Yields and Bio-Oil Properties,” Journal of Analytical and Applied Pyrolysis, Vol. 78, No. 1, 2007, pp. 104-116. doi:10.1016/j.jaap.2006.05.003
- C. J. Durán-Valle, M. Gómez-Corzo, J. Pastor-Villegas and V. Gómez-Serrano, “Study of Cherry Stones as Raw Material in Preparation of Carbonaceous Adsorbents,” Journal of Analytical and Applied Pyrolysis, Vol. 73, No. 1, 2005, pp. 59-67. doi:10.1016/j.jaap.2004.10.004
- A. V. Bridgwater, “Renewable Fuels and Chemicals by Thermal Processing of Biomass,” Chemical Engineering Journal, Vol. 91, No. 2-3, 2003, pp. 87-102. doi:10.1016/S1385-8947(02)00142-0
- M. Ikura, M. Stanciulescu and E. Hogan, “Emulsification of Pyrolysis Derived Bio-Oil in Diesel Fuel,” Biomass & Bioenergy, Vol. 24, No. 3, 2003, pp. 221-232. doi:10.1016/S0961-9534(02)00131-9
NOTES
*Corresponding author.