Journal of Data Analysis and Information Processing
Vol.07 No.03(2019), Article ID:93894,10 pages
10.4236/jdaip.2019.73007
Time Series Analysis of Energy Intensity, Value Added Tax and Corporate Income Tax: A Case Study of the Non-Ferrous Metal Industry, Jiangxi Province, China
Wenrong Pan1*, Dejian Lai2, Yu Song1, Jack Follis3
1School of Statistics, Jiangxi University of Finance and Economics, Nanchang, China
2Division of Biostatistics and Data Science, School of Public Health, The University of Texas Health Science Center at Houston, Houston, USA
3Department of Mathematics, Computer Science, and Cooperative Engineering, University of St. Thomas, Houston, USA

Copyright © 2019 by author(s) and Scientific Research Publishing Inc.
This work is licensed under the Creative Commons Attribution International License (CC BY 4.0).
http://creativecommons.org/licenses/by/4.0/


Received: May 9, 2019; Accepted: July 23, 2019; Published: July 26, 2019
ABSTRACT
Unprecedented industrialization and urbanization have led to China’s poor energy efficiency. In response, the Chinese government has set goals to reduce energy consumption that may include implementing new tax policies. In this paper, we investigate the relationship between energy intensity, an indicator that measures the efficiency of energy consumption, and two sources of government revenue in China (i.e., value-added tax (VAT) and corporate income tax). As a case study, we developed a Granger co-integration model to analyze the dynamic relationship of energy intensity, VAT and corporate income tax in the non-ferrous metal industry, Jiangxi Province, China, between 1996 and 2010. Augmented Dickey-Fuller tests were used to validate the model. In our time series analyses, we found when controlling for corporate income tax, a one log unit increase of VAT resulted in a decrease of 1.17 log units of energy intensity. However, when controlling for VAT, a one log unit increase of corporate income tax resulted in an increase of 0.34 log units of energy intensity. Understanding the relationship between energy intensity and taxation in industries that consume high volumes of energy can greatly enhance China’s goal to reduce energy consumption. We believe our findings add to this on-going discussion.
Keywords:
China Taxation, Co-Integration Models, Energy Consumption, Granger Causality Test, Time Series Analysis

1. Introduction
China has experienced rapid industrialization and urbanization in the last two decades and much of the progress was driven by the manufacture and exporting of consumer goods. A direct result of this unprecedented progress is an increase in energy consumption. Between 1994 and 2010, over 70% of China’s energy consumption was attributed to secondary industries [1] . One of the largest by-products of this proliferation in energy consumption is the increase in atmospheric air pollution and the deleterious health effects associated with air emissions [2] . Presently, China is the largest emitter of CO2 in the world [3] . Furthermore, if the Chinese energy consumption annual rate of 8.9% continues, by 2020, China’s total energy consumption will reach 8 billion tonnages of standard coal, thus accounting for nearly half of the globe’s energy consumption [4] .
Tax revenues and the tax mix in China differ from many of the world’s most advanced countries who are members of the Organization for Economic Co-operation and Development (OECD), an organization comprised of 34 member countries covering the globe from North America, South American, Europe and Asia-Pacific [5] . In 2010, China’s tax-to-Gross Domestic Product (GDP) ratio of 21.9% (Yearbook of China Taxation, 2009-2012) was lower as compared to a 34% average across OECD countries. China’s strong economic growth and the relatively high inflation rate have led to a strong increase in tax revenue resulting in a nominal growth in GDP of over 17% in 2010 and 2011. The growth in GDP is a reflection of China’s tax reform (e.g., 2008 corporate tax reform) which includes improved tax collection and changes in the shares of agricultural, service, industrial, and construction industries in GDP [5] .
Unlike OECD countries where, on average, 60% of their revenues come from direct taxes, China raises 38% from direct taxes. Employer and employee social security contributions and payroll taxes account for 28% of tax revenue in OECD countries but less than 17% in China. Personal income tax in OECD countries contributes approximately 25% of tax revenues but is substantially lower in China at less than 6%. However, corporate income tax revenues in China are significantly higher at more than 15% compared to 8% in OECD countries. China’s strengthened tax administration is attributed to the value added tax (VAT), a consumption tax levied on the supply of goods, and the corporate income tax. China’s 17% VAT is lower than the average VAT in OECD countries. The VAT is collected by the State Tax Bureau and allocates 75% to the central government and 25% to sub-central governments (i.e., local governments) [5] .
Jiangxi Province located in southeast China covers 166,600 square kilometers and has a population of over 44 million (Jiangxi Provincial Statistical Bureau, 2012) [6] [7] [8] . Once a traditionally agricultural province, Jiangxi Province boasts rich deposits of non-ferrous metals due to its geological properties and location in the center of the western Pacific mineral zone [7] [8] . Jiangxi Province ranks first in copper, accounting for nearly 20% of total copper resources and ranks second in tungsten accounting for roughly18% of total tungsten resources in China. In recent decades, the non-ferrous metal industry has grown rapidly in Jiangxi Province and accounted for 18% of the total industrious output of Jiangxi Province in 2010. In China, the non-ferrous metal industry accounts for 4% of the country’s total industrial GDP [9] .
To investigate the interplay between taxation and energy consumption, we conducted a case-study to examine the relationship between energy intensity, an indicator that measures the efficiency of energy consumption, and two sources of tax revenue in China (i.e., VAT and corporate income tax). To do so, we established statistical time series models based on Engel and Granger’s co-integration theory [10] and conducted Granger causality testing. Augmented Dickey-Fuller tests were used to validate the models.
2. Materials and Methods
A commonly used indicator of energy consumption is energy intensity. In China, energy intensity is measured as the tonnage of standard coal per 10 thousand yuan GDP produced. Data for value added tax (VAT), corporate income tax and energy intensity were collected from 1996 to 2010 for Jiangxi Province (Jiangxi Provincial Statistical Bureau, 1997-2011; Yearbook of China Taxation, 2009-2012) (see Table 1 and Table 2) [8] [11] . Due to high inflation during this period, both current price and fixed price were used for our statistical analysis. Data were log-transformed before modeling to stabilize the variability.

Table 1. Energy intensity, value added tax (VAT) and corporate income tax in current price.
aTonnage of standard coal per 10,000 yuan GDP; b100 Million.
Table 2. Energy intensity, value added tax (VAT) and corporate income tax in fixed price.
aTonnage of standard coal per 10,000 yuan GDP; b100 Million.
Many classical time series models such as Box-Jenkins’ ARMA (p, q) model require stationary time series for valid statistical inference [12] . The ARMA (p, q) model is defined as
(1)
where is a stationary time series and the are independent and identically normally distributed innovations. In the case that there is any doubt about normality assumption, an appropriate goodness of fit test should be done. See Zamanzade and Mahdizadeh (2016) [13] , Zamanzade and Mahdizadeh (2017a, 2017b) [14] [15] , Mahdizadeh and Zamanzade (2017) [16] , and Mahdizadeh and Zamanzade (2019) [17] for more discussion on this topic.
To extend the model to non-stationary time series, ARMA (p, q) can be extended to ARIMA (p, d, q) with ARMA (p, q) modeling on the dth difference of [18] . The model can also be extended to non-integer order of differences [19] . In the ARIMA models defined above, only univariate time series are considered. However, in many fields, the observed phenomena may be derived from many dynamic factors. It is likely that these time series may express trends and non-stationarity. For multivariate, non-stationary time series commonly observed in econometric studies, Engle and Granger [10] proposed co-integration models. Using our three time series, a simple co-integration model in log scale is defined as
(2)
In expression (2), Ent is the energy intensity, Vt is VAT and Ct is corporate income tax. In the above model, these three time series can be non-stationary, but the linear relationship (co-integration) would make the innovations, , independent and identically distributed as in an ARIMA (p, q) model. The co-integration model in (2) extends the classic Box-Jenkins model that is based on historical data of stationary univariate time series to multivariate non-stationary time series.
In our analysis, to estimate the parameters , and in model (2), ordinary least squares (OLS) was used via the “lm” function in R statistical software. During our study period, China experienced high inflation; thus, we established model (2) for our time series of energy intensity, VAT and corporate income tax derived from current price and fixed price for the non-ferrous metal industry in Jiangxi Province, China.
To validate the model, we performed the Augmented Dickey-Fuller (ADF) test [20] on the residuals of the model. The ADF tests were conducted using “ur.df” in the R statistical software package “urca”. We also conducted Granger causality tests [10] to measure the effect of VAT and corporate income tax on energy intensity, as well as, the effect of energy intensity on VAT and corporate income tax. We modified and used the Granger causality test function in R [20] . All statistical analyses were carried out using R [21] and the results were replicated by Eviews [22] .
3. Results and Discussion
The plots of energy intensity, VAT, and corporate income tax indicated that the measurements were all from non-stationary processes in the original scale and the log-scale for both current price and fixed price. It is also evident that trends of these time series were more stable in the log-scale (Figures 1-3). The plots of the energy intensity time series are shown in Figure 1 where Figure 1(a) plots the time series of energy intensity in the original scale with current price and fixed price and Figure 1(b) is in log-scale. The time series for VAT and corporate income tax are shown in Figure 2 and Figure 3, respectively.
The estimates of , and in model (2) are 1.92, −1.17 and 0.34, respectively, based on current price and 2.21, −1.14 and 0.33, respectively, based on fixed price. All estimates of the coefficients were statistically different from zero (P ≤ 0.05 for all coefficients). Thus when controlling for corporate income tax, energy intensity would decrease by 1.17 log units for a one log unit increase in VAT. That is, as VAT increased by 271.83 million yuan, energy intensity would decrease by 0.3180 ton of standard coal per thousand GDP yuan (1.17 × 2.7183 ton of standard coal per 10 thousand GDP yuan). Similarly, when controlling for VAT, a one log unit increase of corporate income tax is associated with a 0.34 log unit increase of energy intensity. These results were approximately the same based on current price or fixed price.
To assess the goodness-of-fit of the co-integration model (2), we performed the
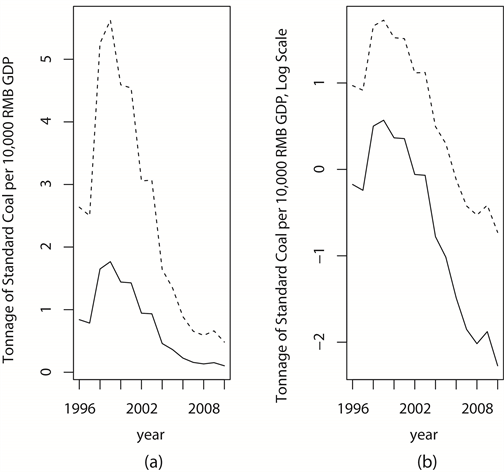
Figure 1. Time series plots of energy intensity (tonnage of standard coal per 10,000 yuan GDP) in original scale (a) and log-scale (b), 1996-2010. Solid line—fixed price; dashed line—current price.
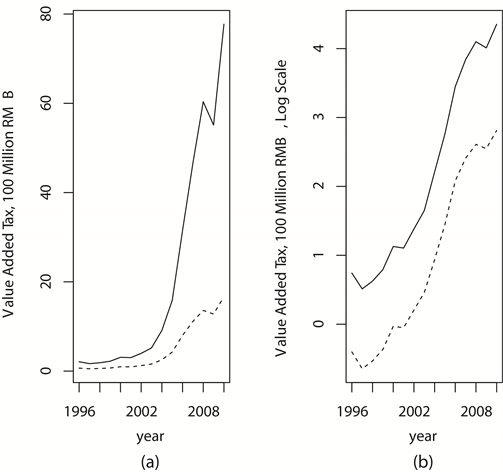
Figure 2. Time series plots of value added tax (VAT) in original scale (a) and log-scale (b), 1996-2010. Solid line—fixed price; dashed line—current price.
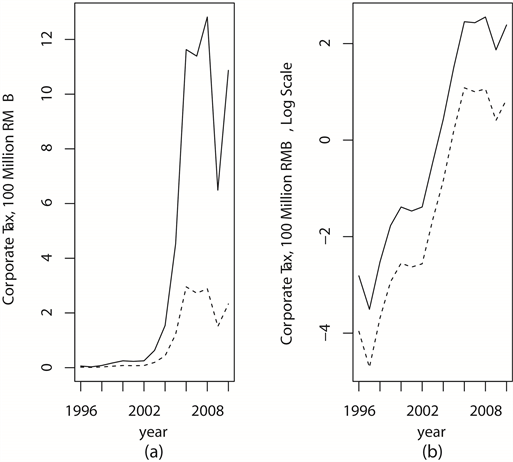
Figure 3. Time series plots of corporate income tax in original scale (a) and log scale (b), 1996-2010. Solid line—fixed price; dashed line—current price.
ADF test on the residuals for both co-integration models of the log-transformed time series derived from current price and fixed price. The test statistics were −2.7484 and −2.7400, respectively. We rejected the null hypothesis that there was a unit root for both residuals at a significance level of P ≤ 0.01 and the plots of the residuals indicated that they did not significantly deviate from white noise (Lai 2008, plots not shown). Therefore, the co-integration models reasonably described the relationship between energy intensity, VAT and corporate income tax.
To formally examine the causality of VAT and corporate income tax on energy intensity, we used Granger causality testing. We established co-integration models of energy intensity based on historic data (one lag) and VAT based on current price and fixed price (similarly for corporate income tax) (see Table 3). The results from the co-integration models and the Granger causality tests indicated that VAT had a significant negative Granger causality on energy intensity when controlling for corporate income tax; whereas corporate income tax had a significant positive Granger causality on energy intensity when controlling for VAT. Value added tax and corporate income tax had a stronger linear co-integration association with energy intensity when compared to historic observations of energy intensity. Furthermore, the relationship remained after adjusting for inflation.
In contrast, energy intensity appeared to have no significant Granger causality on VAT and corporate income tax. We conducted these tests assuming the time
Table 3. Granger causality testing of current price and fixed price.
Ln, natural log; V, value added tax (VAT); C, corporate income tax; En, Energy intensity.
series were stationary. Based on our findings from Figures 1-3 we also conducted Granger causality tests on the first difference of the log-transformed time series derived from current price and fixed price. Consequently, the Granger causality disappeared at a significance level of P ≤ 0.05 (results not shown).
In our study, we applied a co-integration model to establish the linear relationship of energy intensity, VAT and corporate income tax for the non-ferrous metal industry in Jiangxi Province, China. Our results revealed that energy intensity was negatively associated with VAT and positively associated with corporate income tax while controlling for each respectively. However, our study is not without limitations and may be underpowered due to the small sample size and the transformation of the data. Our rejection of the null hypothesis of a unit root of the residuals from our models of current and fixed price is not surprising due to the relatively small number of observations. Unfortunately, we did not have enough years of data to conduct a longer time series using both current and fixed price to achieve higher power. In estimating our models, we followed the traditional method of log-transforming the time series to stabilize the variance. Although, a more general approach using Box-Cox transformation is equally as valid [12] .
In assessing the Granger causality of VAT and corporate income tax on energy intensity, our results showed that the Granger causality of both the VAT and corporate income tax were statistically significant for both current price and fixed price; yet, VAT had a negative effect on energy intensity while corporate income tax had a positive effect on energy intensity. It is possible that the significance of the Granger causality for VAT and corporate income tax on energy intensity might have resulted from the non-stationarity of these three time series. When the tests were conducted on the differences of these time series, we did not observe statistically significant results.
4. Conclusions
Over the next 40 years, China will continue to experience rapid urbanization and industrialization. In an effort to address energy consumption, China’s State Council had a goal of a 16% reduction in energy intensity over five years and promotes control of energy intensity and total energy consumption as the primary goal of the 12th FYP for Energy Development [1] . One component for reaching such a goal would be through implementing macro-adjustment policies (e.g., fiscal, industrial, and investment policies) at the appropriate levels of government. Because taxes affect macroeconomic stability, further strengthening the tax regime may be a necessary factor in China’s efforts to achieve its energy consumption reduction goal.
This case study of taxation in the non-ferrous metal industry adds to the growing literature investigating means to address energy consumption and energy efficiency in China. Our findings suggest that local governments, who can adjust rates for various categories, should consider maintaining or increasing VAT as this decreases energy intensity in the non-ferrous metals industry. However, increasing corporate income tax may be deleterious and reducing corporate income tax may become a necessary factor to decrease energy intensity and energy consumption. Understanding the relationship between tax revenues and energy intensity is just one more tool China can use on its objective to meet its energy consumption control target.
Conflicts of Interest
The authors declare no conflicts of interest regarding the publication of this paper.
Cite this paper
Pan, W.R., Lai, D.J., Song, Y. and Follis, J. (2019) Time Series Analysis of Energy Intensity, Value Added Tax and Corporate Income Tax: A Case Study of the Non-Ferrous Metal Industry, Jiangxi Province, China. Journal of Data Analysis and Information Processing, 7, 108-117. https://doi.org/10.4236/jdaip.2019.73007
References
- 1. Yuan, J., Xu, Y., Zhao, C., Xiong, M. and Guo, J. (2014) Peak Energy Consumption and CO2 Emissions in China. Energy Policy, 68, 508-523. https://doi.org/10.1016/j.enpol.2014.01.019
- 2. Chen, Z., Wang, J.N., Ma, G.X. and Zhang, Y.S. (2013) China Tackles the Health Effects of Air Pollution. The Lancet, 382, 1959-1960. https://doi.org/10.1016/S0140-6736(13)62064-4
- 3. Wang, H., Zhang, Y., Lu, X., Nielsen, C. and Bi, J. (2015) Understanding China’s Carbon Dioxide Emissions from Both Production and Consumption Perspectives. Renewable & Sustainable Energy Reviews, 52, 189-200. https://doi.org/10.1016/j.rser.2015.07.089
- 4. Cao, X. (2011) New Energy Policy of China. Review of Economic Research, No. 52, 2-30.
- 5. Brys, B., Matthews, S., Herd, R. and Wang, X. (2013) Tax Policy and Tax Reform in the People’s Republic of China. OECD Taxation Working Papers No. 18, OECD Publishing, Paris.
- 6. Jiangxi Provincial Statistical Bureau (1997-2011) Year Book of Jiangxi Statistics 1997-2011. Nanchang.
- 7. Zhou, S.H. (1992) China Provincial Geography. Foreign Languages Press, Beijing.
- 8. Jiangxi Provincial Statistical Bureau (2012) Year Book of Jiangxi Statistics 2012. Nanchang.
- 9. Ye, Z.H., Yi, G.S. and Zou, X.M. (2012) The Sustainable Development of Mining Industry in Jiangxi Province. Bulletin of the Donghua University of Science and Technology (Social Science Edition), 2, 109-112.
- 10. Engle, R. and Granger, C.W.J. (1987) Co-Integration and Error Correction: Representation, Estimation and Testing. Econometrics, 55, 251-276. https://doi.org/10.2307/1913236
- 11. China State Administration of Taxation (2009-2012) Year Book of China Taxation, 2008-2011. Beijing.
- 12. Box, G.E.P., Jenkins, G.M. and Reinsel, G.C. (2008) Time Series Analysis: Forecasting and Control. 4th Edition, Wiley, New York. https://doi.org/10.1002/9781118619193
- 13. Zamanzade, E. and Mahdizadeh, M. (2016) Entropy Estimation from Judgment Post Stratified Data. Pakistan Journal of Statistics and Operation Research, 7, 625-637. https://doi.org/10.18187/pjsor.v12i4.1372
- 14. Zamanzade, E. and Mahdizadeh, M. (2017) Entropy Estimation from Ranked Set Samples with Application to Test of T. Revista Colombiana de Estadstica, 40, 223-241. https://doi.org/10.15446/rce.v40n2.58944
- 15. Zamanzade, E. and Mahdizadeh, M. (2017) Goodness of Fit Tests for Rayleigh Distribution Based on Phi-Divergence. Revista Colombiana de Estadstica, 40, 279-290. https://doi.org/10.15446/rce.v40n2.60375
- 16. Mahdizadeh, M. and Zamanzade, E. (2017) New Goodness of Fit Tests for Cauchy Distribution. Journal of Applied Statistics, 44, 1106-1121. https://doi.org/10.1080/02664763.2016.1193726
- 17. Mahdizadeh, M. and Zamanzade, E. (2019) Goodness-of-Fit Testing for the Cauchy Distribution with Application to Financial Modeling. Journal of King Saud University—Science. https://doi.org/10.1016/j.jksus.2019.01.015
- 18. Lai, D. (2008) White Noise. In: International Encyclopedia of the Social Sciences, 2nd Edition, Macmillan, London, Vol. 9, 82-83.
- 19. Hosking, J.R.M. (1981) Fractional Differencing. Biometrika, 68, 165-176. https://doi.org/10.1093/biomet/68.1.165
- 20. Tsay, R.S. (2005) Analysis of Financial Time Series. 2nd Edition, Wiley, New York. https://doi.org/10.1002/0471746193
- 21. Free Software Foundation (2013) R Project. R 3.0.1. http://www.r-project.org
- 22. IHS Global (2013) Eviews 8, Irvine, CA.