Journal of Data Analysis and Information Processing
Vol.03 No.03(2015), Article ID:58384,8 pages
10.4236/jdaip.2015.33005
Improving the OCR of Low Contrast, Small Fonts, Dark Background Forms Using Correlated Zoom and Resolution Technique (CZRT)
Mahmoud Zaki Iskandarani
Faculty of Science and Information Technology, Al-Zaytoonah University of Jordan, Amman, Jordan
Email: m.iskandarani@hotmail.com
Copyright © 2015 by author and Scientific Research Publishing Inc.
This work is licensed under the Creative Commons Attribution International License (CC BY).
http://creativecommons.org/licenses/by/4.0/


Received 15 June 2015; accepted 25 July 2015; published 28 July 2015
ABSTRACT
Many formal institutions, companies, hospitals, laboratories need some time to exchange hand signed reports through modern communication means such as Fax, E-mails, and others. A problem is faced due to the quality of both scanned documents and originally used paper, which results in problems in converting such images to text. In addition, font type and size, contrast and back- ground darkness have an adverse effect on the accuracy of the resulted text. Thus, an investigation into the relationship between scanned document zoom and scanning resolution in Dots per Inch (DPI) for a special case and type of scanned forms is carried out to enable design of an algorithm that takes into account such cases. It is found that a much higher level of zooming and resolution is needed to achieve acceptable recognition for the special case of dark, low contrast, small font forms. It is also found that the optimum zooming level is set by the number of recognized words as they are more difficult to learn and analyze.
Keywords:
OCR, Zoom, Scanning, Forms Recognition, Data Mining

1. Introduction
The goal of Optical Character Recognition (OCR) is to classify optical patterns (often contained in a digital image) corresponding to alphanumeric or other characters. The process of OCR involves several steps including segmentation, feature extraction, and classification. Some applications of OCR range from people wish to scan in a document and have the text of that document available in a word processor, to recognition of license plate numbers and zip codes [1] -[5] .
The best OCR process is achieved when the following conditions are met:
1) A clean printed copy.
2) A scanned document where little or no tilts occurred to the horizontal lines.
3) A scanned document which is free of smearing marks and blurring.
4) A document whose characters are distinguishable with distinct edges.
5) A document without underlined characters especially the letters g, j, p, q and y.
6) A document with no handwritten notes.
7) A document with no colored text, dark backgrounds.
The most common use for OCR is to convert text documents to some sort of digital representation.
OCR can reach 98% accuracy. However, accuracy will decrease dependant on the quality of the scanned documents and the type of algorithm used to interpret the resulting scanned files. The quality of scanned docu- ment can be measured by a term called DPI (Dots per Inch). Usually, 300 DPI is the standard quality, since with such resolution it is possible to reach good most accuracy without sacrificing speed and file size [6] -[10] .
In this paper, an approach is made towards relating and explaining the effect of dark, low contrast, small font forms on the level of resolution and zoom required to obtain acceptable results. In addition, the realization that a higher Zoom and Resolution values are required per fixed contrast to obtain satisfactory results for such forms, will be presented and proved. An attempt is made to quantify such approach in order to enable an intelligent selection of Resolution and Zooming levels as per type of scanned documents.
2. Methodology
A low contrast, dark, small font form is used to establish the best scanning parameters for such a special case. The form is scanned at various zooming levels per resolution levels. The two used matrices are:
1) Zooming Matrix: [100. 120. 140. 160. 180].
2) Resolution Matrix: [100, 200, 300, 400, 500, 600, 700, 800, 900, 1000].
The used algorithm is designed to find an intersection whereby a maximum recognition rate value or values are obtained for both words and numbers. The final correlated value for zoom as a function of resolution values is selected for the type and properties of the scanned form and feedback into a knowledge base. The experiment is repeated for other types and variations of forms to enrich the KB and have a proper automatic system that switches in-between parameters to obtain optimum recognition rate.
The used algorithm will implement the following expressions:
 (1)
(1)
 (2)
(2)
 (3)
(3)

Equations (1) and (2) represent words and numbers recognition over the domains of resolution and zoom for all intervals and values of contrast faced in practical cases. Here, the algorithm will cycle through combinations of both R and Z arrays and log the values of correctly recognized word and number counts into the Knowledge Base (KB) as part of the learning curve of the system. Equation (3) applies a correlation function to establish the optimum cross correlation between both Z and R values for the case under consideration. The knowledge Base will use the expression in (3) to test various combinations of the stated parameters and form a learning curve such that it auto adjust its scanning values to obtain the best or optimum recognition.
3. Results
A real case of formal, dark background, low contrast forms exchanged as images through scanned e-mails and fax machines are collected and re-scanned again at various levels of resolution and zoom values. The resulting scanned files are then interfaced to the recognition and interpreting algorithm with learning capabilities. The resulting recognized files are then produced as text documents with statistical analysis regarding the correctly recognized numbers and words versus resolution and zooming levels.
Figures 1-5 show recognition curves for both words and numbers as a function of both resolution and zooming parameters. These values are displayed in Table 1 and Table 2.
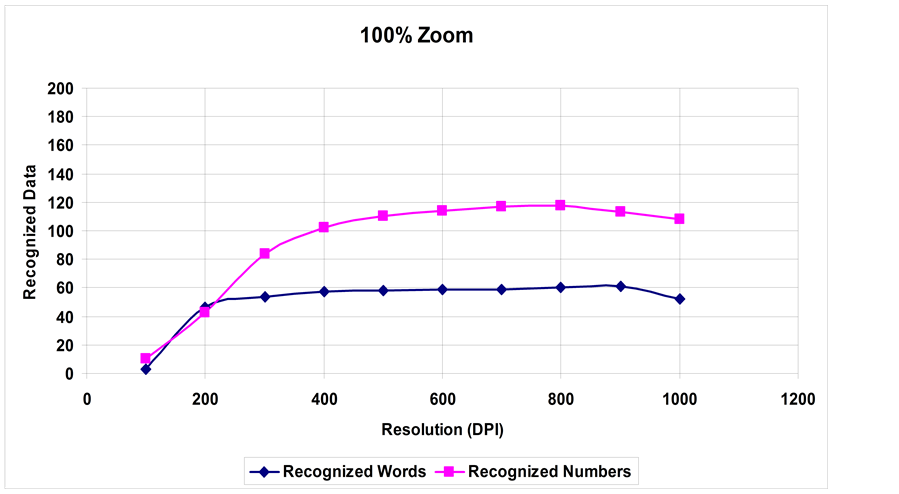
Figure 1. Recognition of words and numbers at 100% Zoom.
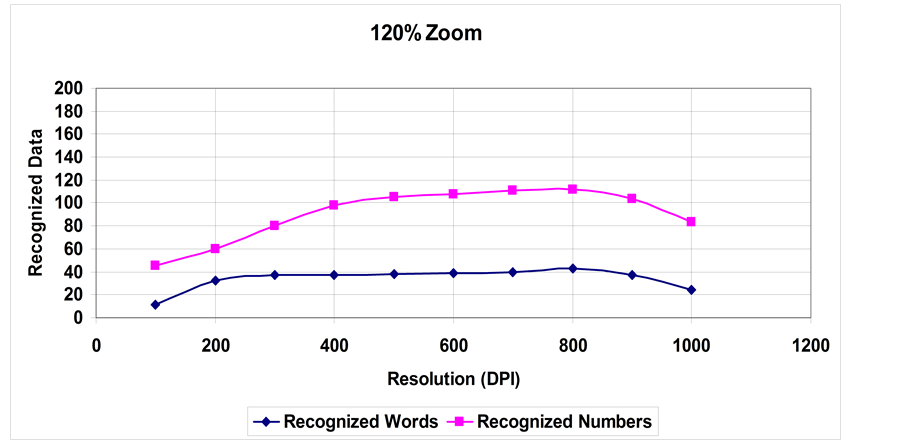
Figure 2. Recognition of words and numbers at 120% Zoom.
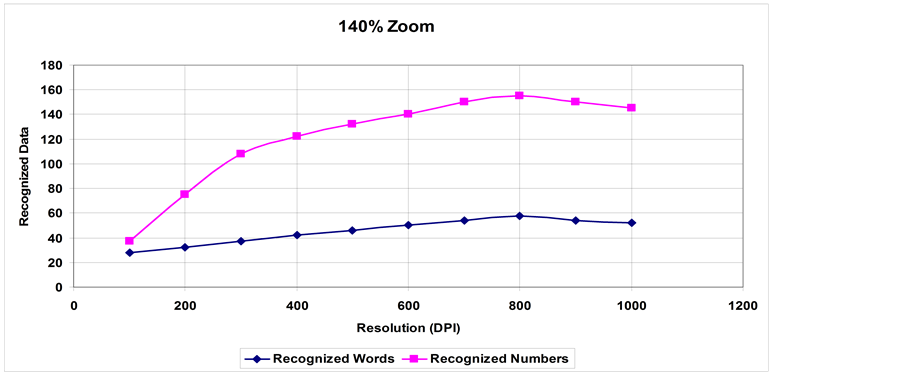
Figure 3. Recognition of words and numbers at 140% Zoom.
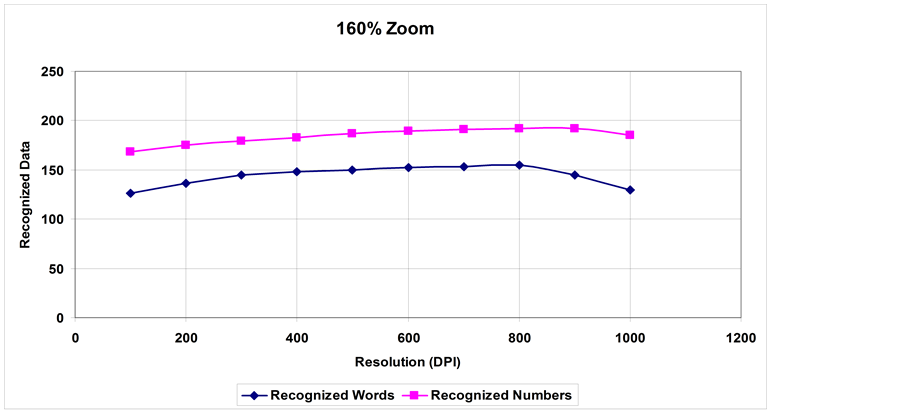
Figure 4. Recognition of words and numbers at 160% Zoom.
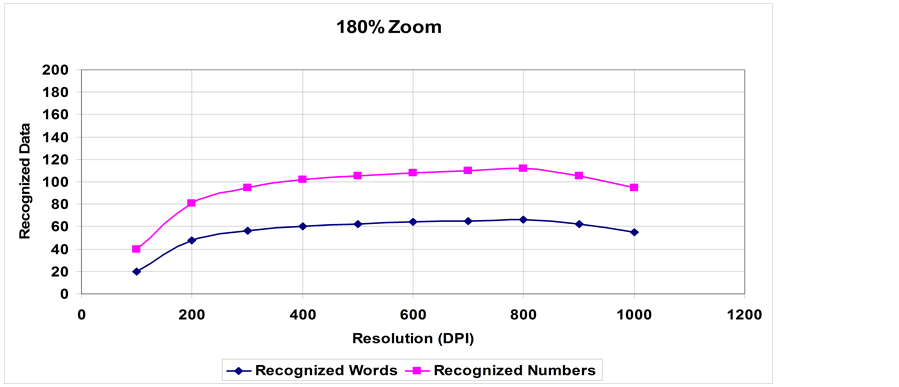
Figure 5. Recognition of words and numbers at 180% Zoom.

Table 1. Recognized words as a function of resolution and zoom.
Table 2. Recognized numbers as a function of resolution and zoom.
4. Discussion
From Figures 1-5 and Table 1 and Table 2, the following is deduced:
1) A steady increase in the recognition rate for words up to a certain value of zooming and resolution, where the recognition rate decreases due to blurring in the case of the zoom parameter and line thickening in the case of resolution.
2) Numbers recognition rate is higher than words recognition rate per same parameters. This is expected as learning printed numbers is much easier than the letter and word variations.
Table 3 and Table 4 show percentage recognition of both words and numbers in relation to resolution and zoom parameters. From the tables, it is obvious that numbers have higher percentages of recognition per zoom value compared to words, hence higher recognition rate at smaller zooming [11] -[13] .
Figure 6 and Figure 7 show the dominance of zooming level at 160% compared to other levels of zooming used in the experimental work. It actually divides the plane into two main sub-planes:
1) Plane 1: Contains recognition rates for zoom values [100%, 120, 140%, 180%].
2) Plane 2: Contains recognition rates for zoom value [160%].
However, it could be seen that the spread of Plane 1 is more in the case of numbers compared to words, as numbers are easier to be recognized.
Based on the results in Figure 6 and Figure 7, Table 5 and Table 6 show the results of applying an acceptable threshold value of 80% recognition to both words and numbers. From the tables, it is clear that both words
Table 3. Recognition rate for words as a function of resolution and zoom.
Table 4. Recognition rate for numbers as a function of resolution and zoom.
Table 5. Recognition rate for words as a function of resolution and zoom at 80% threshold.
Table 6. Recognition rate for numbers as a function of resolution and zoom at 80% threshold.
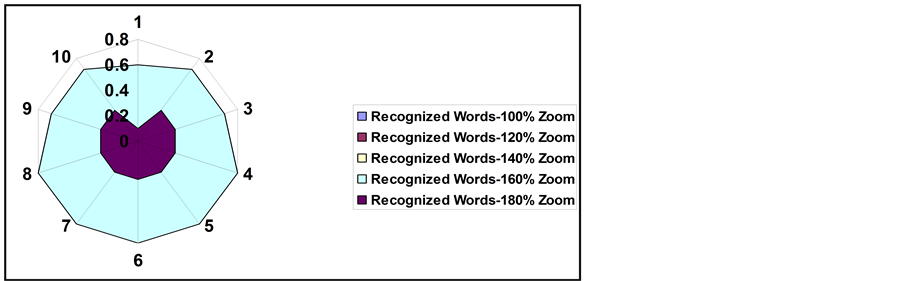
Figure 6. Recognition of words at 160% Zoom.
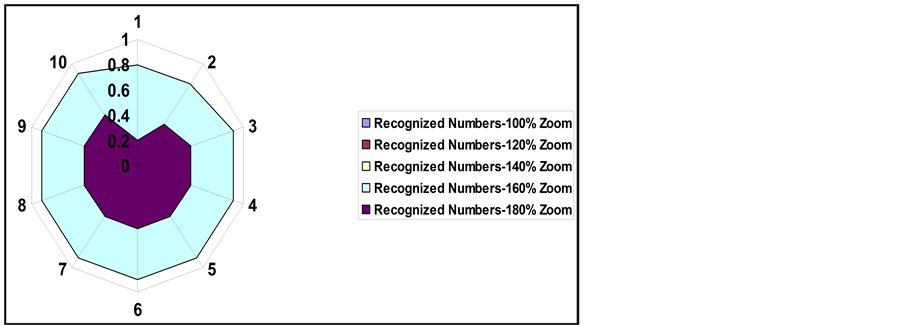
Figure 7. Recognition of numbers at 160% Zoom.
and numbers have a mutual highest recognition rate at 160% Zoom. Since numbers are easier to learn and be recognized it has a high rate at all tested DPI values. However, for words, the range of DPI values is narrower, due to small fonts and complexity in letter and word learning, especially with dark, low contrast formal paper with horizontal and vertical lines. So, we have two arrays of DPI at 160% zoom:
1) Words: [400, 500, 600, 700, 800].
2) Numbers: [100, 200, 300, 400, 500, 600, 700, 800, 900, 1000].
To establish a common working criteria for both words and numbers, as usually any document will have a mix of both types, correlation is carried out between the contents of Table 5 and Table 6, resulting in the operating parameters for this special condition of Dark, Low contrast, Small font, formal forms being:
1) Zoom: [160%].
2) Resolution (DPI): [400, 500, 600, 700, 800].
Correlation between recognition values of words and numbers resulted in two distinct planes. This support the previous results obtained in Figure 6 and Figure 7 and can be shown in the following expressions:
 (4)
(4)
 (5)
(5)
 (6)
(6)
Equation (6) results in the paired array:
{160, 400}, {160, 500}, {160, 600}, {160, 700}, {160, 800}.
The expressions in (4), (5), and (6), proves the validity of the expressions in (1), (2), and (3) used in the proposed algorithm.
5. Conclusions
The obtained recognition curve displayed very interesting characteristics resembling a pass band like characteristics. The prescribing curve showed low recognition at the normal resolution used for standard forms due to darkness, low contrast, and small fonts, and low recognition at very high resolution values, which was explained in terms of increase in lines thickening that resulted in letters becoming closer to each other, thus reducing recognition rate. In addition, it is realized a low recognition rate at high zooming value due to blurring. For numbers, it is noticed that they suffer much less in terms of recognition compared with words, and that is normal and expected, as the learning curve is much simpler for numbers in comparison to letters and words.
In conclusion, the quality of scanned forms and characters properties in terms of size and fonts will affect both resolution levels and zooming levels. It is also proved that word recognition will determine the ultimate levels of operation for the interpreting software as it is more affected by optical and digital properties compared with numbers. It is critical to enable a calculating algorithm to properly select all parameters based on type and quality of scanned documents for best results. The complexity of interpretation comes with forms that contain different types and sizes of fonts with low contrast and dark backgrounds. In such cases, the array of resolution versus the array for zooming comes very useful to resolve such issue, as a multi optimum scanning level is possible using the obtained pass band curve.
Cite this paper
Mahmoud ZakiIskandarani, (2015) Improving the OCR of Low Contrast, Small Fonts, Dark Background Forms Using Correlated Zoom and Resolution Technique (CZRT). Journal of Data Analysis and Information Processing,03,34-42. doi: 10.4236/jdaip.2015.33005
References
- 1. Al-Fatlawi, A.H., Ling, S.H. and Lam, H.K. (2014) A Comparison of Neural Classifiers for Graffiti Recognition. Journal of Intelligent Learning Systems and Applications, 6, 94-112.
http://dx.doi.org/10.4236/jilsa.2014.62008 - 2. Rajam, S. and Balakrishnan, G. (2012) Recognition of Tamil Sign Language Alphabet Using Image Processing to Aid Deaf-Dumb People. Procedia Engineering, 30, 681-686.
http://dx.doi.org/10.1016/j.proeng.2012.01.938 - 3. Al-Rousan, M., Assaleh, K. and Tala’a, A. (2009) Video-Based Signer-Independent Arabic Sign Language Recognition Using Hidden Markov Models. Applied Soft Computing, 9, 990-999.
http://dx.doi.org/10.1016/j.asoc.2009.01.002 - 4. Solis, F., Hernandez, M., Perez, A. and Toxqui, C. (2014) Static Digits Recognition Using Rotational Signatures and Hu Moments with a Multilayer Perceptron. Engineering, 6, 692-698.
http://dx.doi.org/10.4236/eng.2014.611068 - 5. Widiarti, A.R., Harjoko, A., Marsono and Hartati, S. (2014) Preprocessing Model of Manuscripts in Javanese Characters. Journal of Signal and Information Processing, 5, 112-122.
http://dx.doi.org/10.4236/jsip.2014.54014 - 6. Pai, N. and Kolkure, V.S. (2015) Optical Character Recognition: An Encompassing Review. International Journal of Research in Engineering and Technology, 4, 407-409.
http://dx.doi.org/10.15623/ijret.2015.0401062 - 7. Li, X.G., Chen, J.H. and Li, Z.J. (2013) English Sentence Recognition Based on HMM and Clustering. American Journal of Computational Mathematics, 3, 37-42.
http://dx.doi.org/10.4236/ajcm.2013.31005 - 8. Shaffie, A.M. and Elkobrosy, G.A. (2013) A Fast Recognition System for Isolated Printed Characters Using Center of Gravity and Principal Axis. Applied Mathematics, 4, 1313-1319.
http://dx.doi.org/10.4236/am.2013.49177 - 9. Naz, S., Hayat, H., Razzak, M.I., Anwar, M.W., Madani, S.A. and Khan, S.U. (2014) The Optical Character Recognition of Urdu-Like Cursive Scripts. Pattern Recognition, 47, 1229-1249.
http://dx.doi.org/10.1016/j.patcog.2013.09.037 - 10. Singh, J. and Lehal, G.S. (2014) Comparative Performance Analysis of Feature (S)-Classifier Combination for Devanagari Optical Character Recognition System. International Journal of Advanced Computer Science and Applications, 5, 37-42.
http://dx.doi.org/10.5120/15048-3416 - 11. Xu, Y., Huang, X., Chen, H. and Jiang, H. (2012) A New Method for Chinese Character Strokes Recognition. Open Journal of Applied Sciences, 2, 184-187.
http://dx.doi.org/10.4236/ojapps.2012.23027 - 12. Wazalwar, D., Oruklu, E. and Saniie, J. (2012) A Design Flow for Robust License Plate Localization and Recognition in Complex Scenes. Journal of Transportation Technologies, 2, 13-21.
http://dx.doi.org/10.4236/jtts.2012.21002 - 13. Patel, C., Patel, A. and Patel, D. (2012) Optical Character Recognition by Open Source OCR Tool Tesseract: A Case Study. International Journal of Computer Applications, 55, 50-56.
http://dx.doi.org/10.5120/8794-2784