Journal of Data Analysis and Information Processing
Vol.1 No.2(2013), Article ID:31820,5 pages DOI:10.4236/jdaip.2013.12003
Relationship between Randomness and Coefficient Alpha: A Monte Carlo Simulation Study
Gaziantep University, Gaziantep, Turkey
Email: bindak@gantep.edu.tr
Copyright © 2013 Recep Bindak. This is an open access article distributed under the Creative Commons Attribution License, which permits unrestricted use, distribution, and reproduction in any medium, provided the original work is properly cited.
Received March 13, 2013; revised April 16, 2013; accepted May 16, 2013
Keywords: Cronbach Alpha; Reliability Coefficient; Randomness; Simulation
ABSTRACT
Cronbach’s Alpha coefficient is the most popular method of examining reliability. It is typically used when the researcher has several Likert-type items that are summed or averaged to make a composite score. Distribution of alpha coefficient has been subjected of many studies. In this study relationship between randomness and Cronbach alpha coefficient were investigated and in this context, present study was examined the question “What is the distribution of the coefficient alpha when a Likert-type scale is answered randomly?” Data were generated in the form of five point Likert-type items and Monte Carlo simulation was run for 5000 times for different item numbers.
1. Introduction
Problems of measurement are concerned with establishing the true value of an observed feature. However, due to various errors involved in the measurement process, this true value cannot be obtained directly via measurement, and may therefore need to be predicted with the help of observed points. Statistical theories have been developed in order to make predictions, one of which is the Classical Test Theory (CTT) [1]. According to this theory, the total score (X) that an individual records in a test is equal to the individual’s true score (T) combined with the error (E) arising from the measurement.
X = T + E (1)
Since each scale (test) includes some form of error, we cannot determine the true score. It is accepted that the error is randomly distributed, and has a mean of zero. In addition, the correlation between true points and error points is also equal to zero [2].
The aim of measurement studies is to obtain values for observed points that are as similar as possible to the true points. Measurement results close to the true scores are as reliable as the random errors they contain of random errors they contain [1].
For either scientific or practical reasons, since the accuracy of measurements is important, researchers should consider the extent to which random errors affect the measurement. If there is sufficient knowledge of the scale of the errors contained in a dataset, it will not be necessary to repeat the research [3].
As a concept, reliability is the degree to which measurement is free from errors [4]. According to CTT, reliability is represented by the strength of the relationship between true values and observed values, with lower level of random error indicating greater reliability [5]. Reliability refers to the consistency of items involved in a test in education and psychology area with the whole of the test. Measurement results are the main subjects of reliability. Reliability is a measure of the elimination of random errors. It is possible to formulate reliability according to the relationship between observed and true points [1].
Since each scale (test) includes some form of error, we cannot determine the true score. The true value is the mean score recorded by an individual over an infinite number of tests. The total score of an individual will vary. Reliability is closely related to the variance of measurement hence reliability can be considered here in as the ratio of the variance of true scores to the variance of total scores.
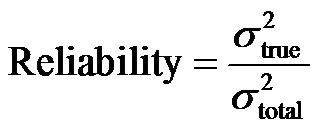 (2)
(2)
Since an individual’s true score will not vary from one test (application) to another, the numerator (2) will always be zero. Therefore, equation (2) is an expression of reliability for a group in which members differ from one another in terms of measured characteristics [2].
The reliability index is the ratio of the variation in true points to the variation in observed points. The reliability index is theoretical, since the variation of true points is not known; thus, the reliability coefficient is defined. It can be theoretically shown that reliability coefficient is equal to the reliability index [1].
The original method of calculating internal consistency is termed split-half. As inferred by the name, the test is calculated by randomly being divided into two halves and obtaining the correlation between these two halves. If the scale has internal consistency, both random halves will include similar items. The formula will be as follows depending on variance of differences between the test scores of the two halves is :
:
 (3)
(3)
The right most part of the equation  is the proportion of error variance in the scores, which can be thought of as what the items do not have in common [2].
Cronbach’s Alpha Coefficient
Cronbach alpha is commonly used index of test reliability. It can be used for any test on which scores are produced by summing the scores of two or more test items. It was developed through the contributions of many researchers and was named by Lee Joseph Cronbach, who introduced its usability for the first time [6].
Cronbach’s alpha coefficient based on classical test theory is basically a reliability index. Cronbach’s alpha is used to determine whether items are consistent with one another; in a test based on total or average point, to determine whether the items measure a hypothetical variable [5].
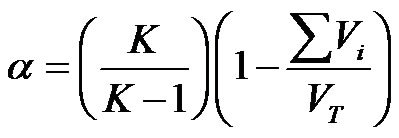
The coefficient alpha is defined as follows [7],
 (4)
(4)
where K represents the number of the item; V1, V2,··· Vk represent the variation of 1, 2,···K item points, respectively; and VT represents the variation of scale (total) score. When the scale items are scored as 0 or 1, Equation (4) turns into the formula Kuder-Richardson KR-20 [7].
Cronbach (1951) showed that the coefficient alpha was equal to correlation means obtained from all possible random halves of a test. If a test is regarded as a population of items, the coefficient alpha means a prediction of correlation between two samples drawn randomly from the population [7].
The coefficient alpha gives the correlation of observed points belonging to a joint measurement consisting of K components with true points. It shows how consistent the components are with the entire measurement. The coefficient alpha is a consistency measurement of component points with joint test points [1].
The scale does not need to be applied twice, and this may pave the way for Cronbach’s alpha being the most widely-used reliability index [2]. The coefficient alpha is commonly used. For example The Cronbach, (1951)’s article entitled, “Coefficient Alpha and the Internal Structure of Tests” was cited frequently (The Web of Science database contained 6971 matches (Scanning date: 20 June 2012, Web of Science Cited Reference Search _ cited title).
In a meta-analysis of Cronbach’s alpha, [4] analyzed 33,000 articles published in different journals between the years 1971 and 1992. It was found that the coefficient alpha was reported 4286 times, the alpha range was 0.06 - 0.99, the mean was 0.77, and the median was 0.79. No relationship was found between the coefficient alpha size and the research subject.
In the literature some studies examined confidence intervals for Cronbach’s alpha coefficient via Monte Carlo simulations. For example Maydeu-Olivares, Coffman and Hartmann [8] performed simulation studies to investigate the behavior of asymptotically distribution-free versus normal-theory interval estimators of coefficient alpha. In [9], were investigated three different bootstrap methods for estimating confidence intervals for coefficient alpha. In another study [10] eight of the different methods for computing confidence intervals around alpha investigated.
There are very few studies on “acceptable reliability” or “sufficient reliability” within the literature. The degree of reliability suggested in some studies varies according to the purpose of the research. For example, suggestions include a minimum reliability of 0.70 for pre-application, 0.80 for fundamental research, and 0.90 - 0.95 for application-based research [4]. Long tests are intuitively more reliable, because they provide more information on which to base the assessment [6].
Some studies in the literature examined cases in which the Cronbach’s alpha was misinterpreted. It was reported that the coefficient alpha was misinterpreted in the relationship between internal consistency and one-dimensionality. For example, a study of the variation in internal consistency coefficient reported that, when one-dimensionality was disrupted, very high KR20 and alpha internal consistency coefficients could be obtained even in cases where one-dimensionality was not ensured in the calculation of internal consistency coefficients [11]. Internal consistency was a necessary but not sufficient condition for homogeneity of items in a test [12]. Alpha coefficient is not a measure of homogeneity or unidimensionality [13]. A homogenous (one-dimensional) test has internal consistency but the reverse is not true; it is not correct to use the coefficient alpha as an index of homogeneity [6]. Since the coefficient alpha is affected by the length of the scale, high alpha value does not guarantee one-dimensionality or internal consistency. Among two groups, a higher coefficient alpha is obtained from the more homogenous group. Thus, using an alpha value reported in a published study is erroneous [2].
There are some studies in which the Cronbach’s alpha coefficient was analyzed via simulation [14-16]. Sideridis (1999) analyzed bias features of the Cronbach’s alpha via Monte Carlo simulation, using data with different distributions. The simulation used data obtained from 250 observations suitable for a 10-item, 5-point Likert-type test, were used and 100 trials were performed. In normal and uniform distributions, alpha was found to be non-zero. It was suggested that the alpha could be used for data with different distributions [14]. Leontitsis and Pagge (2007) used simulation to solve a problem of statistical significance problem in Cronbach’s alpha [15]. The study used data obtained from a coefficient alpha 0.50, and a 10-item scale completed by 20 people; column data were randomly intermingled and the coefficient alpha was calculated each time. Following 1000 trials, the minimum alpha coefficient was obtained as −1.40, and maximum alpha coefficient was 0.46. Therefore, it was concluded that the α = 0.50 value was statistically significant even at the level of 0.1%. Yurdugül (2008) used a simulation method to examine the minimum sampling width necessary for reliable prediction of the coefficient alpha of the population. It was concluded that a robust and consistent alpha prediction depended on the size of the first eigenvalue as well as sampling width size; and when the first eigenvalue was larger, a robust prediction of the coefficient alpha was possible even with lower sampling width [16].
The Cronbach’s alpha coefficient was seen to be used in a wide range of fields and studies. Considering studies on the theoretical features of Cronbach’s alpha coefficient, it was thought that the relationship between the coefficient alpha and randomness was a subject worth of further research. To that end, the present study examines the question “What is the distribution of the coefficient alpha when a Likert-type scale is answered randomly?”
2. Subject & Methods
In contrast to the problem of the minimum sample width and bias, which were examined in the literature, this study examines the relationship between Cronbach’s alpha and randomness. For this purpose, artificial data were derived using simulation, and the alpha coefficient was predicted of a K-item with 5-point Likert-type scale, which was answered randomly by 5K people. Each trial was repeated for 5000 times, and the resulting alpha values were analyzed.
A Monte Carlo simulation was used. The data comprised random numbers generated in Microsoft Excel. All calculations and simulations were done using Microsoft Office Excel. A flowchart of the algorithm is shown in Figure 1.
Operation Steps
1) A 5K × K type data matrix was formed by using the RANDBETWEEN(1; 5) function in Microsoft Excel to represent the data of the K-item scale randomly completed by 5K people.
2) Scale scores were obtained by calculating line total in the Excel spreadsheet, and α value was calculated using Equation (4).
3) The above steps were repeated 5000 times, and calculated α values were recorded in a column.
4) For the 5000 trials, the α value mean, median, maximum value, 95% and 99% maximum values were found.
5) The steps were repeated by taking K = 10, 12, 14,···, 40 at Step 1.
Excel functions used:
RANDBETWEENLARGEAVERAGEVARSTDEVMEDIANSUM.
For the iteration at the third step used:
DataWhat-If AnalysisData Table.
3. Results
Following 5000 trials, this section presents the maximum α value, α value median and mean, 95% and 99th% α values when ordered from small to large with α values standard deviation were presented for each item number (K) (Table 1).
The mean α coefficients calculated for 5000 trials for each value of K were negative and very close to 0. When considered together with median values, the α coefficient distribution is slightly negatively skewed. The standard deviation of the alpha coefficient is approximately 0.22, and does not vary with an increase in the number of items. Although there is variability in the maximum alpha values obtained for each K (minimum 0.455; maximum 0.521), this variability is not related to the K number. When the cumulative distribution of α coefficients is analyzed, the 95th percentile value is approximately 0.27
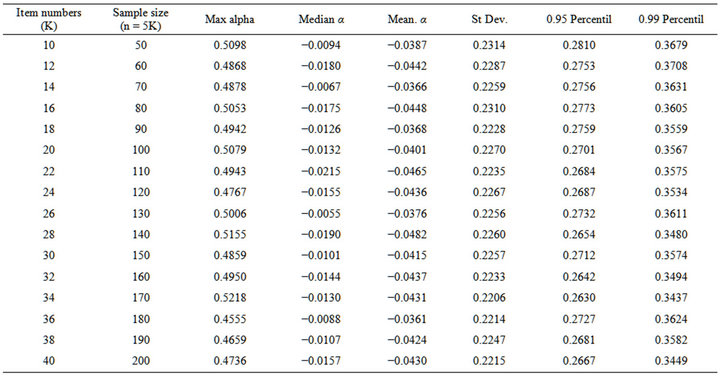
Table 1. According to simulation results distribution of alpha.
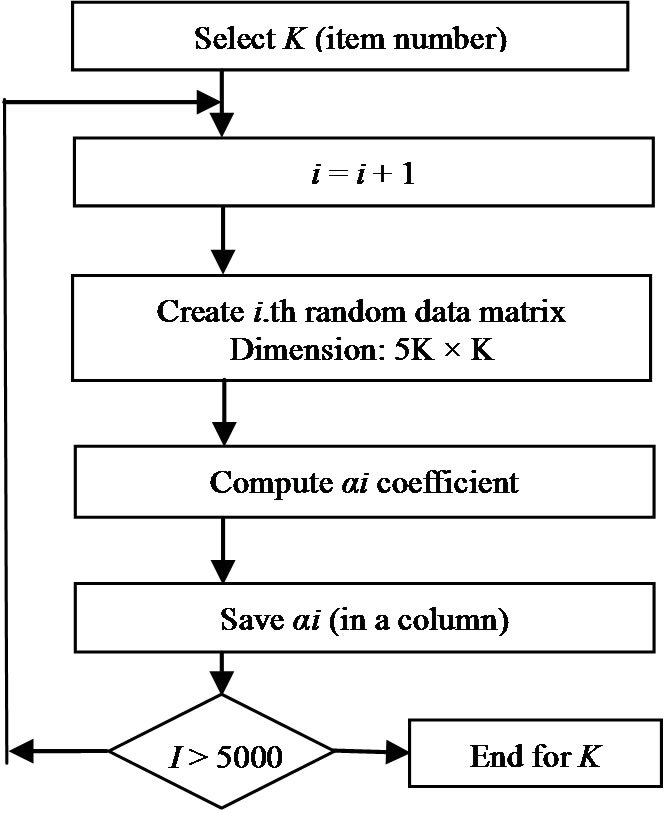
Figure 1. Flowchart of the algorithm.
for all Ks, and the 99th percentile value is approximately 0.35.
Figure 2 shows variance of alpha values according to the item numbers for 95% and 99% percentiles. The alpha values have lower tendency to decrease when the item numbers increase.
4. Conclusions
The distribution of Cronbach’s alpha coefficients was analyzed when a K-item scale was randomly completed. The simulation results shows that the expected α value will be −0.04 for a K = 20-item scale, 5-point Likert-type
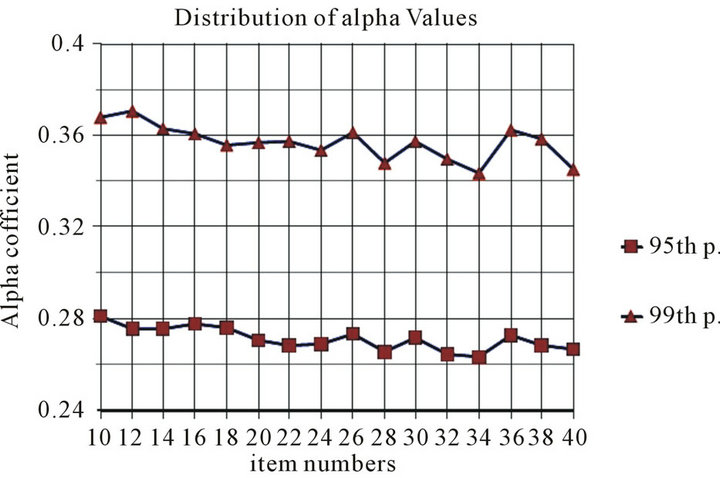
Figure 2. 95th and 99th percentile values of alpha calculated according to item numbers.
scale that is randomly completed in 100 trials; α alpha value with maximum 5% possibility will be 0.27; and 1% possibility will be 0.35. When the cumulative distribution of alpha coefficients is analyzed, the 95th percentile value is approximately 0.27 for all Ks and the 99th percentile value is approximately 0.35. Therefore, the possibility of the Cronbach’s alpha coefficient of a Kitem 5-point Likert scale that is randomly replied by 5K people being 0.27 or more is less than 5%. Similarly, the possibility of the Cronbach’s alpha coefficient of a Kitem 5-point Likert scale that is randomly replied by 5K people being 0.35 or more is less than 1%.
Another finding is that the expected Cronbach’s alpha of a 5-point randomly completed Likert scale is negative and approximately 0. This finding is consistent with reported in the literature, that alpha coefficient can have negative values. Since the reliability is the ratio of two variance, it is initially thought that Cronbach’s alpha must be between 0 and 1. In addition, in cases where some items are negatively correlated with the rest of the scale items, the alpha will be negative. While calculating the scale score, negative alpha is not obtained in practice, since negative items are reverse-graded [2].
REFERENCES
- Y. Baykul, “Measurement in Education and Psychology: Classical Test Theory and Its Application,” Osym Press, Ankara, 2000.
- D. L. Steiner, “Starting at the Beginning: An Introduction to Coefficient Alpha and Internal Consistency,” Journal of Personality Assessment, Vol. 80, No. 1, 2003, pp. 99- 103. doi:10.1207/S15327752JPA8001_18
- L. J. Cronbach, “My Current Thoughts on Coefficient Alpha and Successor Procedures,” Educational and Psychological Measurement, Vol. 64, No. 3, 2004, pp. 391- 418. doi:10.1177/0013164404266386
- R. A. Peterson, “A Meta-Analysis of Cronbach’s Cofficient Alpha,” Journal of Consumer Research, Vol. 21, No. 2, 1994, pp. 381-391. doi:10.1086/209405
- H. Şencan, “Reliability and Validity for Measurement in the Behavioral and Social,” Seckin, Ankara, 2005.
- M. B. Miller, “Cofficient Alpha: A Basic Introduction from the Perspectives of Classical Test Theory and Structural Equation Modeling,” Structural Equation Modeling, Vol. 2, No. 3, 1995, pp. 255-273. doi:10.1080/10705519509540013
- L. J. Cronbach, “Coefficient Alpha and the Internal Structure of Tests,” Psychometrika, Vol. 16, No. 3, 1951, pp. 297-334. doi:10.1007/BF02310555
- A. Maydeu-Olivares, D. L. Coffman and W. M. Hartmann, “Asymptotically Distribution-Free (ADF) Interval Estimation of Coefficient Alpha,” Psychological Methods, Vol. 12, No. 2, 2007, pp. 157-176. doi:10.1037/1082-989X.12.2.157
- M. A. Padilla, J. Divers and M. Newton, “Coefficient Alpha Bootstrap Confidence Interval under Nonnormality,” Applied Psychological Measurement, Vol. 36, No. 5, 2012, pp. 331-348. doi:10.1177/0146621612445470
- J. L. Romano, J. D. Kromrey and S. T. Hibbard, “A Monte Carlo Study of Eight Confidence Interval Methods for Coefficient Alpha,” Educational and Psychological Measurement, Vol. 70, No. 3, 2012, pp. 376-393. doi:10.1177/0013164409355690
- S. Tan, “Misuses of KR-20 and Cronbach’s Alpha Reliability Coefficients,” Education and Science, Vol. 34, No. 152, 2009, pp. 101-112.
- M. Tavakol and R. Dennick, “Making Sense of Cronbach’s Alpha,” International Journal of Medical Education, Vol. 2, 2003, pp. 53-55. doi:10.5116/ijme.4dfb.8dfd
- N. Schmitt, “Uses and Abuses of Coefficient Alpha,” Psychological Assessment, Vol. 8, No. 4, 1996, pp. 350-353. doi:10.1037/1040-3590.8.4.350
- G. D. Sideridis, “Examination of the Biasing Properties of Cronbach Coefficient Alpha under Conditions of Varying Shapes of Data Distribution: A Monte Carlo Simulation,” Perceptual and Motor Skills, Vol. 89, No. 3, 1999, pp. 899-902. doi:10.2466/pms.1999.89.3.899
- A. Leontitsis and J. Pagge, “A Simulation Approach on Cronbach’s Alpha Statistical Significance,” Mathematics and Computers in Simulation, Vol. 73, 2007, pp. 336-340. doi:10.1016/j.matcom.2006.08.001
- H. Yurdugül, “Minimum Sample Size for Cronbach’s Coefficient Alpha: A Monte-Carlo Study,” Hacettepe University Journal of Education, Vol. 35, 2008, pp. 397-405.