International Journal of Geosciences
Vol.06 No.07(2015), Article ID:58085,9 pages
10.4236/ijg.2015.67053
On the Diurnal Dependence of fbEs-Variations Due to Earthquakes
Elena V. Liperovskaya1, Claudia-Veronika Meister2,3, Dieter H. H. Hoffmann2,3, Alexandra S. Silina1, Natalia E. Vasil’eva1
1Institute of Physics of the Earth of the Russian Academy of Sciences, Moscow, Russia
2Institut für Kernphysik, Technische Universität Darmstadt, Darmstadt, Germany
3Graduate School of Excellence Energy Science and Engineering, Darmstadt, Germany
Email: liper@ifz.ru, c.v.meister@skmail.ikp.physik.tu-darmstadt.de
Copyright © 2015 by authors and Scientific Research Publishing Inc.
This work is licensed under the Creative Commons Attribution International License (CC BY).
http://creativecommons.org/licenses/by/4.0/


Received 5 June 2015; accepted 13 July 2015; published 17 July 2015
ABSTRACT
In the present work, disturbances of the half-transparency frequency
 of the ionospheric sporadic E-layer are investigated in connection with earthquakes. The
 -frequency is propor- tional to the square root of the maximum ionisation density of the sporadic E-layer. In this work, it is shown that in 2/3 of the cases, two days before a seismic shock with magnitude
 and on the day of the shock, an increase of the
 -frequency is obtained at sunset hours at distances from the epicenter
 km. In contrast, before sunrise, the
 -value decreases. The data analysed are obtained by the three vertical ionospheric sounding stations “Kokubunji”, “Yamagawa”, and “Wakkanai” during some tens of years.
Keywords:
Earthquake Precursors, Ionosphere, Sporadic E-Layer, Half-Transparency Frequency, Earthquake Preparation Region, Solar Influence on E-Layer, Geomagnetic Influence on E-Layer

1. Introduction
Recently, it has been experimentally verified that at different altitudes above the Earth’s surface, and accor- dingly in different ionospheric layers, disturbances are observed, which occur―in comparison with the so-called non-seismic background time―with large probability at a special daytime some days before earthquakes [1] . Of late, in connection with the search for ionospheric precursors of earthquakes, variations of different ionospheric parameters are being discussed. There are regular parameters among them like the frequencies
 and
and , but it also exists parameters which characterize irregular processes. To them, for instance, the half-transparency frequency
 of the sporadic E-layer
 belongs. Many scientific works are devoted to effects of earthquake preparation in
 -layers.
It is found that earthquake preparatory anomalies of ionospheric parameters are observed most often 1 - 5 days before seismic shocks with magnitudes . Besides it is perceived that the anomalies’ occurrence is connected with the magnitude of the earthquakes and with their distances to the epicentres [2] -[6] .
In the work [7] , a statistical analysis of pre-earthquake ionospheric anomalies is performed, which are registered by continuous GPS TEC (Global Positioning System-Total Electron Content) measurements for earthquakes with . It is found that anomalies are obtained one-two days before seismic shocks (on the days (−2, −1)) most often. In [8] , seismo-ionospheric effects in the temporary run of the frequency
 are observed 1-5 days before earthquakes with
 from 12 to 18 h LT. Before very strong earthquakes with
 , sometimes anomalies are observed in the
 -layer, which amplitudes are much larger than the background ones [9] [10] .
Anomalous
 -increases seem to be a seismic precursor, as follows from the Hyogoken-Nambu earth- quake (M = 7.2 on January 17, 1995). Before the earthquake, on the whole day January 15, the geomagnetic and solar conditions were very quiet and, thus, could not cause a
 -increase. Nevertheless, at epicentral dis- tances of 120 km (at Shigaraki) and 500 km (at Kokubunji),
 -values above 8 MHz were registered on January 15 at daytime [11] . The normal
 -values in Japanese winter are below 6 MHz. But it is very difficult to perform statistical analyses for very strong earthquakes with
 due to the fact that they are seldom. For statistical studies, earthquakes with lower magnitudes have to be used.
Daytime dependences of the occurrence of pre-earthquake anomalies are investigated in only some works. In the works by Ondoh and Hayakawa [9] and by Ondoh [11] , an anomaly of the
 -layer is obtained in the daytime two days before an earthquake with
 . In the study [12] , the anomalous growth of the parameter
 before strong eqarthquakes with magnitudes
 in Taiwan (1994-1999) is investigated by analysing 16 seismic shocks. In doing so, an increase of
 at sunset and sunrise times is obtained. In the paper [3] a graphic is presented, which shows effects of increased
 -activity during the period of the Kultuk earthquakes near the Baykal Lake in August 2008. Also in this case an anomalous growth of
 is pre- dominantly observed during sunset and sunrise hours. In the works [2] [13] [14] seismo-ionospheric effects in the sporadic layer are found two days before earthquakes with
 , i.e. in the time interval (−2, −1), or at the day of the earthquakes.
The distance R from the epicentre, at which earthquake precursors are observed in the ionosphere, amounts, as a rule, to some hundreds of kilometres. On the average, it may be estimated by the formula
 km [15] .
In the present work, an analysis of the
 -frequency is performed for some tens of earthquakes with magnitudes
 by using data of the Japanese vertical sounding stations “Kokubunji”, “Yamagawa”, and “Wakkanai”. It is suggested that seismo-ionospheric effects may be observed in the time interval (−2, −1, 0).
2. Method of Data Analysis
Here, ionospheric effects of earthquakes are investigated by using data recorded by the vertical sounding stations “Kokubunji” (Tokyo) ( ,
,
 , 1977-1988), “Yamagawa” (
 ,
,
 , 1968-1987), and “Wakkanai” (
 ,
,
 , 1969-1989) at every hour. These data are presented in the internet (http://wdc.nict.go.jp/IONO/wdc/index.html).
Sporadic
 -layers, these are clouds with increased degree of ionisation, which have a pancake form and occur at altitudes of 90 - 140 km. The layers have large horizontal and small vertical dimensions, and normally consist of long-living metallic ions. The phenomenon of the wind shear is believed to be the reason of the formation of sporadic layers [16] . In accordance with the wind shear model,
 -layers arise at altitudes where local horizontal winds change their direction from west to east and the vertical velocity gradients are of the order of 0.05 - 0.06 s−1 or larger. The charged particles move into the direction of the point where the wind velocity equals zero, and as a result, a sporadic layer forms. The diffluence of the sporadic layers is mainly caused by ambipolar diffusion and/or turbulent diffusion.
In the order of magnitude, the maximum plasma concentration of the
 -layer reaches 105 - 106 cm−3. Such layers have a horizontal dimension of 100 - 200 km. The ionisation density equals
 in the day- time, and it is about 2 - 3 orders of magnitude lower at night.
The thickness of the sporadic layers, i.e. their vertical dimensions, varies between a few hundred metres and a few kilometres. One of the main characteristic frequencies which is observed by ionograms of vertical sounding stations is the screening (or half-transparency) frequency . Recently it is taken for granted that it corre- sponds to the maximum ionisation density in the sporadic layer
 .
.
Let us investigate the daytime variations of the
 -frequency, which are connected to earthquakes. The aim of the present work is to illustrate at which hours of local time LT and at which distances from the epi- centres of seismic shocks a modification of the daytime behaviour of the characteristic
 -frequency occurs because of earthquakes.
The
 -frequency may change within a rather broad frequency interval. In Figure 1, the temporal de- pendence of the
 -frequency is presented for the years 1977-1979. The observations were made by the station “Kokubunji” at 00:00 LT (LT = UT + 9h). The sporadic layer, in contradiction to regular layers, does not always exist. During the years of large solar activity of the 11 years solar cycle (1978-1979), the sporadic layer is more often observed than during the years of lower solar activity (1977). In Figure 1, the seasonal de- pendence of the
 -frequency is clearly to be seen. The
 -maximum occurs in the summer months.
In the daytime dependence of the
 -frequency, a maximum is found after noon and a minimum occurs before sunrise. After the sunset (that means beginning with about 19 h LT), a weak continuous decrease of
 is observed. The amplitude of the diurnal
 -value depends on the season (see Figure 2).
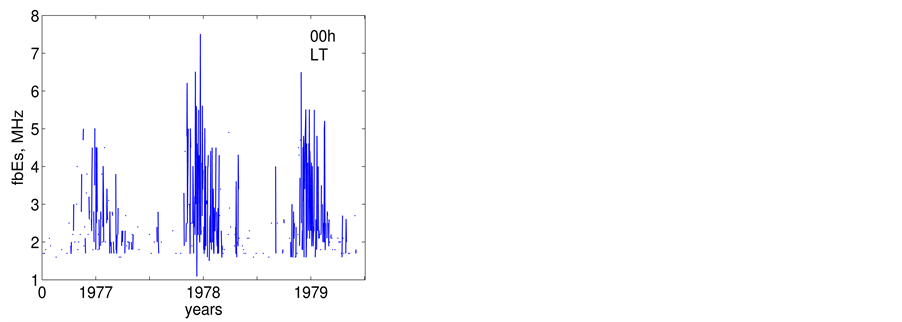
Figure 1. Monthly-mean
 frequency observed by the station “Kokubunji” at 00:00 LT in the years 1977-1979.
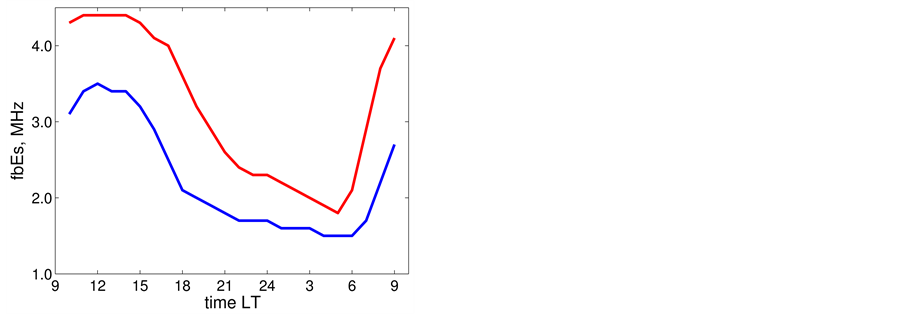
Figure 2. Daytime dependence of the
 -frequency registered by the vertical ionospheric sounding station “Kokubunji”. The red line describes the values for the summer (April, May, June, July, August, September). The values of the winter (October, November, December, January, February, March) are presented in blue.
To obtain observable variations of the
 -frequency, which are connected to processes of earthquake pre- paration, it is necessary to lower the seasonal dependence of the data, when one uses the method of super- position of epoches. Therefore, for any value of
 (for any hour) a dimensionless frequency

is calculated. The median value of ,
,
 is found for the time interval of 15 days, which means for the interval (−7, +7). For the normalized frequency
 , the superposition of epoches method may be applied.
It has to be underlined that the form of the
 -distribution is not symmetric, this is caused by large flashes of
 . And this is also the reason for the positive mean values of the daytime behaviour of
 (see the dotted line in Figure 3).
It should be mentioned that the maximum
 -variations are observed after sunset (18 - 23 h LT) and before sunrise (2 - 4 h LT) (see Figure 3).
Now the influence of the processes of earthquake preparation on the daytime behaviour of the dimensionless parameter
 will be analysed. In Figure 3, results of the method of superposition of epoches for the station “Kokubunji” are presented. The days (−2, −1, 0) before earthquakes with focus depths smaller than 60 km are considered to be seismo-active in case that the distance between epicenter and vertical sounding station is smaller than
 km. Earthquakes with magnitudes
 are taken into account. If on one and the same day more than one earthquake happened, then these seismic shocks were suggested to contribute to only one earthquake. Red lines in Figure 3 show results for seismo-active days, the dotted blue line presents the mean value for all days, seismoactive and background ones. The main growth of the
 -frequency occurs after sunset during 19 h LT and 24 h LT.
Let us study the dependence of
 on the earthquake magnitude. In doing so, for any earthquake with
 , the mean value of
 of the time interval (19 - 24 h LT) is calculated. Then, the average for the pre-earthquake days (−2, −1, 0) is found. During the analysed years 1977-1988, 79 earthquakes happened. But a sporadic layer was only observed in 44 cases.
The result of the study is presented in Figure 4. From the analysis follows, that an anomalous increase of
 occurs for more than two thirds of the earthquakes with
 . Two earthquakes with magnitudes
 , for which an
 -growth is observed in the time interval (19 - 24 h LT), are conditionally included in the earthquake group
 . The mean value of
 for seismic shocks with
 is much larger than the average for weaker earthquakes.
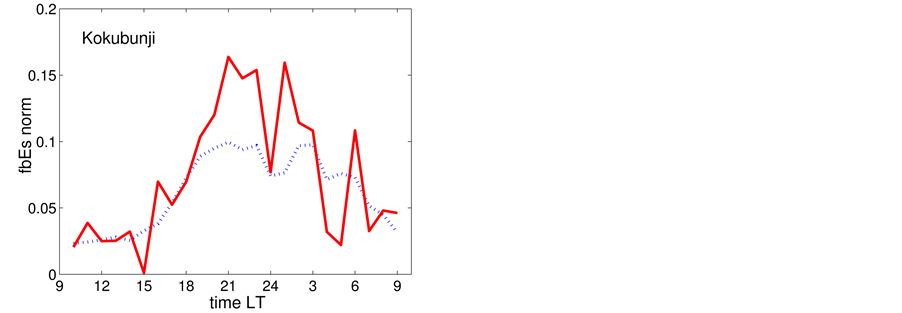
Figure 3. Result of the superposition of epoches. Normalized frequency
 as function of the local time LT. The days (−2, −1, 0) before earthquakes with magnitudes
 are considered as seismo-active ones. Only earthquakes with distances from the station “Kokubunji”
 and focus depths
 are taken into account. Full line―
 at seismic activity, dotted line―mean value of
 including the background.
Next, the influence of the distance between the epicentre and the sounding station on
 is considered. 48 earthquakes with magnitudes
 , focal depths
 , and epicentres situated at distances of not more than
 from the observing sounding station are taken into account. The results of the analysis are shown in Figure 5. As follows from Figure 5, the increase of the
 -frequency is characteristic for most of the earthquakes (for 20 of 28) which happen within the radius
 km.
km.
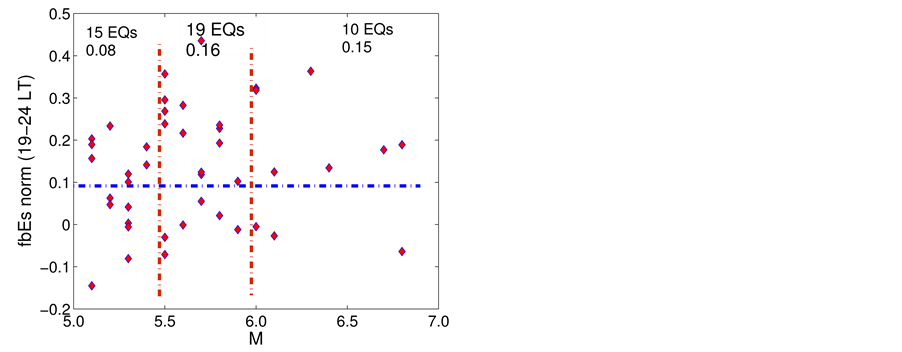
Figure 4.
 averaged over the time intervals (19 - 24) LT of the days (−2, −1, 0) as function of the magnitude M. Only earthquakes with magnitudes
 , distances from the station “Kokubunji”
 and focus depths
 are taken into account. The dotted line presents the mean value of
 including the background. The red lines divide the earthquakes into groups according to different magnitudes, for which mean values are found. The numbers at the top equal the mean values of the groups.
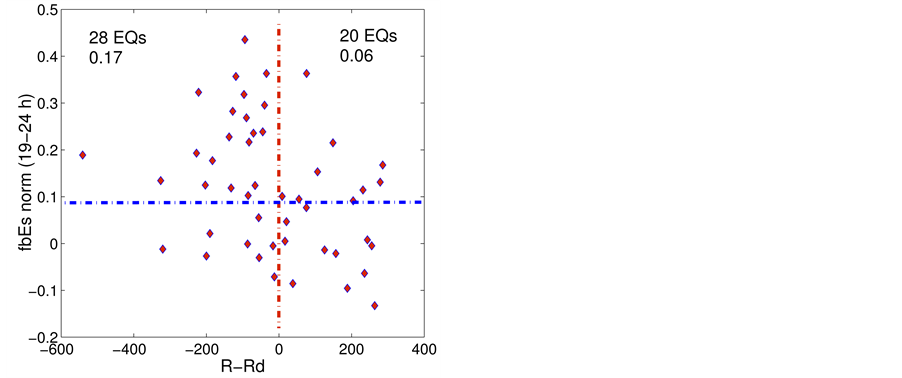
Figure 5.
 averaged over the time intervals (19 - 24) LT of the days (−2, −1, 0) as function of the distance R from the station Kokubunji. Only earthquakes with magnitudes
 , distances from the station “Kokubunji”
 km, and focus depths
 are taken into account. The dotted line presents the mean value of
 including the background. The red line divides the earthquakes into groups of shocks occurring inside and outside the earthquake preparation region. The numbers at the top equal the mean values of the groups.
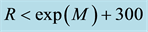
Finally, the anomalous
 -variations are studied in dependence on the depth of the earthquake focus. 34 seismic shocks with
 ,
,
 ,
,
 are taken into account. The result is presented in Figure 6. Too less data of earthquake observations are available to make a statistically reliable conclusion. But, it seems to be very probable, that for earthquakes with focus depths
 an increase of
 is not obtained in the time interval (19 - 24) LT. The mean value of
 for this group of earthquakes is almost equal to the background value of
 .
.
Let us study analogous dependences of pre-earthquake effects on the daytime dependence for other vertical sounding stations. In case of the station “Yamagawa” (Figure 7) it is found, that an increase of
 is
is
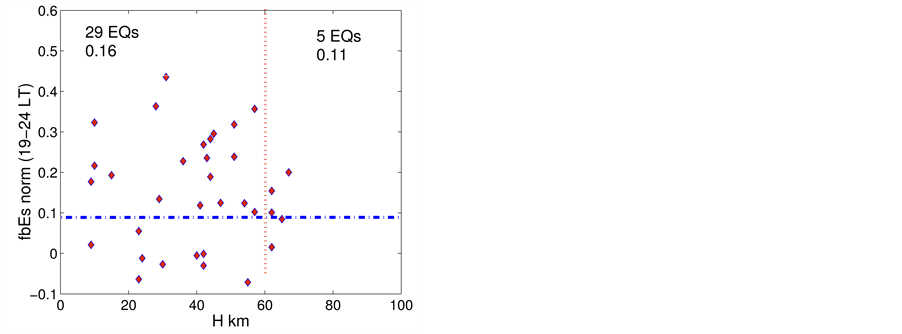
Figure 6.
 averaged over the time intervals (19 - 24) LT of the days (−2, −1, 0) as function of the focal depth H. Only earthquakes with magnitudes
 , distances from the station “Kokubunji”
 and focus depths
 are taken into account. The dotted line presents the mean value of
 including the background. The red line divides the earth- quakes into groups for which mean values are found. The numbers at the top equal the mean values of the groups.
Figure 7.
 averaged over the time intervals (19 - 24) LT of the days (−2, −1, 0) as function of the magnitude M. Only earthquakes with magnitudes
 , distances from the station “Yamagawa”
 and focus depths
 are taken into account. The dotted line presents the mean value of
 including the background. The red line divides the earth- quakes into groups for which mean values are found.
observed for earthquakes with magnitudes . During the considered time interval in the environment of the station “Yamagawa” 58 earthquakes occurred. Observational data for the evening hours are only available for 21 earthquakes.
Studying data registered by the vertical sounding station “Wakkanai” (Figure 8), an increase of
 is found for earthquakes with magnitudes
 . During the considered time interval in the environment of the station “Wakkanai” 29 earthquakes took place. Observational data for the evening hours are available for only 9 earthquakes.
To demonstrate the seasonal dependence of the variations of the normalized frequency
 with the daytime, earthquakes with magnitudes
 , distances from the vertical sounding station
 , and focal depths
 are taken into account. The results of the analysis for data of the station “Kokubunji” are presented in Figure 9 for summer months (April-September) and winter months (October-March) separately.
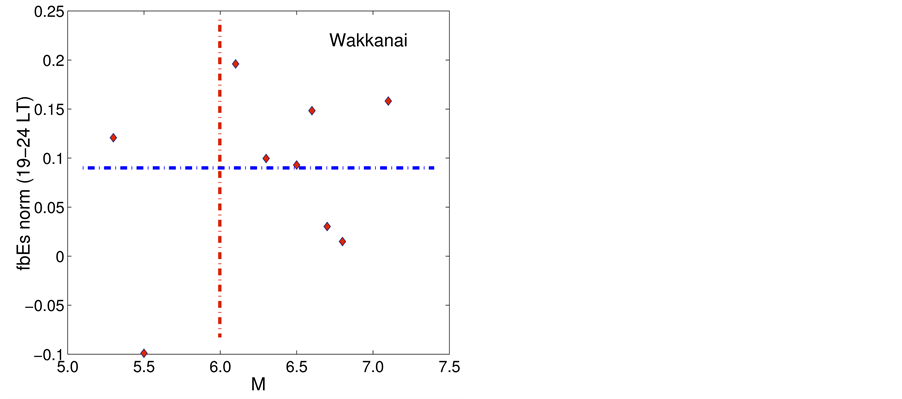
Figure 8.
 averaged over the time intervals (19 - 24) LT of the days (−2, −1, 0) as function of the magnitude M. Only earthquakes with magnitudes
 , distances from the station “Wakkanai”
 and focus depths
 are taken into account. The dotted line presents the mean value of
 including the background. The red line divides the earthquakes into groups for which mean values are found.
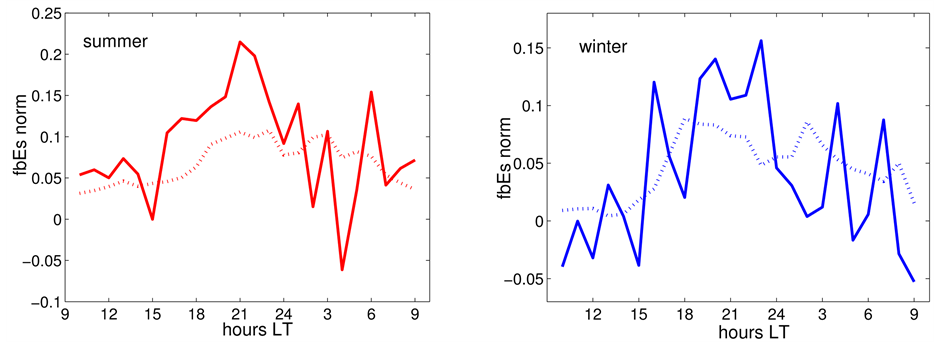
Figure 9. Daytime dependence of
 at different seasons. The red lines on the left side show the result for summer (April-September) and the blue lines on the right side for winter (October-March). Full lines represent
 observed by the station “Kokubunji” at times with shocks with magnitudes
 , dotted lines show
 for the background times.
The full lines show the
 -behaviour during seismo-active times, and the dotted lines present the be- haviour during the background time. It is to be seen, that the variations at summer time are somewhat larger than at winter time.
Next, the influence of the solar activity on the diurnal behaviour of
 is discussed. Using the data of the station “Kokubunji”, in Figure 10
 is presented for diffent solar activity. On the left side of Figure 10, results of the analysis (full line) are presented, which are obtained for Wolf numbers
 . The right side of Figure 10 (full line) shows the result for the other days with
 . The dotted lines demonstrate the results for the related background times. One may conclude that the increase of
 before midnight grows with increasing Wolf number.
The background values of
 at night have almost the same values at high and low solar activity. But considering seismo-active periods, at daytime, the increase of
 is about two times larger than at night. An analogous behaviour of
 is found in case of the seasonal dependence. During summer and winter times, the background values of
 are almost the same. And the
 -growth in summer is con- siderable larger than in winter. In summer and/or at days with higher solar activity, the ionisation density of the E-layer increases. Consequently, an electromagnetic transfer of seismic disturbances from the lithosphere to the ionosphere is possible.
Finally, the influence of geomagnetic disturbances on the diurnal
 -variations during seismo-active and background times is studied. In doing so, days with a geomagnetic index
 are assumed to be geomagnetically disturbed ones. Also the day after a day with
 is suggested to be geomagnetically modified, as the negative phase of a geomagnetic storm begins days-hours after the disturbance.
Using the data of the station “Kokubunji”, in Figure 11, the daytime behaviour of
 is presented for
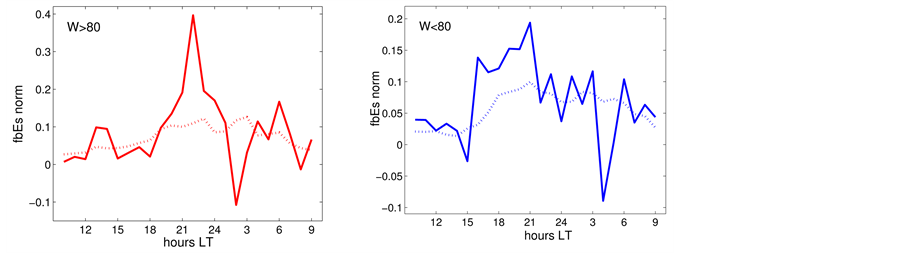
Figure 10. Daytime dependence of
 at different levels of solar activity. The red lines on the left side show the result for days with high solar activity,
 , and the blue lines on the right side take days with
 into account. Full lines represent
 observed by the station “Kokubunji” at times with shocks with magnitudes
 , dotted lines show
 for the background times.
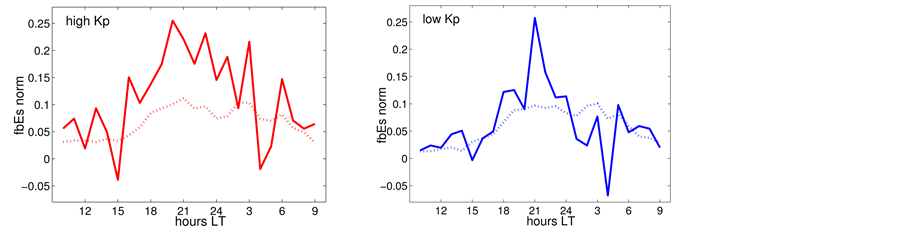
Figure 11. Daytime dependence of
 at different levels of geomagnetic disturbances. The red lines on the left side show the result for days with high geomagnetic activity
 and the following day, and the blue lines on the right side take all other days into account. Full lines represent
 observed by the station “Kokubunji” at times with shocks with magnitudes
 , dotted lines show
 for the background times.
different levels of geomagnetic activity. All data are divided into two parts, into days with , including the following day, and into all other remaining days. This division is chosen to assure that the group of geomagnetically disturbed days is not to small.
The results of the analysis are presented in Figure 11. It has to be noticed that, considering the data of the station “Kokubunji”, in the time interval from midnight until the morning hour of 05 LT,
 continuously decreases. This decrease is in accordance with the observations presented in [2] . Unfortunately, the number of sporadic E-layers observed by the stations “Yamagawa” and “Wakkanai” between midnight and 05 h LT are too small to make statistically reliable conclusions.
3. Conclusions
Analysing
 -observations of the vertical sounding stations “Kokubunji”, “Yamagawa”, and “Wakkanai”, it is found that the
 -frequency increases after sunset (between 19 h LT and 24 h LT) two days before earthquakes (i.e. in the interval of days (−2, −1, 0)) in case of seismic shocks with magnitudes
 , focal depths
 , and distances between the epicentre and the sounding station
 km. For some tens of earthquakes taken into account for the three sounding stations, the increase of
 is observed in two thirds of the cases.
The radius R of the earthquake preparation region may be estimated based on the Dobrovolsky formula
 [15] . From geometric considerations follows that weak disturbances, propagating from the Earth’s surface upwards, may cause modifications of the ionosphere if the dimension of the earthquake pre- paration region is larger than the distance l between the Earth’s surface and the E-layer, i.e.
 . Consequently the magnitudes of the earthquakes should be larger than
 .
.
Maximum amplitudes of the disturbances in the ionosphere occur at almost vertical propagation of the disturbance from the Earth’s surface to larger altitudes. Thus the authors suggest that an influence on the lower part of the ionosphere may be observed in connection with earthquakes, the preparation region of which contains the location of the vertical sounding station.
This work was presented at the Spring Conference “Plasma Physics” of the German Physical Society in Bochum, 2-5 March 2015.
Cite this paper
Elena V.Liperovskaya,Claudia-VeronikaMeister,Dieter H. H.Hoffmann,Alexandra S.Silina,Natalia E.Vasil’eva,11, (2015) On the Diurnal Dependence of fbEs-Variations Due to Earthquakes. International Journal of Geosciences,06,656-665. doi: 10.4236/ijg.2015.67053
References
- 1. Pulinets, S.A. and Boyarchuk, K.A. (2004) Ionospheric Precursors of Earthquakes. Springer, Berlin.
- 2. Liperovsky, V.A., Pokhotelov, O.A., Liperovskaya, E.V., Parrot, M., Meister, C.-V. and Alimov, A. (2000) Modification of Sporadic E-Layers Caused by Seismic Activity. Survey in Geophysics, 21, 449-486. http://dx.doi.org/10.1023/A:1006711603561
- 3. Pulinets, S.A. and Davidenko, D. (2014) Ionospheric Precursors of Earthquakes and Global Electric Circuit. Advances in Space Research, 53, 709-723. http://dx.doi.org/10.1016/j.asr.2013.12.035
- 4. Liperovskaya, E.V., Meister, C.-V., Pokhotelov, O.A., Parrot, M., Bogdanov, V.V. and Vasilieva, N.E. (2006) On Es-Spread Effects in the Ionosphere Connected to Earthquakes. Natural Hazards and Earth System Sciences, 6, 740-744. http://dx.doi.org/10.5194/nhess-6-741-2006
- 5. Liperovskaya, E.V., Silina, A.S., Liperovsky, V.A., Meister, C.-V., Hoffmann, D.H.H. and Biagi, P.-F. (2012) Midnight Variations of Es-Spread of the Ionosphere before Earthquakes. Annales of Geophysics, 55, 119-123.
- 6. Liperovskaya, E.V., Meister, C.-V., Hoffmann, D.H.H. and Silina. A.S. (2015) On Diurnal Dependence and Spatial Scales of Seismo-Ionospheric Effects in the E-Layer. Physics and Chemistry of the Earth, Parts A/B/C, in Press. http://dx.doi.org/10.1016/j.pce.2015.01.008
- 7. Liu, J.Y., Chuo, Y.J., Shan, S.J., Tsai, Y.B., Chen, Y.I., Pulinets, S.A. and Yu. S.B. (2004) Pre-Earthquake Ionospheric Anomalies Registered by Continuous GPS TEC Measurements. Annales Geophysicae, 22, 1585-1593. http://dx.doi.org/10.5194/angeo-22-1585-2004
- 8. Liu, J.Y. Chen, Y.I. Chuo, Y.J. and Chen. C.S. (2006) A Statistical Investigation of Preearthquake Ionospheric Anomaly. Journal of Geophysical Research, 111, A05354.
http://dx.doi.org/10.1029/2005JA011333 - 9. Ondoh, T. and Hayakawa, M. (1999) Anomalous Occurrence of Sporadic-E Layers before the Hyogoken Nanbu Earthquake, M7.2 of January 17, 1995. In: Hayakawa, M., Ed., Atmospheric and Ionospheric Electromagnetic Phenomena Associated with Earthquakes, TERRAPUB, Tokyo, 629-639.
- 10. Ondoh, T. and Hayakawa, M. (2006) Synthetic Study of Precursory Phenomena of the M7.2 Hyogoken Nanbu Earthquake. Physics and Chemistry of the Earth, Parts A/B/C, 31, 378-388.
http://dx.doi.org/10.1016/j.pce.2006.02.017 - 11. Ondoh, T. (2004) Anomalous Sporadic-E Ionization before a Great Earthquake. Advances in Space Research, 34, 1830-1835. http://dx.doi.org/10.1016/j.asr.2003.05.044
- 12. Chuo, Y.J., Liu, J.Y., Kamogawa, M. and Chen. Y.I. (2002) The Anomalies in the Prior to Taiwan Earthquakes. Seismo-Electromagnetics: Lithosphere-Atmosphere-Ionosphere Couplings, Hayakawa M., Molchanov O.A. (eds.), TERRAPUB, Tokyo, 309-312.
- 13. Liperovsky, V.A., Meister, C.-V., Liperovskaya, E.V., Vasil’eva, N.E. and Alimov, O.A. (2005) On Es-Spread Effects in the Ionosphere before Earthquakes. Natural Hazards and Earth System Sciences, 5, 59-62. http://dx.doi.org/10.5194/nhess-5-59-2005
- 14. Silina, A.S., Liperovskaya, E.V., Vasil'eva, N.E. and Alimov, O.A. (2010) The Influence of the Processes of Earthquakes Preparation on Variations of Parameters of the Ionosphere Sporadic E Layer. 5th International Conference on Solar-Terrestrial Relations and Physics of Earthquake Precursors, Paratunka, 2-7 August 2010, Collection of Reports, eds. Shevtsov B.V., Bogdanov V.V., Petropavlovsk-Kamchatsky; IKIR FEB RAS, 440-444.
- 15. Dobrovolsky, I.R., Zubkov, S.I. and Myachin, V.I. (1979) Estimation of the Size of Earthquake Preparation Zones. Pure and Applied Geophysics, 117, 1025-1044. http://dx.doi.org/10.1007/BF00876083
- 16. Whitehead, J.D. (1989) Recent Work on Mid-Latitude and Equatorial Sporadic E. Journal of Atmospheric and Terrestrial Physics, 51, 401-424. http://dx.doi.org/10.1016/0021-9169(89)90122-0