International Journal of Geosciences
Vol.5 No.8(2014), Article ID:48103,14 pages
DOI:10.4236/ijg.2014.58069
Soil Resources Information System for Improving Productivity Using Geo-Informatics Technology
Kartik M. Thakor1, Nishith Dharaiya1, Vijay Singh2, Ajay Patel2, Khalid Mehmood2, Manik H. Kalubarme2
1Department of Life Sciences, Hemchandracharya North Gujarat University, Patan, Gujarat, India
2Bhaskarcharya Institute for Space Applications and Geo-Informatics (BISAG), Department of Science & Technology Government of Gujarat, Gandhinagar, India
Email: kartikthakor7290@gmail.com, mhkalubarme@gmail.com
Copyright © 2014 by authors and Scientific Research Publishing Inc.
This work is licensed under the Creative Commons Attribution International License (CC BY).
http://creativecommons.org/licenses/by/4.0/


Received 28 February 2014; 24 March 2014; accepted 16 April 2014
ABSTRACT
Soil surveying and mapping is an important operation, since it plays a key role in the knowledge about soil nutrients, properties and how it can be used for agriculture. This study was carried out in order to map soil chemical properties and macronutrients status in North, Center and South districts zones of Gujarat state. Geographic Information System (GIS) was used in this study to present the secondary data of the soil which were obtained from Anand Agriculture University (AAU), Gujarat. The major objective of this study was to analyze & visualize the secondary data of soil through IDW, spatial interpolation techniques for suitable mapping in a selected North, Central and South districts of Gujarat state. Various maps showing spatial distribution of micronutrients and chemical properties for North, Center and South districts zones of Gujarat state were prepared. These digital maps can be used in precision farming studies with the application of fertilizers and micro-nutrients as per the requirement and the recommendations. This approach is proposed as a method for the evaluation of sustainable soil management practices such as variable rate of fertilization. This study demonstrates the usefulness of geo-informatics technology in soil survey as well as applications of various micronutrients to specific areas based on recommendations.
Keywords:Geographic Information System (GIS), Inverse Distance Weighted (IDW), Soil Survey, Chemical Properties, Macronutrients, Spatial Distribution

1. Introduction
Soils play a central role in the life and development of lands. They provide a vital substratum for people, animals, plants and micro-organisms. They are a key component of the ecosystems, in particular for water and nutrients cycling. In addition, they constitute a major genetical reservoir and are a place of major regulation and transformation processes. As a central element of the mountainous landscape, soils have always occupied a central position in the cultural and economic life of human communities.
As human population continue to increase, human disturbance of the earth’s ecosystem to produce food and fiber will place greater demand on soils to supply essential nutrients. The practice of intensive cropping with hybrid varieties for boosting food production caused decline in the level of some macronutrients in the soil at which productivity of crops cannot be sustained.
Soil surveying and mapping provide information regarding nutrient availability in soils which forms the basis for the fertilizer recommendations for maximizing crop yields. Soil fertility maps are meant for highlighting the nutrient needs, based on fertility status of soils (and adverse soil conditions which need improvement) to realize good crop yields. Obviously, a soil fertility map for a particular area can prove high benefit in guiding the farmers, manufacturers and planners in ascertaining the requirement of various fertilizers in a season/year and making projections for increased requirement based on cropping pattern and intensity.
Geographic information system (GIS) is a powerful set of tool for collecting, storing, retrieving at will, transforming and displaying spatial data from the real world. Advances in geographic information systems, remote and real data collection, can help define the problem, however, improvements in fertilizer technology and cost effective application strategies will ultimately be needed if the situation is to be corrected. In the field of soil, GIS technology has opened newer possibilities of improving soil statistic system as it offers accelerated, repetitive, spatial and temporal synoptic view. GIS can be used in producing a soil fertility map of an area, which will help in formulating site-specific balanced fertilizer recommendation and to understanding the status of soil fertility spatially and temporally.
A systematic set of geo-referenced samples was collected from the Muktsar district covering the entire area using GPS (Global positioning system) and the maps showing the spatial variability of individual micronutrient cation (Zn, Cu, Mn and Fe) were generated using Arc Info GIS (Geographic information system). The multi-micronutrient status map was also generated by integrating the individual micronutrient cation map in GIS [1] . Micronutrient deficiency in soil has become widely spread in recent years which have resulted in low crop yields. This situation has aggravated after the introduction of high yielding crop varieties coupled with the use of high amounts of fertilizers and increased cropping intensity [2] .
Mapping of DTPA-extractable micro nutrients were carried out by randomly collecting geo-referenced surface (0 - 0.15 m) soil samples representing different soils (as per soil map prepared on 1:50,000 scale) from 645 sites in Amritsar district (Northwest Punjab, India) using Global Positioning System (GPS) at flag leaf stage of wheat (Triticum aestivum L). Soil micronutrient maps prepared in ArcInfo GIS clearly delineated the specific locales where micronutrient problem constrained crop production [3] . The deficiencies of Mn, Cu, and Zn are mainly reported on sandy soils that are low in organic matter [4] . Spatial variability in soil is important to identify the nutrient constraint zones, vis-à-vis production zones to rationalize the nutrient use. The precision agriculture, therefore, largely depends upon the management of spatial variability in soil fertility which is a major production constraint [5] .
Geographic information system (GIS) is a powerful information technology for analysis and management of spatial data and mapping. Remote Sensing (RS) to identify and Global Positioning Systems (GPS) to locate and define spatial features or activities contribute to the quality of site-specific practices. Advances in software aided decision support systems (DSS) like DRIS and GIS, have led to usage of newer interpretation tools having wider application potential [6] .
2. Study Area
For measurement of spatial variability and mapping of soil chemical properties and macronutrients; three districts in each North, Center and South zones of Gujarat state have been selected: 1) North district zone: Patan, Mehsana, Sabarkantha; 2) Center district zone: Ahmadabad, Kheda, Panchmahals; 3) South district zone: Anand, Vadodara and Bharuch (Figure 1).
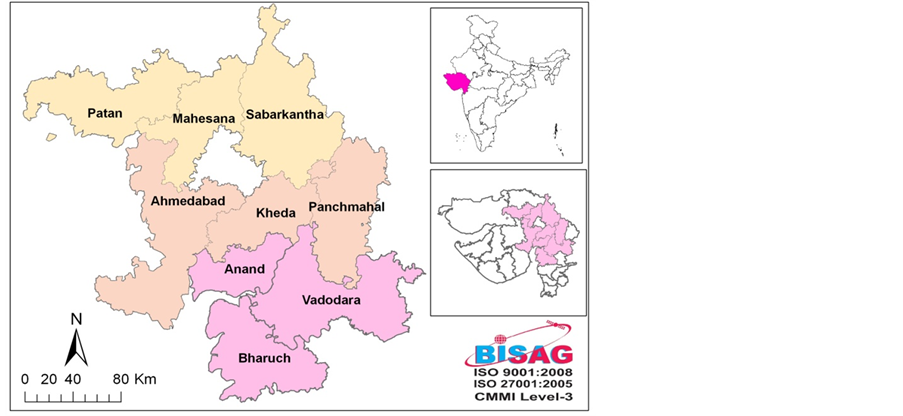
Figure 1. Location map of study area.
3. Objectives
The major objectives of this study are as follows:
1) Collecting the secondary data of Soil chemical properties (pH, EC, OC) and macronutrients (N, P2O5, K2O, S).
2) Analyze & visualize the secondary data of soil through IDW, interpolation techniques for suitable mapping in a selected North, Central and South districts of Gujarat state.
3) Generation of Inverse Distance Weighting (IDW) using GIS based interpolation technique to analyze the distribution of nutrient variability.
4) To assess the spatial distribution of relevant chemical properties and macronutrients in agricultural soils across selected three district zones of Gujarat State.
5) Assessing the spatial variability of chemical properties and macronutrients at the basic process level using geo-statistical analysis for nutrients and other soil management options.
6) Enhancing farm profitability by optimizing nutrient recommendations on the basis of fertility maps and socio-economic specificity of the farms and farmers, respectively, in a precision agriculture mode.
4. Materials and Methods
This section describes the technical procedures followed in the GIS analyses and mapping of soil chemical properties (pH, EC, OC), macronutrients (N, P2O5, K2O, S) across the North, Center and South district zones of Gujarat state. The soils chemical properties and macronutrients datasets were obtained from Anand Agriculture University (AAU) in spreadsheet (Excel) format. The data is of 2012 and it covers total 9 districts of North, Center and South district zones of Gujarat state. The datasets underwent several preparation, conversion, interpolation, processing and analyses steps in spreadsheet and GIS formats.
4.1. Generation of Thematic Maps
Thematic maps were generated for each of the soils chemical properties and macronutrients using Inverse Distance Weighted (IDW) interpolation provided in Arc GIS 10 software. IDW interpolation determines cell values using a linearly weighted combination of a set of sample points. The weight is a function of inverse distance. IDW lets the user control the significance of known points on the interpolated values based on their distance from the output point.
4.2. Geo-Statistical Analysis
After generation of thematic maps perform Geo-statistical Analysis using Geo-statistical Analyst toolbar for finding the minimum, maximum and average value of Soil chemical properties and macronutrients across North, Center and South districts zone of Gujarat state.
5. Results and Discussions
5.1. Chemical Properties of Soils across North, Center and South District Zones of Gujarat State
The chemical properties of in terms of pH, Electrical Conductivity (EC) and Organic Carbon (OC) were analyzed for all the districts in each zone and are given in Table1
Based on the analysis of chemical properties of soils of districts in ach zones, they were classified in to three ratings as given in Table2
5.1.1. Status of Soil pH
The pH of investigated soils varied from 6.9 to 8.5 in north districts zone with an average value of 7.25, while in center districts zone the pH of investigated soils varied from 6 to 8.9 with an average value of 7.9 and in south districts zone the pH of investigated soils varied from 6.2 to 9 with an average value of 7.9 considering the soils across the North, Center and South district zones of Gujarat state are medium alkaline in nature. The spatial distribution maps generated using IDW, interpolation technique for districts in three zones are given in Figures 2-4.
From the spatial distribution maps the pH status in different districts in three zones is summarized in three cat egories like minimum, maximum and mean values (Figure 5).
5.1.2. Electrical Conductivity (EC) Status
The electrical conductivity (EC) gives an indication about salt concentration of soil and it varied from 0.1 to 1.5 dS·m−1 with an average value of 0.4 dS·m−1 in north districts zone while in center districts zone the electrical conductivity (EC) is varied from 0.14 to 1.39 dS·m−1 with an average value of 0.45 dS·m−1 and in south districts zone the electrical conductivity (EC) is varied from 0.1 to 0.9 dS·m−1 with an average value of 0.3 dS·m−1

Table 1. Chemical properties status of soil across North, Center and South districts zones of Gujarat state.
Table 2. Rating for classification of soil chemical properties.
(Source: http://www.gsfclimited.com/).
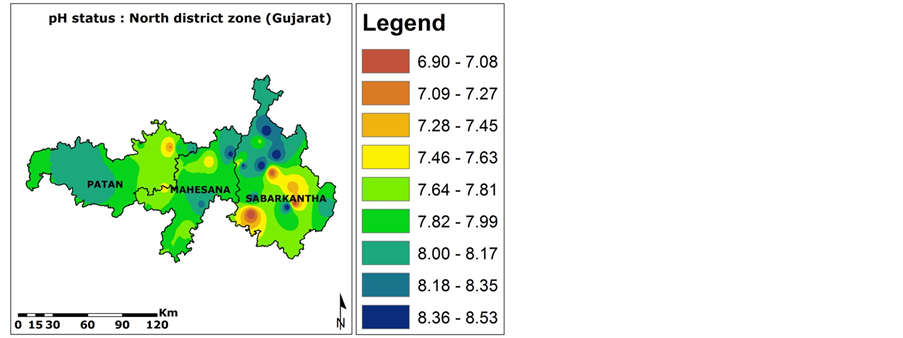
Figure 2. pH status & spatial distribution in North district zone.
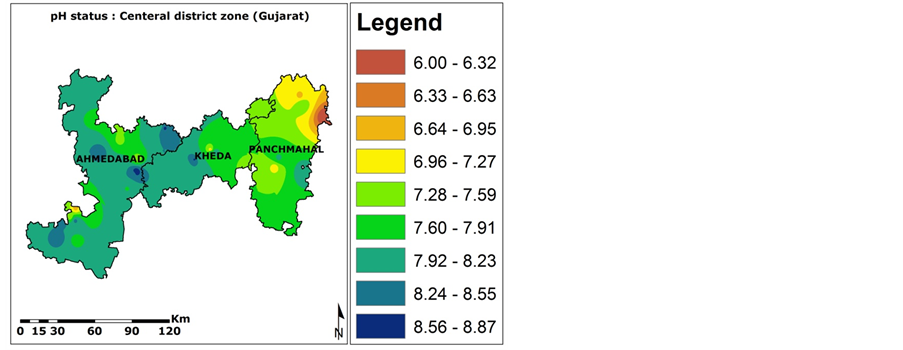
Figure 3. pH status & spatial distribution in Center district zone.
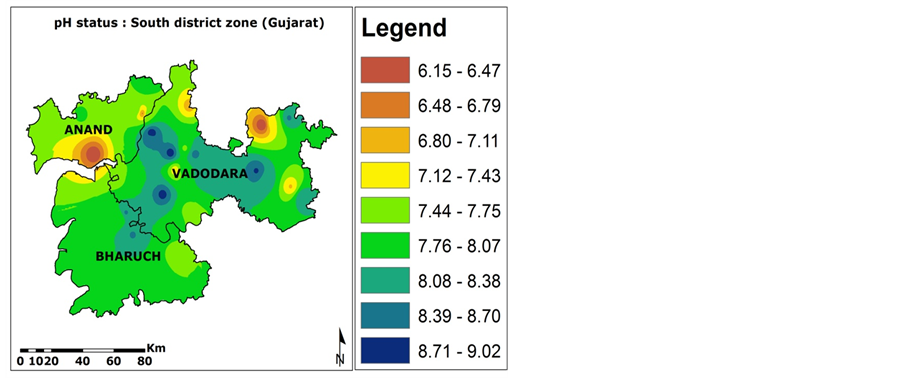
Figure 4. pH status & spatial distribution in South district zone.
considering that soils across the North, Center and South districts zone of Gujarat state have low level salt concentration of soil. The spatial distribution maps of Electrical Conductivity (EC) status generated using IDW, interpolation technique for districts in three zones are given in Figures 6-8.
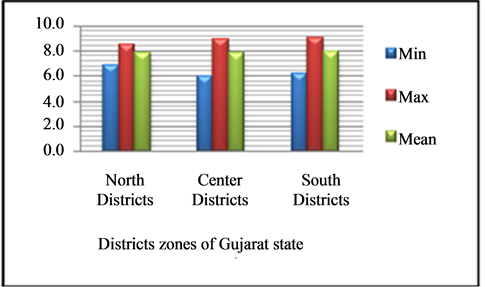
Figure 5. Variability status of pH across North, Central and South district zone of Gujarat state.
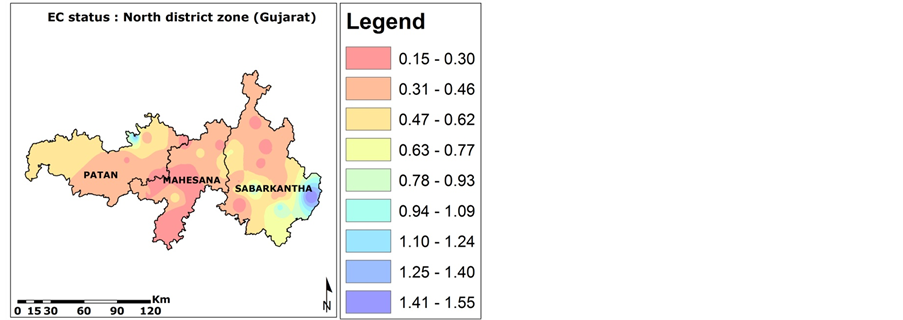
Figure 6. EC status & spatial distribution in North district zone.
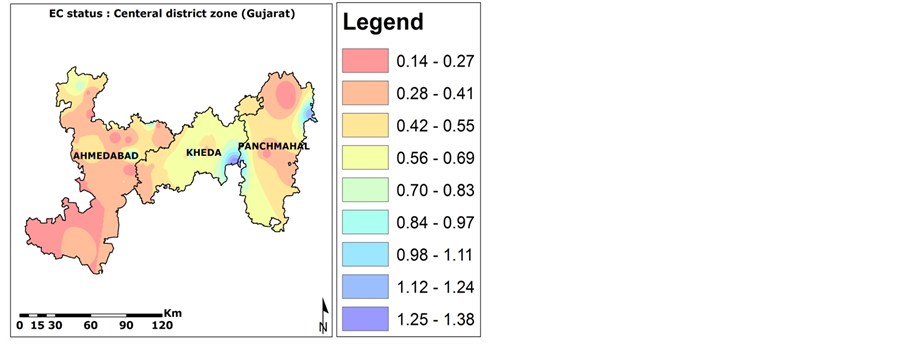
Figure 7. EC status & spatial distribution in Center district zone.
5.1.3. Available Organic Carbon (OC) Status
The available organic carbon (OC) of soils in North districts zone ranged between 0.11% to 0.67% with an average value of 0.41% while the organic carbon (OC) of soils in center districts zone ranged between 0.18% to 0.57% with an average value of 0.39% and in South districts zone the available organic carbon (OC) of soils is ranged between 0.14% to 0.71% with an average value of 0.44% considering the soil across the North, Center and South districts zone of Gujarat have low amount of available organic carbon. The spatial distribution maps of Organic Carbon (OC) status generated using IDW, interpolation technique for districts in three zones are given in Figures 9-11.
Recommendation: It is recommended to give Farm Yard Manure (FYM), organic manure or vermin compost across North, Center and South district zone of Gujarat state.
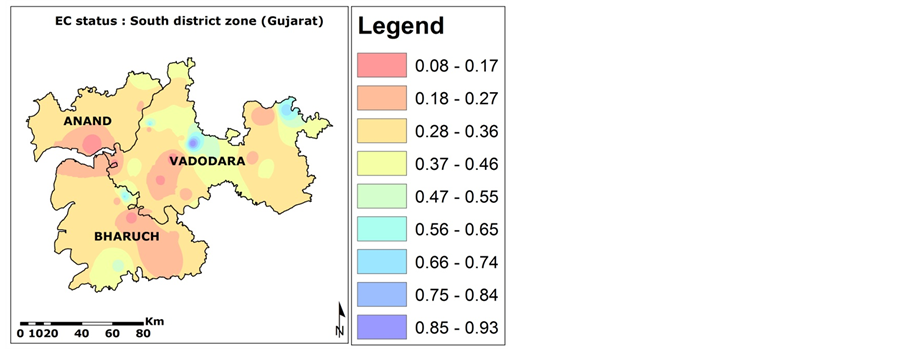
Figure 8. EC status & spatial distribution in South district zone.
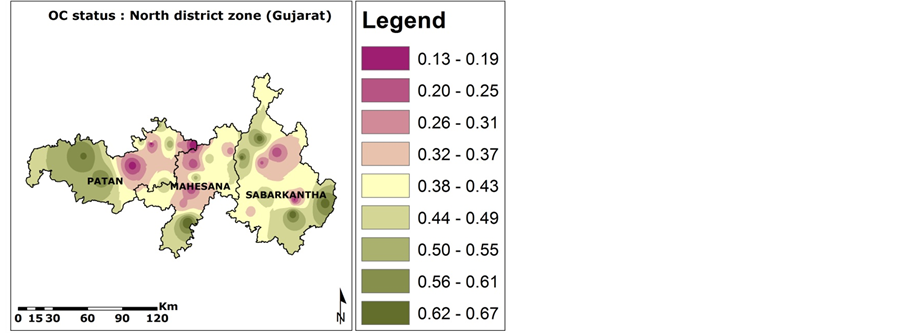
Figure 9. OC status & spatial distribution in North district zone.
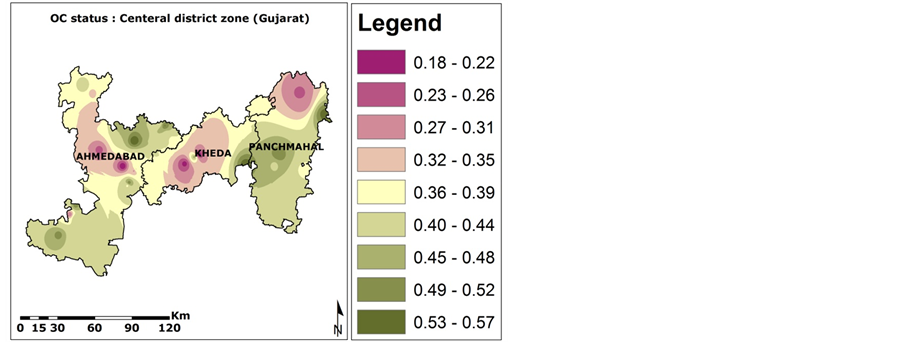
Figure 10. OC status & spatial distribution in Center district zone.
From the spatial distribution maps the OC status in different districts in three zones is summarized in three categories like minimum, maximum and mean values (Figure 12). The available organic carbon (OC) status of soils in South districts zone is higher as compared to other two zones.
5.2. Macronutrient Status of Soil across North, Center and South District Zones of Gujarat State
The macronutrient Nitrogen, Phosporous, Potash and Sulfur status in different districts of three zones were analyzed from the data are given in Table3
The data of macronutrient status was analyzed to compute the ratings in terms of low, medium and high in different zones (Table 4).
5.2.1. Available Nitrogen Status
The available N of soils in the north district ranged between 88 to 220 kg·ha−1 with a mean value of 161 kg·ha−1 while in center districts zone the available N is ranged between 63 to 251 kg·ha−1 with a mean value of 143 kg·ha−1 and in south districts zone available N is ranged between 94 to 251 kg·ha−1 with a mean value of 163 kg·ha−1 considering the soils across the North, Center and South districts zone of Gujarat have lack of available nitrogen. The spatial distribution maps of Nitrogen status generated using IDW, interpolation technique for districts in three zones are given in Figures 13-15.
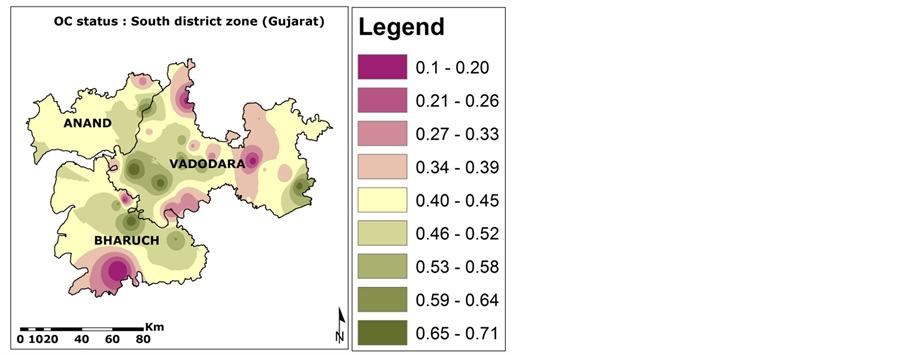
Figure 11. OC status & spatial distribution in South district zone.
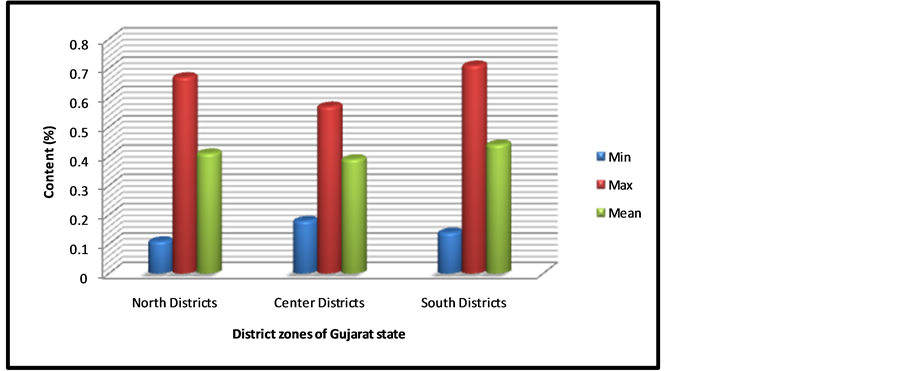
Figure 12. Variability status of Organic Carbon (OC) across North, Central and South district zone of Gujarat state.
Table 3. Macronutrients status of soil across North, Center and South districts zone of Gujarat state.
Table 4. Rating for classification of soil macronutrients test values.
(Source: http://www.gsfclimited.com/).
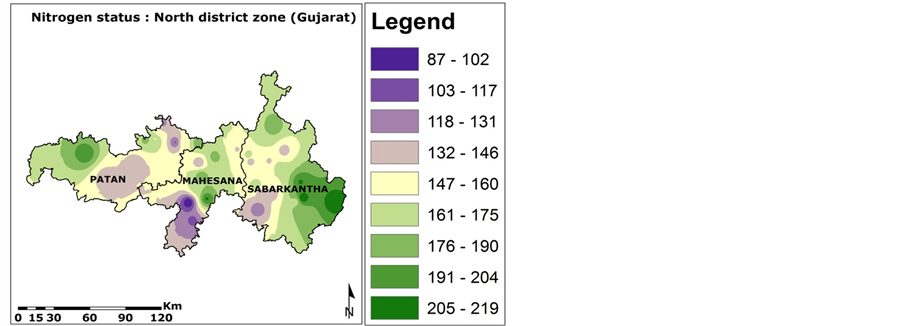
Figure 13. Nitrogen status & spatial distribution in North district zone.

Figure 14. Nitrogen status & spatial distribution in Center district zone.
Recommendation: It is recommended to apply 25% to 30% more nitrogen (N) containing fertilizers; for the crops grown across North, Center and South district zone of Gujarat state.
5.2.2. Available Phosphorus Status
The available P content of soils in the north district varied from 16 to 112 kg·ha−1 averaging to 50 kg·ha−1 for all the soil samples tested considering the soils across the North districts zone of Gujarat have optimum availability of phosphorus content while in center districts zone the available P content of soils varied from 18 to 163 kg·ha−1 averaging to 59 kg·ha−1 and in south districts zone available P content of soils varied from 30 to 186 kg·ha−1 averaging to 67 kg·ha−1 considering the soils across the Center and South districts zone of Gujarat have high availability of phosphorus content. The spatial distribution maps of Phosphorus status generated using IDW, interpolation technique for districts in three zones are given in Figures 16-18.
Recommendation: It is recommended to apply 15% to 20% less phosphorus (P) containing fertilizers; to the crops grown across Center and South district zone of Gujarat state.
5.2.3. Available Potassium Status
The available K content of soils in the north district ranged from 116 to 1081 kg·ha−1 with a mean value of 331 kg·ha−1 while in Center districts zone the available K content ranged from 208 to 1082 kg·ha−1 with a mean value of 460 kg·ha−1 and in south districts zone available K content ranged from 109 to 1022 kg·ha−1 with a mean value of 488 kg·ha−1 considering the soil across the North, Center and south districts zone of Gujarat have
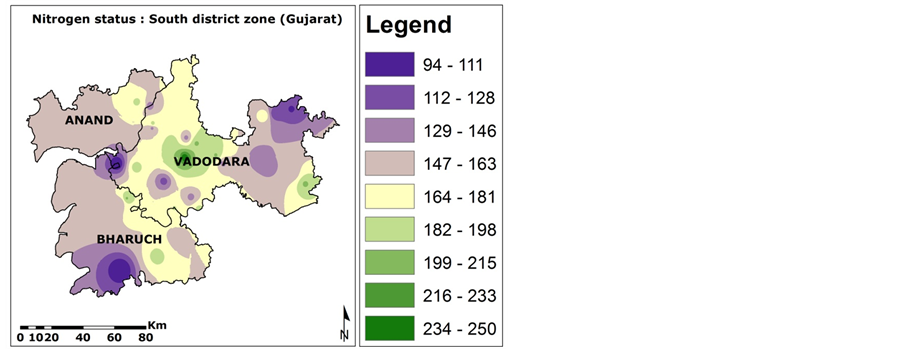
Figure 15. Nitrogen status & spatial distribution in South district zone.
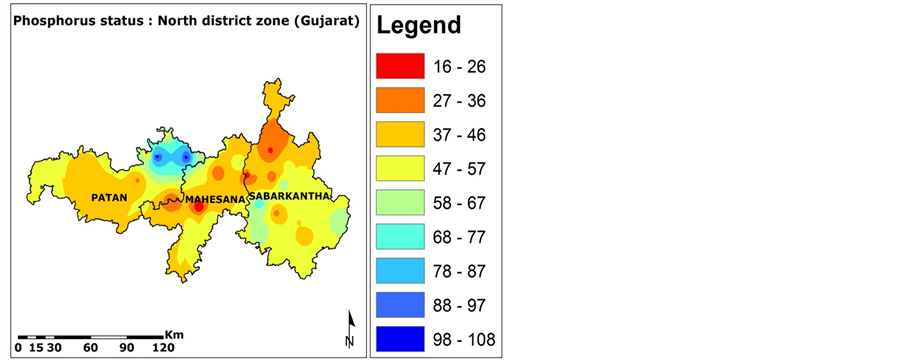
Figure 16. P status & spatial distribution in North district zone.
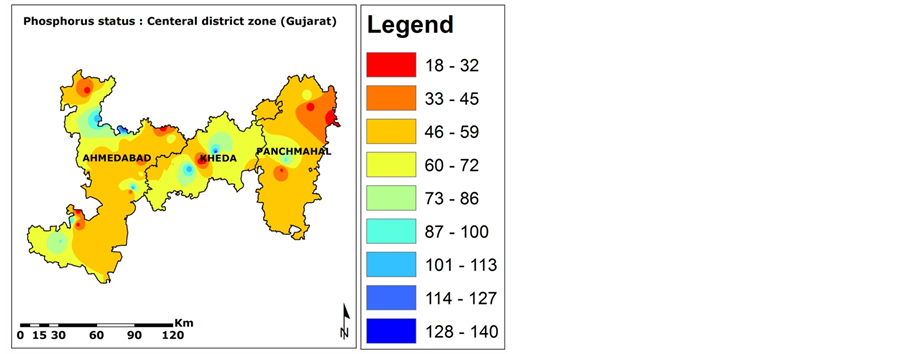
Figure 17. Phosphorus status & spatial distribution in Center district zone.
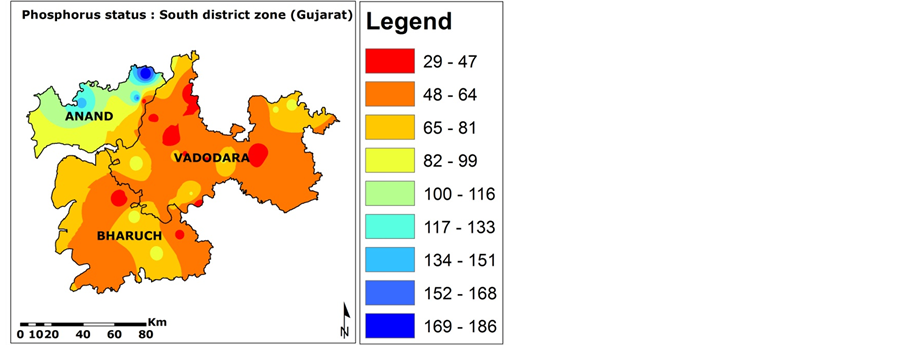
Figure 18. Phosphorus status & spatial distribution in South district zone.
excessive amount of available potassium. The spatial distribution maps of Potassium status generated using IDW, interpolation technique for districts in three zones are given in Figures 19-21.
5.2.4. Available Sulphur Status
The available Sulphur (S) content in the soil varied from 4 to 35 ppm with an average value of 16 ppm while in center districts zone the available S content in the soil varied from 3 to 62 ppm with an average value of 12 ppm and in south districts zone the available S content in the soil varied from 1 to 52 ppm with an average value of 14 ppm considering the soil across the North, Center and South districts zone of Gujarat have optimum amount of available sulphur. The spatial distribution maps of Sulphur status generated using IDW, interpolation technique for districts in three zones are given in Figures 22-24.
Recommendation: It’s favorable to mix 500 kg·ha−1 gypsum in the soil or use sulphur (S) containing fertilizers like sulphate or ammonium sulphate to the crops grown across North, Center and South district zone of Gujarat state.
6. Conclusions
The results of this study refer to the effective role that can be played by GIS, especially in the spatial distribution mapping using IDW interpolation technique for producing thematic maps of chemical properties and macronutrients in the soils of North, Center and South district zone of Gujarat state. Spatial distribution maps generated
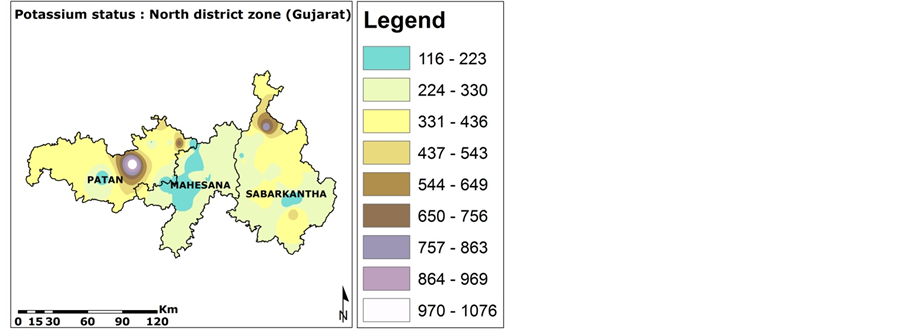
Figure 19. Potassium status & spatial distribution in North district zone.
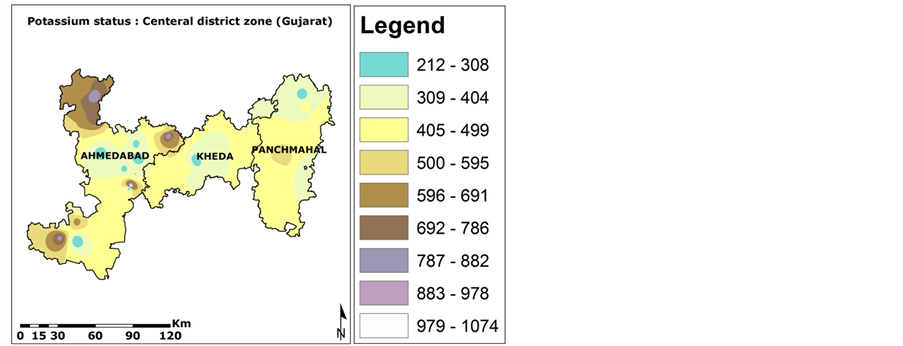
Figure 20. Potassium status & spatial distribution in Center district zone.
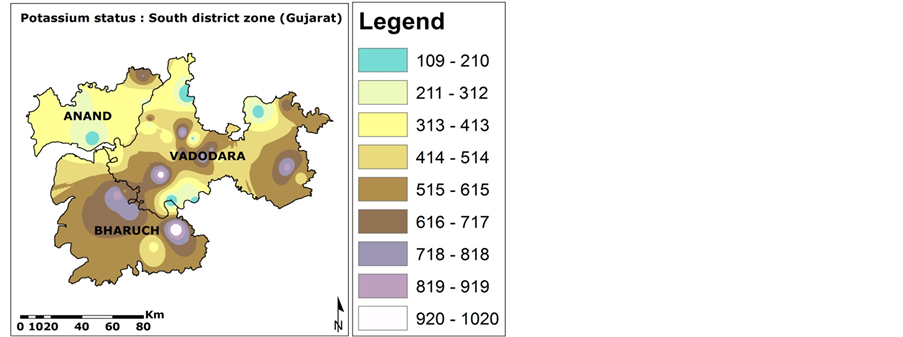
Figure 21. Potassium status & spatial distribution in South district zone.
under the study will be useful for guiding the farmers to decide the amount and kind of nutrients to be applied for economic returns based on site-specific nutrient management.
It also prioritizes the talukas of district which needs immediate attention for achieving the optimum crop
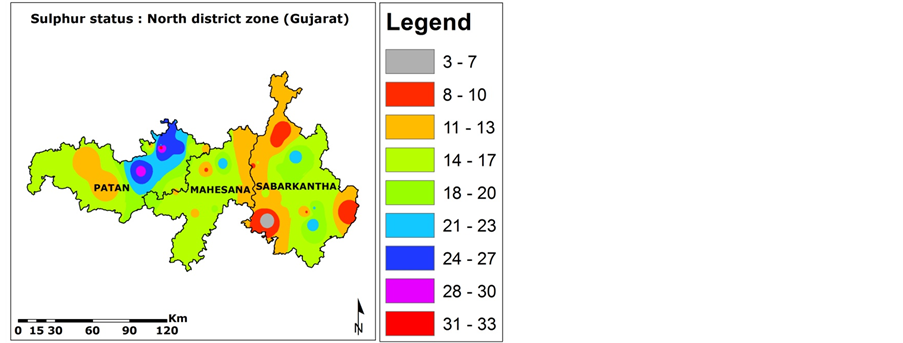
Figure 22. Sulphur status & spatial distribution in North district zone.
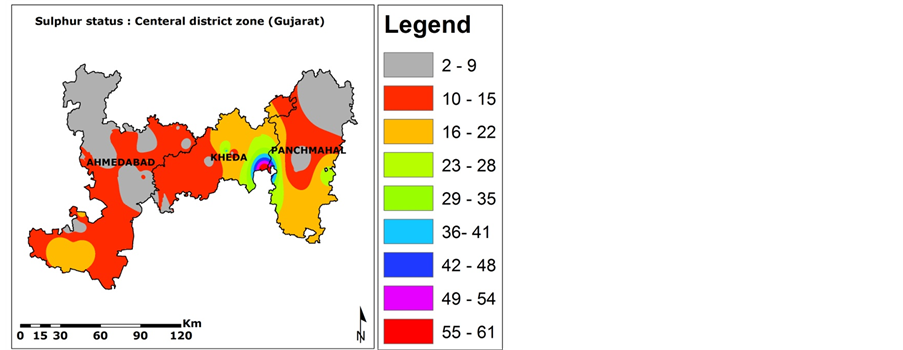
Figure 23. Sulphur status & spatial distribution in Center district zone.
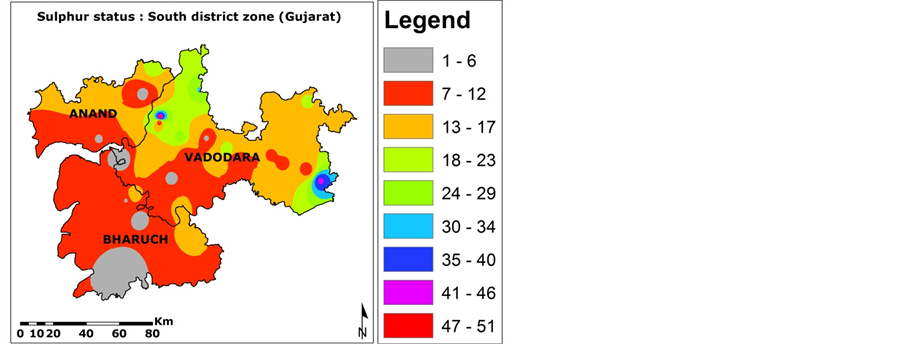
Figure 24. Sulphur status & spatial distribution in South district zone.
yields. Geo-statistical analysis estimates an average status of chemical properties and nutrients in the soil of study area. Both the spatial distribution maps and geo-statistical analysis reflect on spatial variability of chemical properties and nutrients in the soils of North, Center and South district zones of Gujarat state. This study also brings out the recommendations of macro nutrients based on the status of deficiency or based on the requirements of the crops based on the soil characteristics.
Acknowledgments
The authors express their sincere thanks to Shri T. P. Singh, Director, Bhaskarcharya Institute for Space Applications and Geo-informatics (BISAG), Department of Science & Technology, Government of Gujarat, Gandhinagar for his encouragement to conduct this study. We are also thankful to Anand Agriculture University (AAU), Gujarat for providing data of the soil micro and macro-nutrients for various districts in North, Central and South zones of Gujarat State.
The first author is also thankful to Dr. S.A. Bhatt, Professor & Head, Department of Life Sciences, Hemchandracharya North Gujarat University, Patan for his kind encouragement to undertake project at BISAG, Gandhinagar.
References
- Sood A., Sharma, P.K., Tur, N.S. and Nayyar, V.K. (2009) Micronutrient Status and Their Spatial Variability in Soils of Muktsar District of Punjab—A GIS Approach. Journal of the Indian Society of Soil Science, 57, 300-306.
- Wani, M.A., Zahid, Mushtaq, Shaista, and Nazir (2010) Mapping of Micronutrients of the Submerged Rice Soils of Kashmir. Research Journal of Agricultural Sciences, 1, 458-462.
- Sharma, P.K., Sood, A., Setia, R.K., Tur, N.S., Mehra, D. and Singh, H. (2008) Mapping of Macronutrients in Soils of Amritsar District (Punjab)—A GIS Approach. Journal of the Indian Society of Soil Science, 56, 34-41.
- Verma, V.K., Setia, R.K., Sharma, P.K., Charanjit, S. and Ashok, K. (2005) Pedospheric Variations in Distribution of DTPA—Extractable Micronutrients in Soils Developed on Different Physiographic Units in Central Parts of Punjab, India. International Journal of Agriculture and Biology, 7, 243-247.
- Srivastava, A.K., Singh, Shyam and Das, S.N. (2010) Nutrient Optima-Based Productivity Zonality Delineation in Citrus Orchards of Northeast India. 19th World Congress of Soil Science, Soil Solutions for a Changing World, Brisbane, 1-6 August 2010.
- Zaman, Q.U. and Schumann, A.W. (2006) Nutrient Management Zones for Citrus Based on Variation in Soil Properties and Tree Performance. Precision Agriculture, 7, 45-63. http://dx.doi.org/10.1007/s11119-005-6789-z