International Journal of Geosciences
Vol.4 No.8(2013), Article ID:37989,11 pages DOI:10.4236/ijg.2013.48106
Size Analysis of the Late Pliocene-Early Pleistocene Upper Siwalik Sediments, Northwestern Himalaya, India
Department of Geology, Kurukshetra University, Kurukshetra, India
Email: archaudhri@gmail.com, 07mahavir@gmail.com
Copyright © 2013 Mahavir Singh, A. R. Chaudhri. This is an open access article distributed under the Creative Commons Attribution License, which permits unrestricted use, distribution, and reproduction in any medium, provided the original work is properly cited.
Received July 20, 2013; revised August 22, 2013; accepted September 23, 2013
Keywords: Texture; Siwalik; Pinjor; Himalaya
ABSTRACT
Size analysis of the Late Pliocene-Early Pleistocene Upper Siwalik sediments comprising the Pinjor Formation in the type area and adjoining regions reveals that the sediments are bimodal to polymodal in nature, medium to fine grained and are moderately sorted. The inclusive graphic standard deviation and moment standard deviation values suggest the deposition of sediments in shallow to moderately deep fluvial agitated water. The log probability plots reveal that saltation mode is the dominant mode of transportation of detritus. The sediments are continental in character and are derived from crystalline, metamorphic and sedimentary rocks of the Himalaya exposed to the North of the type area Pinjor.
1. Introduction
Textural analysis or size analysis is the quantitative determination of size frequency distribution. Size analysis is helpful in working out the nature of the parent rock, mode, distance of transport of the detritus, paleoenvironmental and paleotectonic set up of the positive and negative areas, energy conditions of the medium, rate of supply of the sediments and post-depositional changes experienced by the sediments.
The Himalaya, a product of continent-continent collision, represents the youngest active mountain range of the world. The Himalayan orogenic belt has been divided into the Frontal Himalaya, the Lesser Himalaya and the Great Himalayan belt. The frontal Himalayan belt is made up of low lying Siwalik Hills. The Siwalik Group is exposed in a linear fashion along the Himalayan foothills for a distance of about 2400 Km. from near Jammu in the West to near Tripura in the East. It represents a huge thickness of sediments ranging from 3300 m to 6300 m [1], which were deposited in a foredeep. The Late Pliocene-Early Pleistocene Pinjor Formation (1.7 Ma - 2.5 Ma) of Upper Siwalik Subgroup is very well exposed in the type area Pinjor and surrounding regions (Figure 1). The Pinjor Formation (Matuyama magnetic chron) in the type Area Pinjor has been divided into three members namely the Kona Clay Member (94 m - 324 m), the Tanda Bhagwanpur Wacke Member (309 m - 917 m)
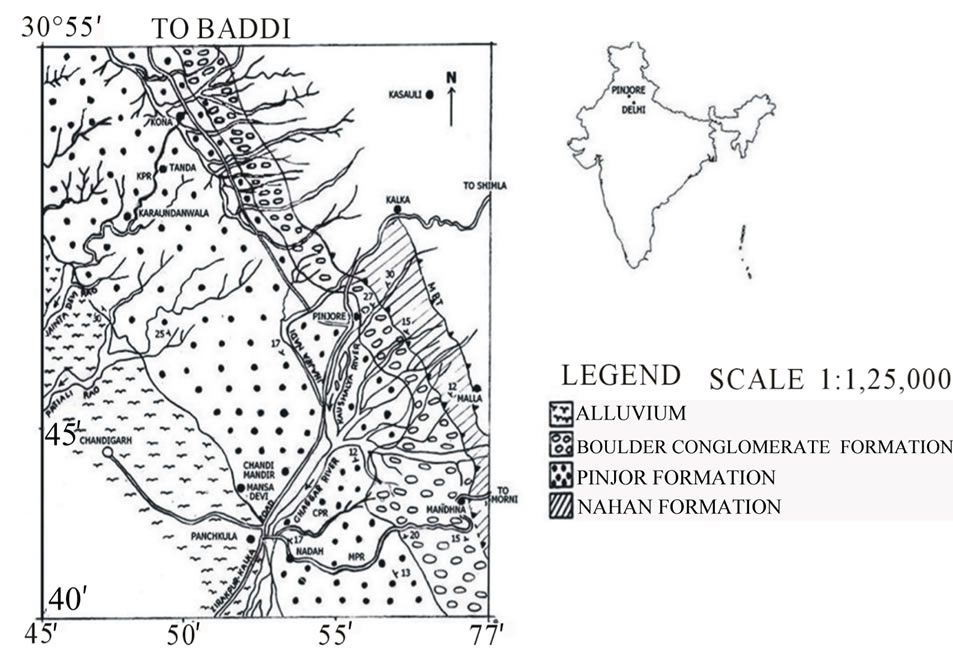
Figure 1. Geological map of the Pinjor formation in the type area Pinjor and surrounding regions.
and the Chauki Nadah Pebbly Bed Member (394 m - 670 m) [2]. The Formation attains a thickness of 703 m to 1800 m. It overlies the Tatrot Formation (2.5 Ma - 5.6 Ma) and is underlain by the Boulder Conglomerate Formation (0.7 Ma - 1.7 Ma). The Formation has a conformable gradational contact with underlying and overlying formations.
Lithologically, the Pinjor Formation comprises poorly to moderately indurated pale grey to light brown, medium to coarse grained pebbly sandstones and pale brown to dark brown sandy clays. Chaudhri [1] recorded that the Siwalik sediments are a product of two coarsening up mega cycles. The Lower Siwalik/Nahan Formation represents the first mega cycle. It recorded a slow pace of erosion and sedimentation and stable paleotectonic conditions. The Middle and the Upper Siwalik formations characterized by coarsening of the sediments represent the second mega cycle indicating a fast rate of degradation processes.
In this paper, an attempt has been made to work out the size characteristics of the Late Pliocene-Early Pleistocene Upper Siwalik sediments with a view to comprehend the provenance and sedimentation environment of the detritus constituting the Pinjor sediments of the type area and adjoining regions. During the last decade, the sedimentology of the Siwalik Group has been examined by [1,3-11] and others.
2. Analytical Techniques
Sieve technique has been utilized for size determination of the sediments constituting the Pinjor Formation. The Pinjor Formation in the type area Pinjor and surrounding regions is dominantly made up of poorly indurated, friable to unconsolidated, intercalated sequence of clays and sandstones. The individual grains of wacke are separable without affecting their original size and shape. The granulometric analysis of sand sized fraction was carried out by sieve technique. The method has an edge over other methods as the results are in weight percentage frequency which is a better representation of natural process than number percentage frequency. The method is rapid and involves arrangements of sieves at half or quarter Phi interval depending upon the character of the sediments to be analyzed.
After preliminary examination of the thin section of samples from different lithological units of the Pinjor formation, 67 representative samples from the three measured sections namely the Berwala-Mandhna section, the Kona-Karaundanwala section and the Ghaggar RiverChauki Nadah section and random samples were selected for textural analysis. The major criteria for the selection of the samples were the variation in grain size as the objective was to obtain a comprehensive picture of the Pinjor Formation.
The size analysis of loose sand sediments was carried out by sieve technique. About 100 gram of the representative sample collected after coning and quartering was subjected to sieving at quarter phi interval. The ASTM sieves were placed in a Ro-Tap sieve shaker and were allowed to move for 30 minutes. The sand fraction retained in each of the sieves was collected and weighted on an electronic balance. The various size classes were made and weight percentage frequency distribution and cumulative weight percentage frequency distribution were computed at quarter phi interval. Frequency curves, cumulative curves, log probability plots, CM diagrams and binary plots were prepared to work out the various parameters. Graphic measures [12] and moment measures [13] were computed.
3. Statistical Size Distribution Pattern
3.1. Mode
The sediments of the Pinjor Formation are bimodal to poly-modal in nature (Figures 2 and 3). Lithologically, the matrix of conglomeratic bed shows a dominant medium sand grains mode (1.25 Phi) in the BerwalaMandhna Section and a fine sand grain (2.00 Phi) mode in the Ghaggar River-Chauki Nadah Section and the Kona-Karaundanwala Section.
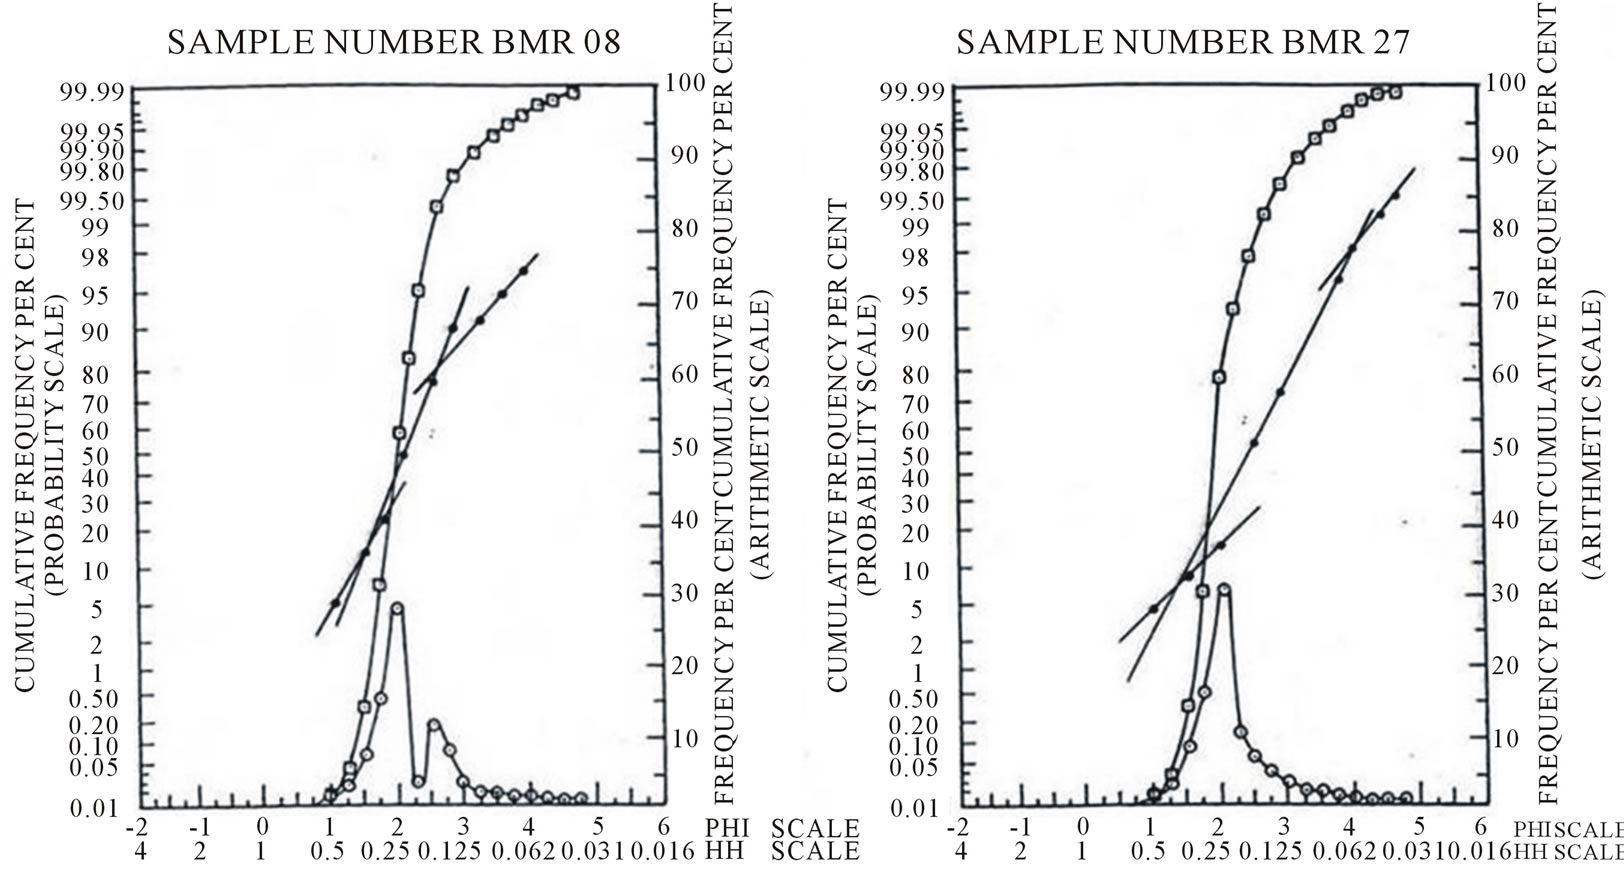
Figure 2. Frequency curves, cumulative curves and log probability plots of the selected samples of the Pinjor sediments.
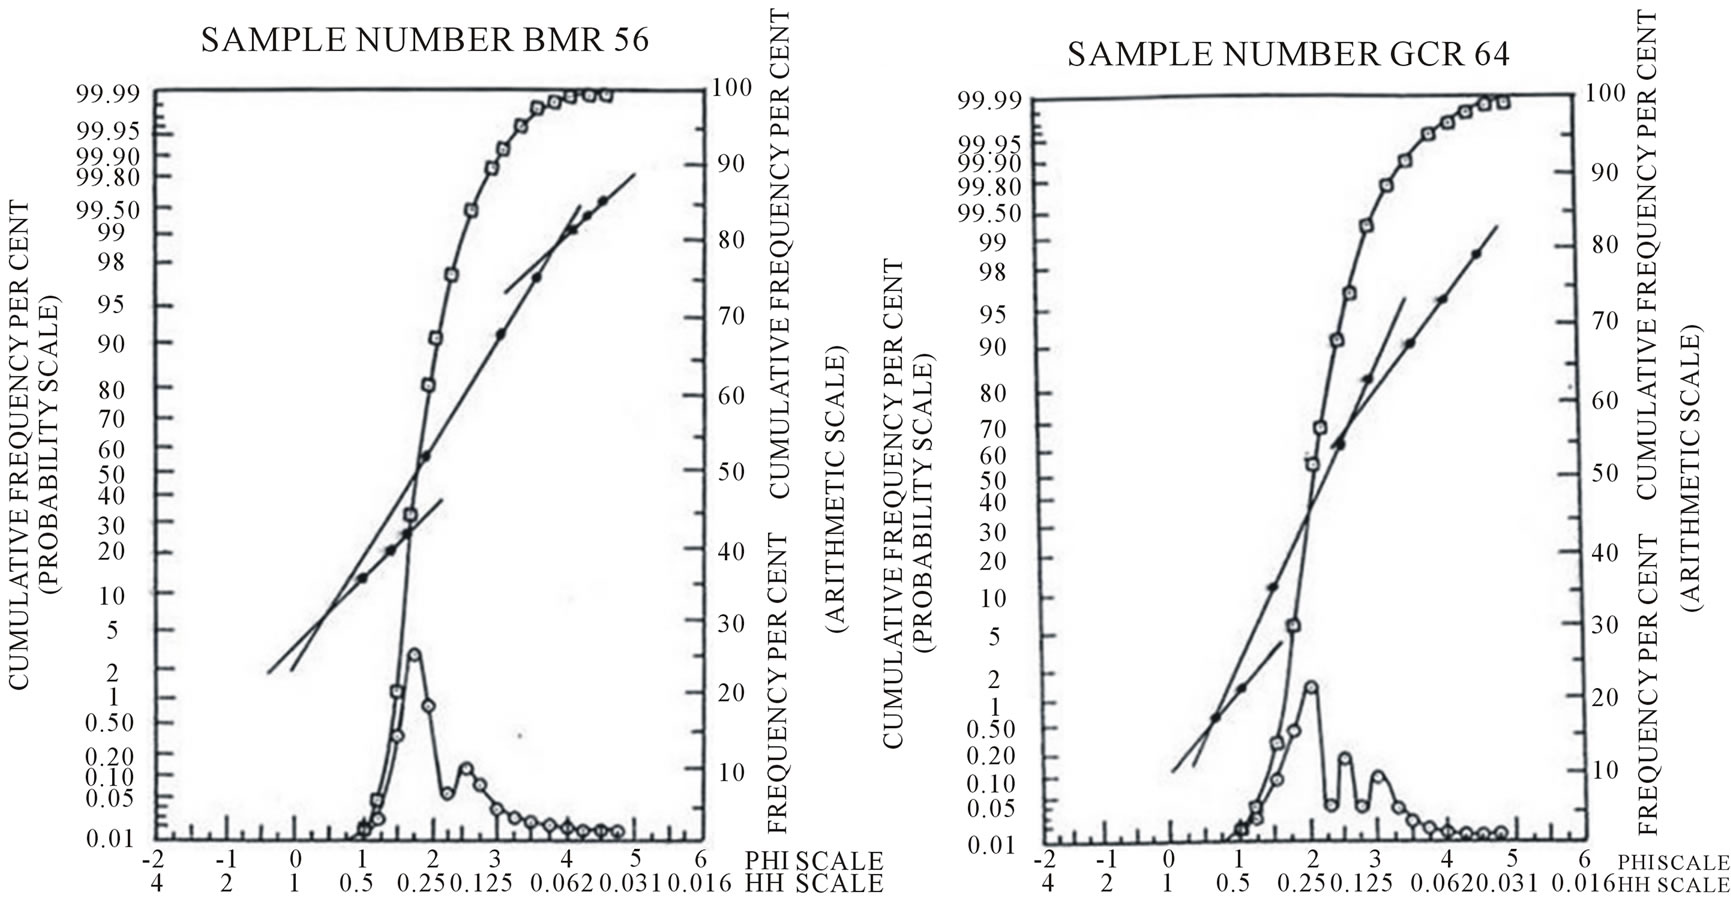
Figure 3. Frequency curves, cumulative curves and log probability plots of the selected samples of the Pinjor sediments.
In wacke with ferruginous matter, the value of mode varies from 1.75 Phi to 2.25 Phi in the Berwala-Mandhna Section; and remains 2.00 Phi in Ghaggar River-Chauki Nadah Section and the Kona-Karaundanwala Section. One of the samples collected randomly has a mode value of 1.25 Phi. The values of mode in wacke with ferruginous matter in different sections indicate dominance of medium to fine grained sand. In wacke with calcareous matter, the value of mode is 2.00 Phi in Berwala-Mandhna Section and 2.25 Phi in the Ghaggar River-Chauki Nadah Section and in the Kona-Karaundanwala Section. In random samples this value reaches 2.75 Phi, again indicating dominance of medium to fine sand size grains in the sediments.
In lithic wacke of the Berwala-Mandhna Section, the value of mode ranges from 1.00 Phi to 2.75 Phi. In the Ghaggar River-Chauki Nadah Section the value of mode varies from 1.25 Phi to 2.50 Phi. In Kona-Karaundanwala Section the value varies from 1.75 Phi to 2.75 Phi.
In the wackes, the value of mode ranges from 1.25 Phi to 2.25 Phi in the Berwala-Mandhna Section. A similar modal range is recorded in the Ghaggar River-Chauki Nadah Section where there is dominance of medium to fine sand. In the Kona-Karaundanwala Section, the mode value ranges from 1.50 Phi to 2.75 Phi with a marked dominance of fine sand size grade. The mode values in different lithological units of the Pinjor Formation indicate dominance of medium to fine grained sand.
3.2. Median
The median values of the matrix of conglomeratic beds ranges from 1.50 Phi to 2.25 Phi in measured section of the Pinjor Formation indicating the presence of medium to fine grained sand. The values of median in wackes with ferruginous matter from Berwala-Mandhna Section ranges from 1.80 Phi to 2.25 Phi reflecting the presence of medium to fine grained sand. In the Ghaggar RiverChauki Nadah Section and Kona-Karaundanwala Section, these values range from 2.00 Phi to 2.25 Phi again indicating the presence of fine grain sand. The median values in all the three section in wackes with calcareous matter do not show any appreciable difference.
In the lithic wackes these value ranges from 1.75 Phi to 2.60 Phi, in all the three sections. The Ghaggar RiverChauki Nadah Section and the Kona-Karaundanwala Section exhibit a dominance of fine sized sand grains over the Berwala-Mandhna Section.
In wackes, the median values varies from 1.40 Phi to 2.50 Phi in all the three sections and random samples with the exception of one sample (KKR 28) where the value of median reaches 3.00 Phi. In general, the value of median in the Kona-Karaundanwala Section indicates an increased presence of fine sand grade.
3.3. Mean
The values of graphic mean and moment mean are nearly identical. In the Berwala-Mandhna Section, the value of graphic mean of the matrix of conglomeratic beds is 1.72 Phi and moment mean is 1.80 Phi. In the Ghaggar RiverChauki Nadah Section and the Kona-Karaundanwala Section, the values of graphic mean are 2.12 Phi and 2.33 Phi respectively and the values of moment mean are 2.14 Phi and 2.33 Phi respectively.
In wacke with ferruginous matter, the value of graphic mean and moment mean in Berwala-Mandhna Section ranges from 2.25 Phi to 2.27 Phi and 2.27 Phi to 2.31 Phi respectively. In the Ghaggar River-Chauki Nadah Section the values of graphic mean and moment mean ranges from 2.17 Phi to 2.32 Phi and 2.22 Phi to 2.26 Phi respectively. In the Kona-Karaundanwala Section these values ranges from 2.17 Phi to 2.18 Phi and 2.15 Phi to 2.23 Phi respectively. In random samples the value of graphic mean and moment mean are 1.80 Phi and 1.81 Phi respectively.
In wacke with calcareous matter, the values of graphic mean and moment mean range from 2.08 Phi to 2.20 Phi and 2.12 Phi to 2.16 Phi in the Berwala-Mandhna Section, 2.17 Phi to 2.28 Phi and 2.19 Phi to 2.29 Phi in the Ghaggar River-Chauki Nadah Section and 2.17 Phi and 2.30 Phi in the Kona-Karaundanwala Section. In random sample the value of graphic mean and moment mean are similar.
In lithic wackes, the value of graphic mean and moment mean in the Berwala-Mandhna Section ranges from 1.78 Phi to 2.25 Phi and 1.71 Phi to 2.33 Phi. In the Ghaggar River-Chauki Nadah Section, the value of graphic mean and moment mean ranges from 1.58 Phi to 2.38 Phi and 1.76 Phi to 2.42 Phi. In the Kona-Karaundanwala Section, the value of graphic mean and moment mean range from 2.13 Phi to 2.50 Phi and 2.10 Phi to 2.54 Phi respectively where as in the random samples the value ranges from 2.28 Phi to 2.52 Phi and 2.26 Phi to 2.41 Phi respectively.
In wackes, the values of graphic mean and moment mean in Berwala-Mandhna Section range from 1.25 Phi to 2.25 Phi and 1.69 Phi to 2.53 Phi. In the Ghaggar River-Chauki Nadah Section, the values of graphic mean and moment mean range from 1.75 Phi to 2.00 Phi and 1.94 Phi to 2.24 Phi respectively. In the Kona-Karaundanwala Section, the values of graphic mean and moment mean range from 1.87 Phi to 2.95 Phi and 1.87 Phi to 2.88 Phi and in random samples graphic mean value ranges from 1.95 Phi to 2.27 Phi and moment mean value ranges from 1.97 Phi to 2.24 Phi. The graphic and moment mean values are nearly identical (Tables 1 and 2) and suggest medium to fine sand size of the grains constituting the Pinjor Formation.
3.4. Standard Deviation
Amongst the matrix of conglomeratic beds of the Berwala-Mandhna Section, the inclusive graphic standard deviation and moment standard deviation values are 0.87 Phi and 0.78 Phi respectively. In the Ghaggar RiverChauki Nadah Section, the values are 0.69 Phi and 0.72 Phi, while in the Kona-Karaundanwala Section, these are 0.89 Phi and 0.87 Phi respectively.
In wacke with ferruginous matter, the value of standard deviation and moment standard deviation in the Berwala-Mandhna Section range from 0.75 Phi to 0.85 Phi and 0.74 Phi to 0.82 Phi respectively. In the Ghaggar River-Chauki Nadah Section, the values of standard deviation and moment standard deviation are 0.75 Phi and 0.77 Phi. In the Kona-Karaundanwala Section the values of standard deviation and moment standard deviation ranges from 0.72 Phi to 0.94 Phi and 0.73 Phi to 0.89 Phi respectively. In the random samples the values of graphic standard deviation and moment standard deviation are 0.87 Phi and 0.78 Phi respectively.
In the wacke with calcareous matter, the values of standard deviation and moment standard deviation in the Berwala-Mandhna Section are 0.74 Phi to 0.77 Phi and 1.10 Phi to 1.32 Phi. In the Ghaggar River-Chauki Nadah Section, the value of standard deviation and moment standard deviation varies from 0.88 Phi to 0.97 Phi and 0.84 Phi to 0.85 Phi respectively. In the Kona-Karaundanwala Section, the values of standard deviation and moment standard deviation are 0.76 Phi and 0.79 Phi. In the random samples, the values of graphic standard deviation and moment standard deviation are 0.66 Phi and 0.64 Phi respectively.
In lithic wacke, the values of standard deviation and moment standard deviation in the Berwala-Mandhna Section are 0.59 Phi to 1.02 Phi and 0.59 Phi to 0.91 Phi respectively. In the Ghaggar River-Chauki Nadah Section, the values of standard deviation and moment standard deviation vary from 0.57 Phi to 0.69 Phi and 0.60 Phi to 0.72 Phi respectively. In the Kona-Karaundanwala Section, the values of standard deviation and moment standard deviation range from 0.62 Phi to 0.85 Phi and 0.64 Phi to 0.82 Phi respectively. The values of graphic standard deviation and moment standard deviation in random samples range from 0.82 Phi to 0.89 Phi and 0.78 Phi to 0.79 Phi respectively.
In wacke, the value of standard deviation and moment standard deviation in the Berwala-Mandhna Section range from 0.68 Phi to 0.90 Phi and 0.69 Phi to 0.81 Phi respectively. In the Ghaggar River-Chauki Nadah Section, the values of standard deviation and moment standard deviation vary from 0.59 Phi to 0.73 Phi and 0.60 Phi to 0.78 Phi respectively. In the Kona-Karaundanwala Section, the values of standard deviation and moment standard deviation are 0.59 Phi to 0.81 Phi and 0.62 Phi to 0.79 Phi. In random sample, these values range from 0.63 Phi to 0.78 Phi and 0.66 Phi to 0.68 Phi respectively.
3.5. Simple Sorting Measure
In the matrix of conglomeratic beds, the values of the simple sorting measure vary from 1.32 Phi to 1.50 Phi (Table 1) while in the wacke with ferruginous matter, the values range between 1.12 Phi and 1.50 Phi. Values of simple sorting measure of the wacke with calcareous matter vary from 1.22 Phi to 1.55 Phi. Among the lithic wackes and wackes, the values of simple sorting measure
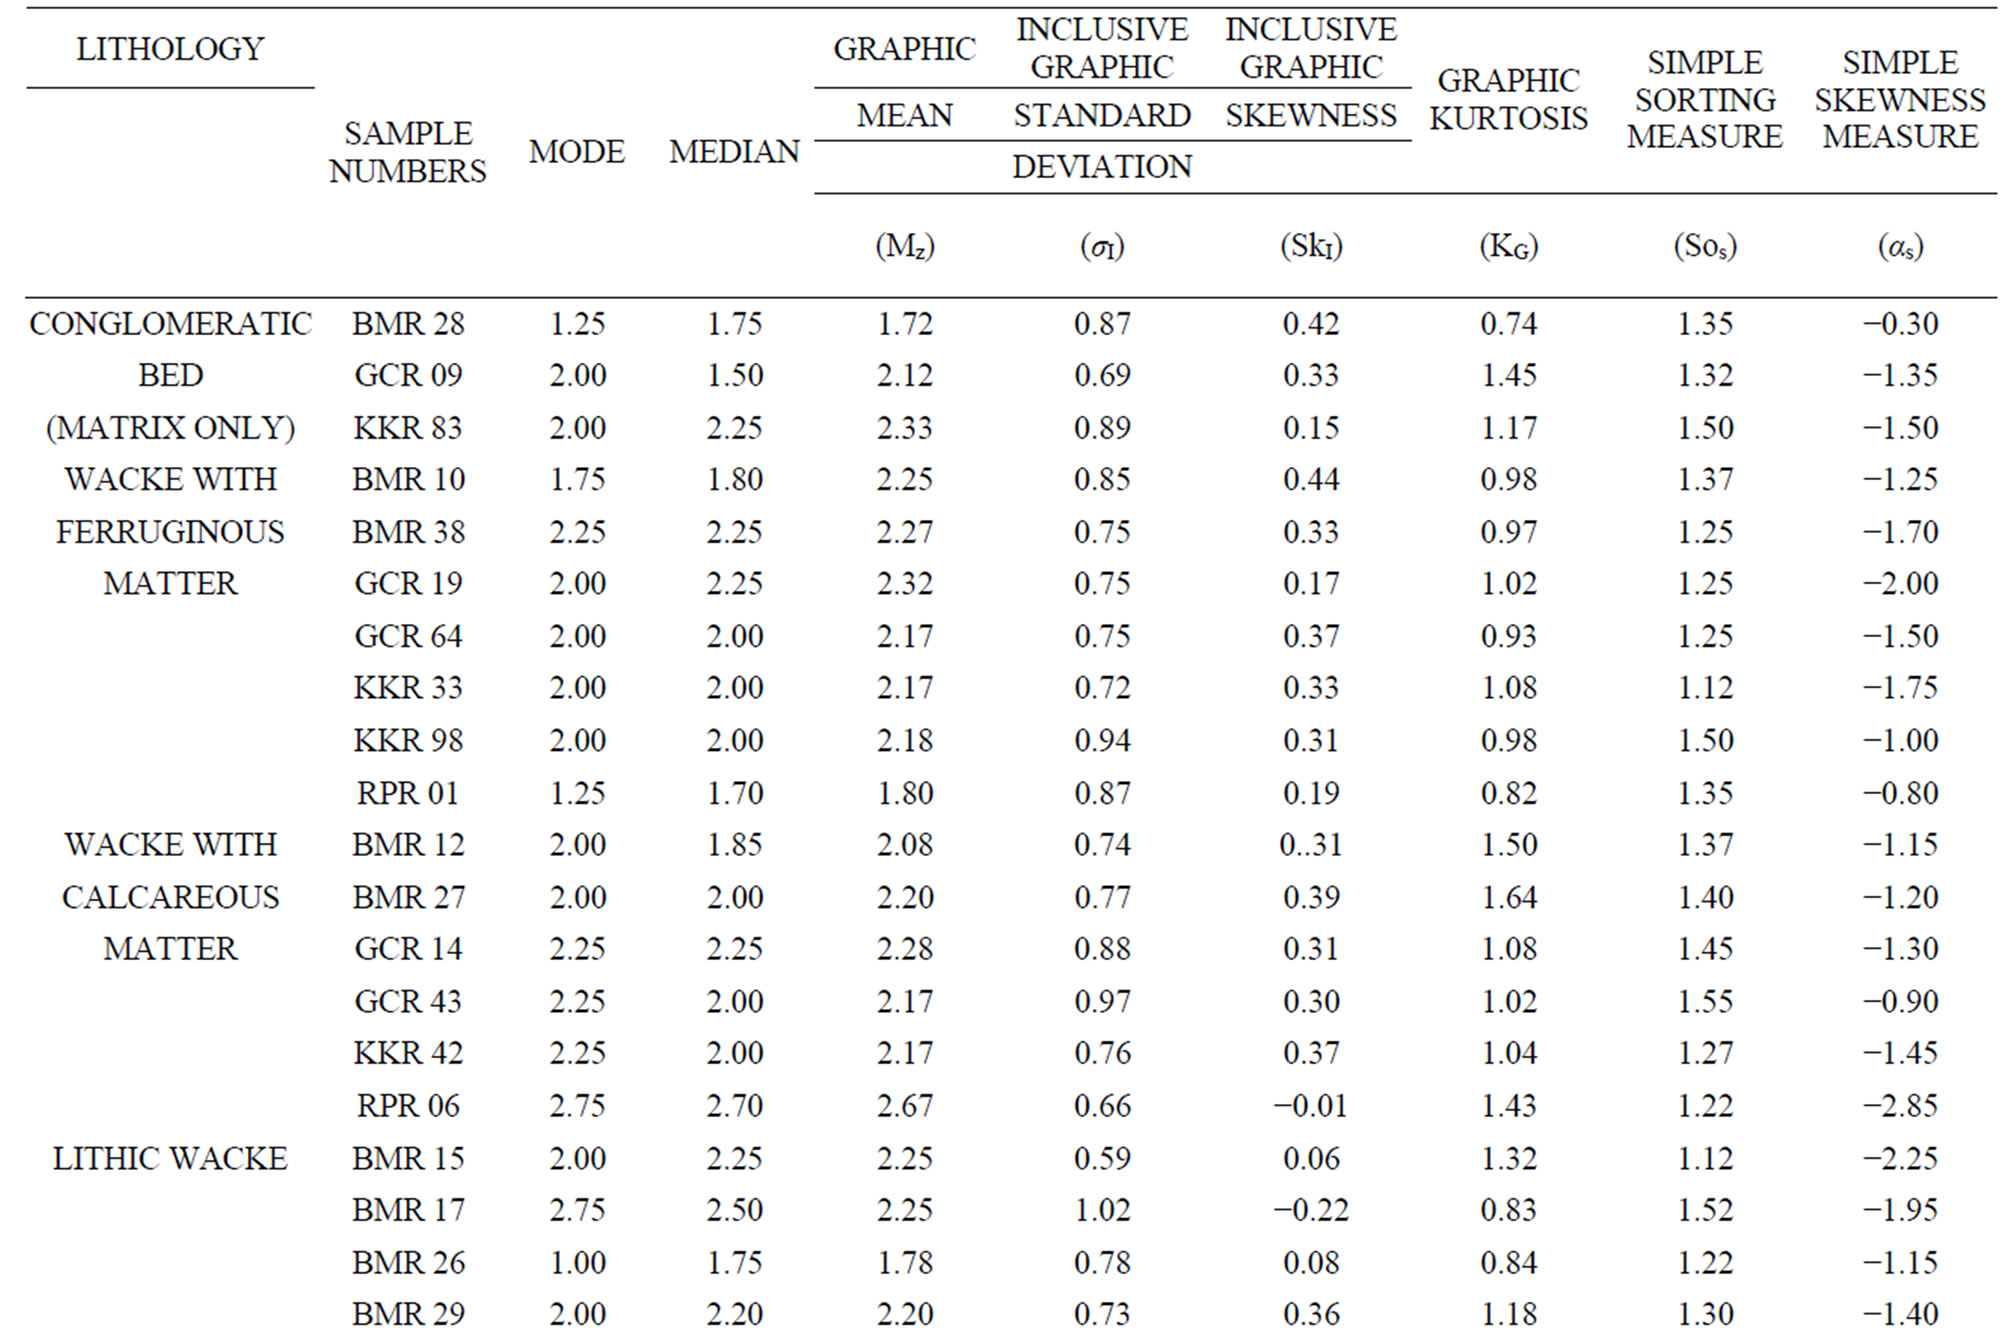
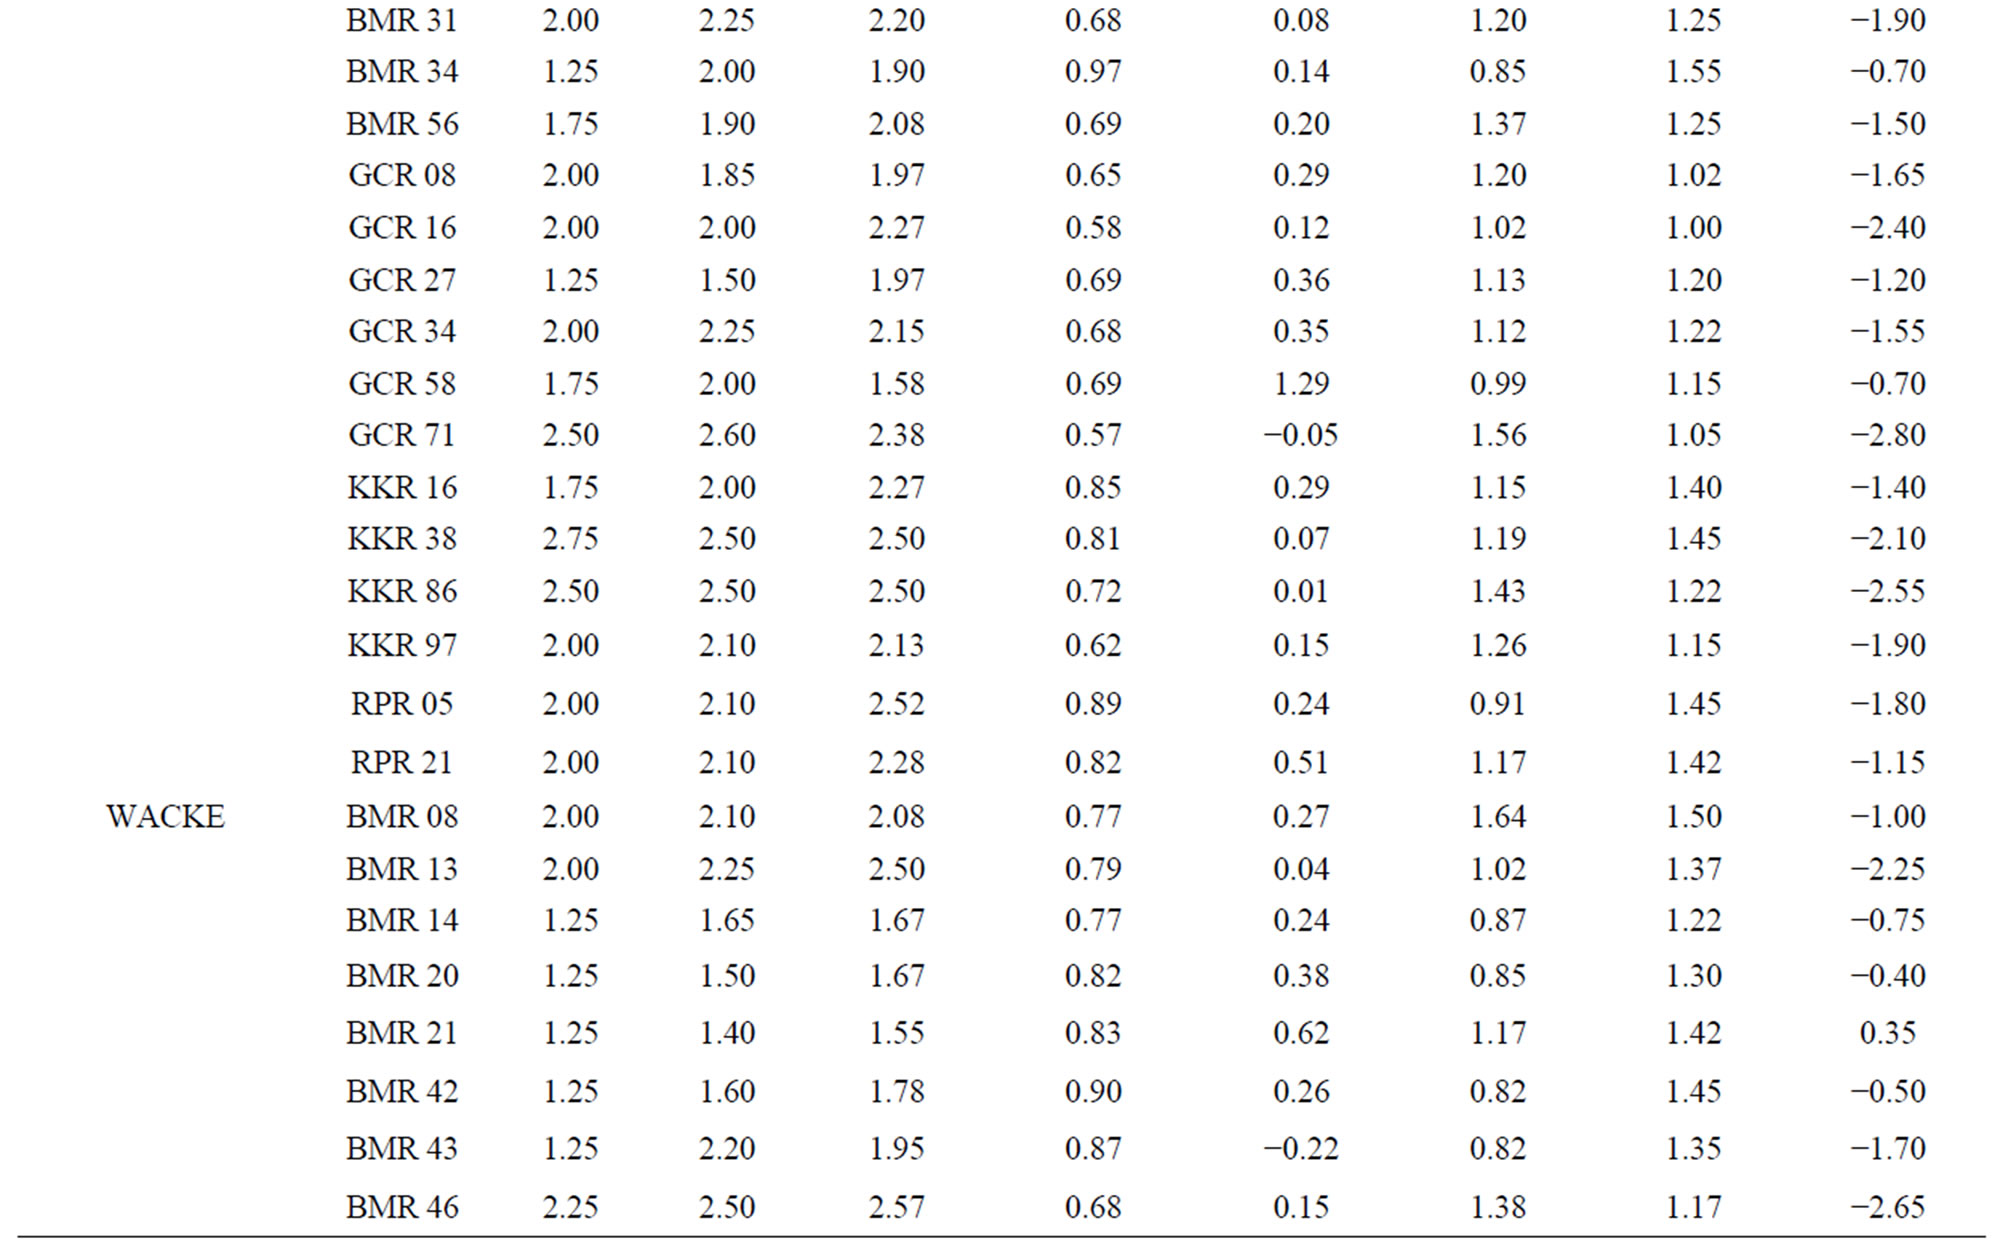
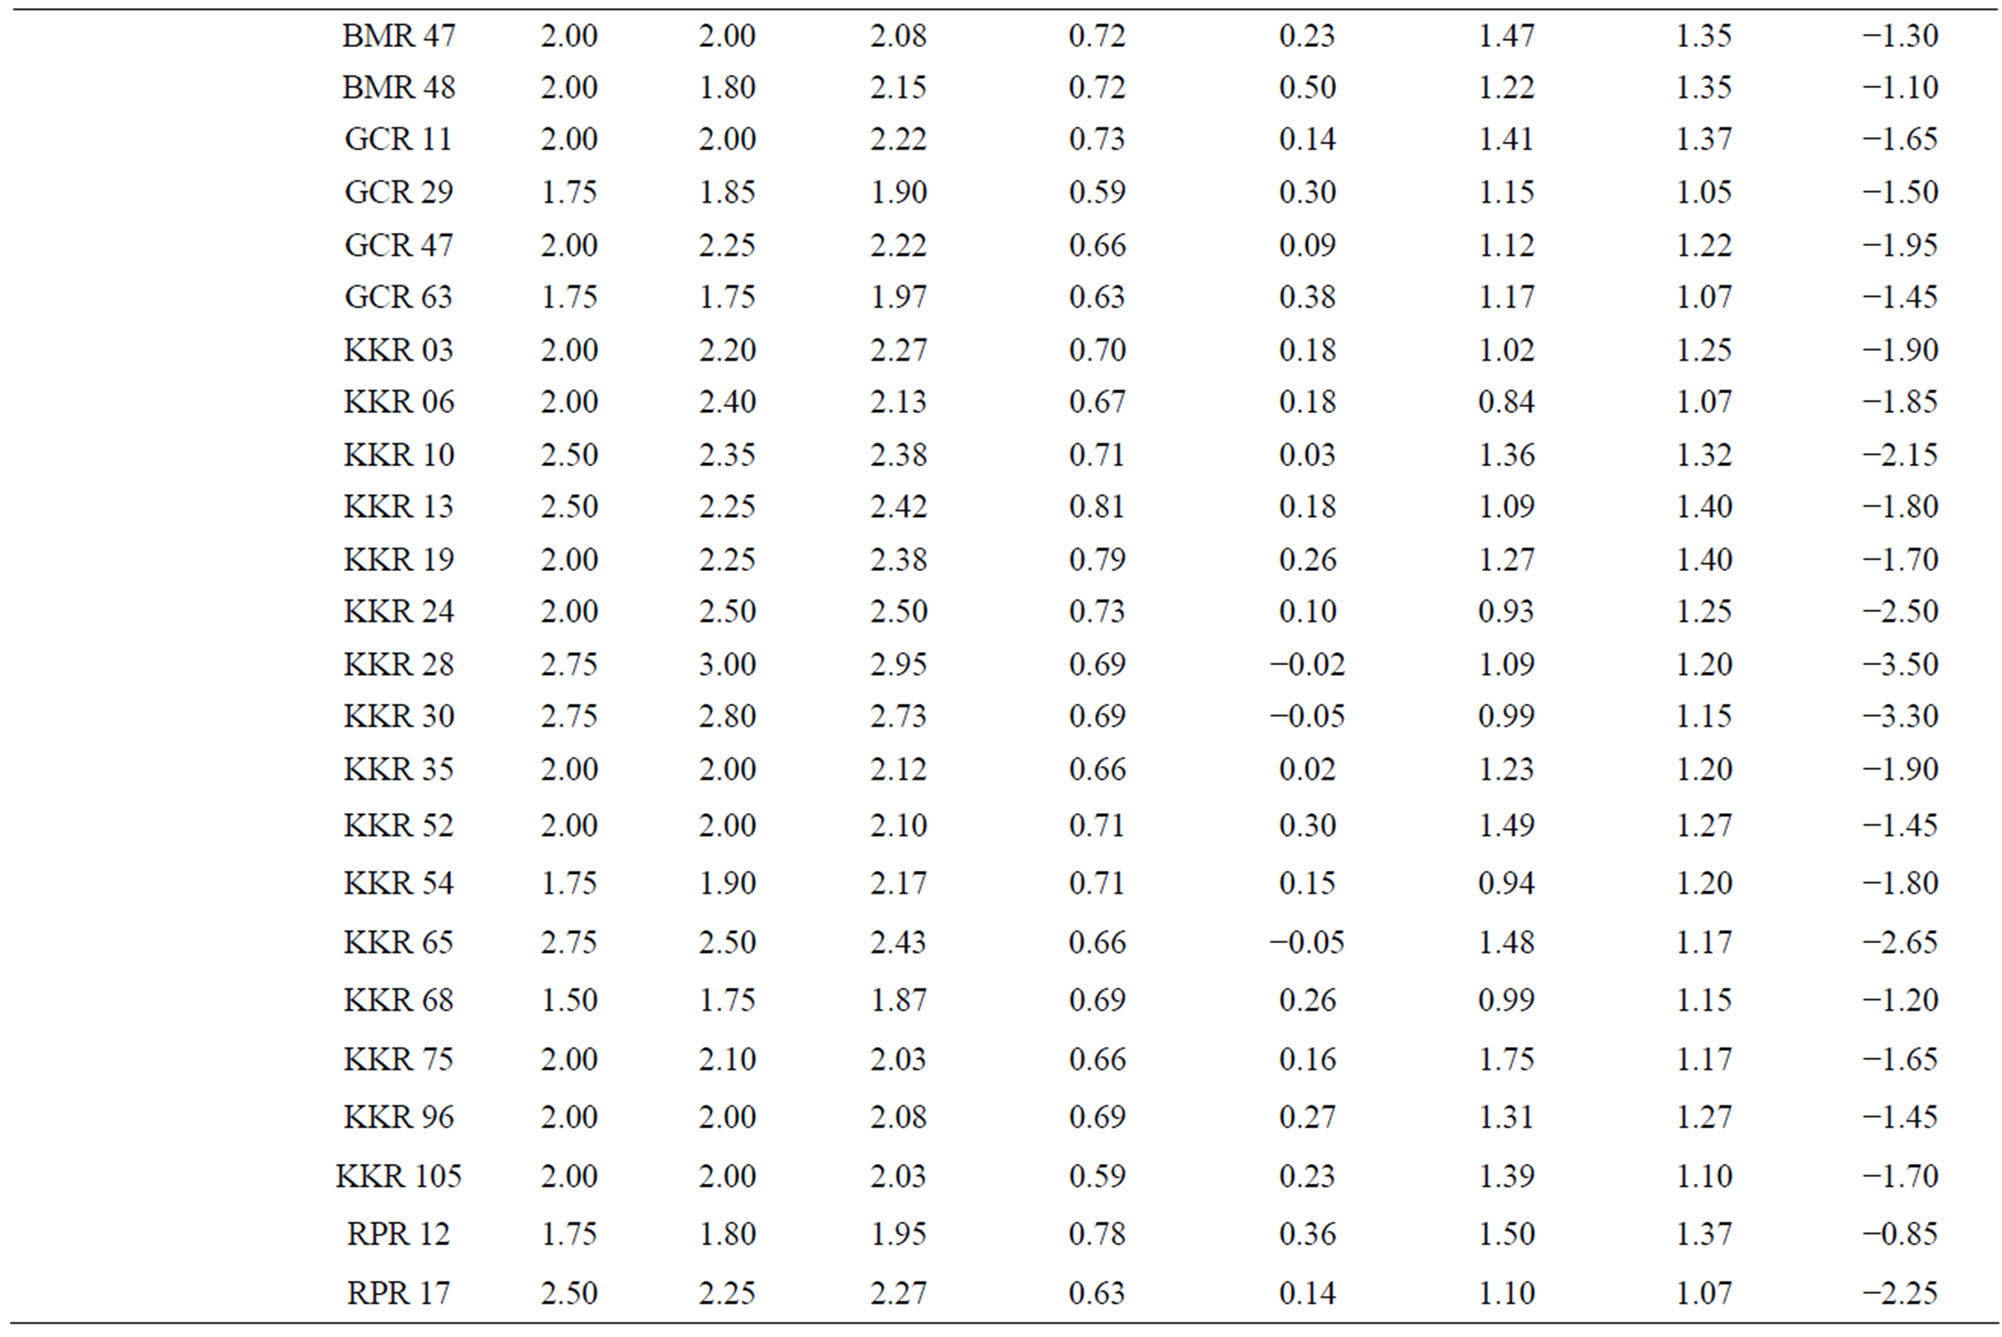
Table 1. Textural parameters (graphic measures) of the Upper Siwalik Late Pliocene-Early Pleistocene sediments.
range between 1.00 Phi to 1.55 Phi and from 1.05 Phi to 1.50 Phi respectively.
3.6. Moment Mean Cubed Deviation
Among the matrix of conglomeratic bed of the various sections, the values of moment mean-cubed deviation range from 0.32 Phi to 0.50 Phi. Majority of the samples have positive values. In the wacke with ferruginous matter and wacke with calcareous matter, the values vary from 0.26 Phi to 0.50 Phi and 0.03 Phi to 0.51 Phi respectively. Among the lithic wackes and the wackes, the moment mean-cubed deviation values range from 0.08 Phi to 0.67 Phi and 0.01 Phi to 0.79 Phi respectively.
3.7. Skewness
In the Berwala-Mandhna Section, the inclusive graphic skewness value of the matrix of conglomeratic bed is +0.42 indicating strongly fine skewed population of the sediments. The value in the Ghaggar River-Chauki Nadah Section is +0.33 reflecting strongly fine skewned population of the sediments. The value in the Kona-Karaundanwala Section is +0.15 indicating fine skewned population of the sediments. The moment skewness values of the matrix of conglomeratic bed range from +2.67 to +4.19.
Among the wacke with ferruginous matter, the inclusive graphic skewness values of the sediments vary from +0.17 to +0.44 indicating fine to strongly fine skewed distribution of the sediments. The moment skewness values vary from +2.70 to +4.13.
In wacke with calcareous matter of the BerwalaMandhna Section, the values of the inclusive graphic skewness vary from +0.31 to +0.39 indicating strongly fine skewed distribution. In the other sections and random samples, the skewness values range between −0.01 and +0.37 indicating the presence of strongly fine skewed, fine-skewed, near-symmetrical and coarse-skewed populations. The moment skewness values range from +2.78 to +4.45.
The values of inclusive graphic skewness among the lithic wackes of the various measured and random samples of the Pinjor Formation range from −0.05 to +0.51 indicating strongly fine-skewed to coarse-skewed population. The values of moment skewness vary from +2.33 to +4.66 (Tables 1 and 2).
Among the wackes, the values of inclusive graphic skewness range from −0.02 to +0.62 indicating nearsymmetrical, strongly fine skewed and fine-skewed population. The moment skewness values vary from
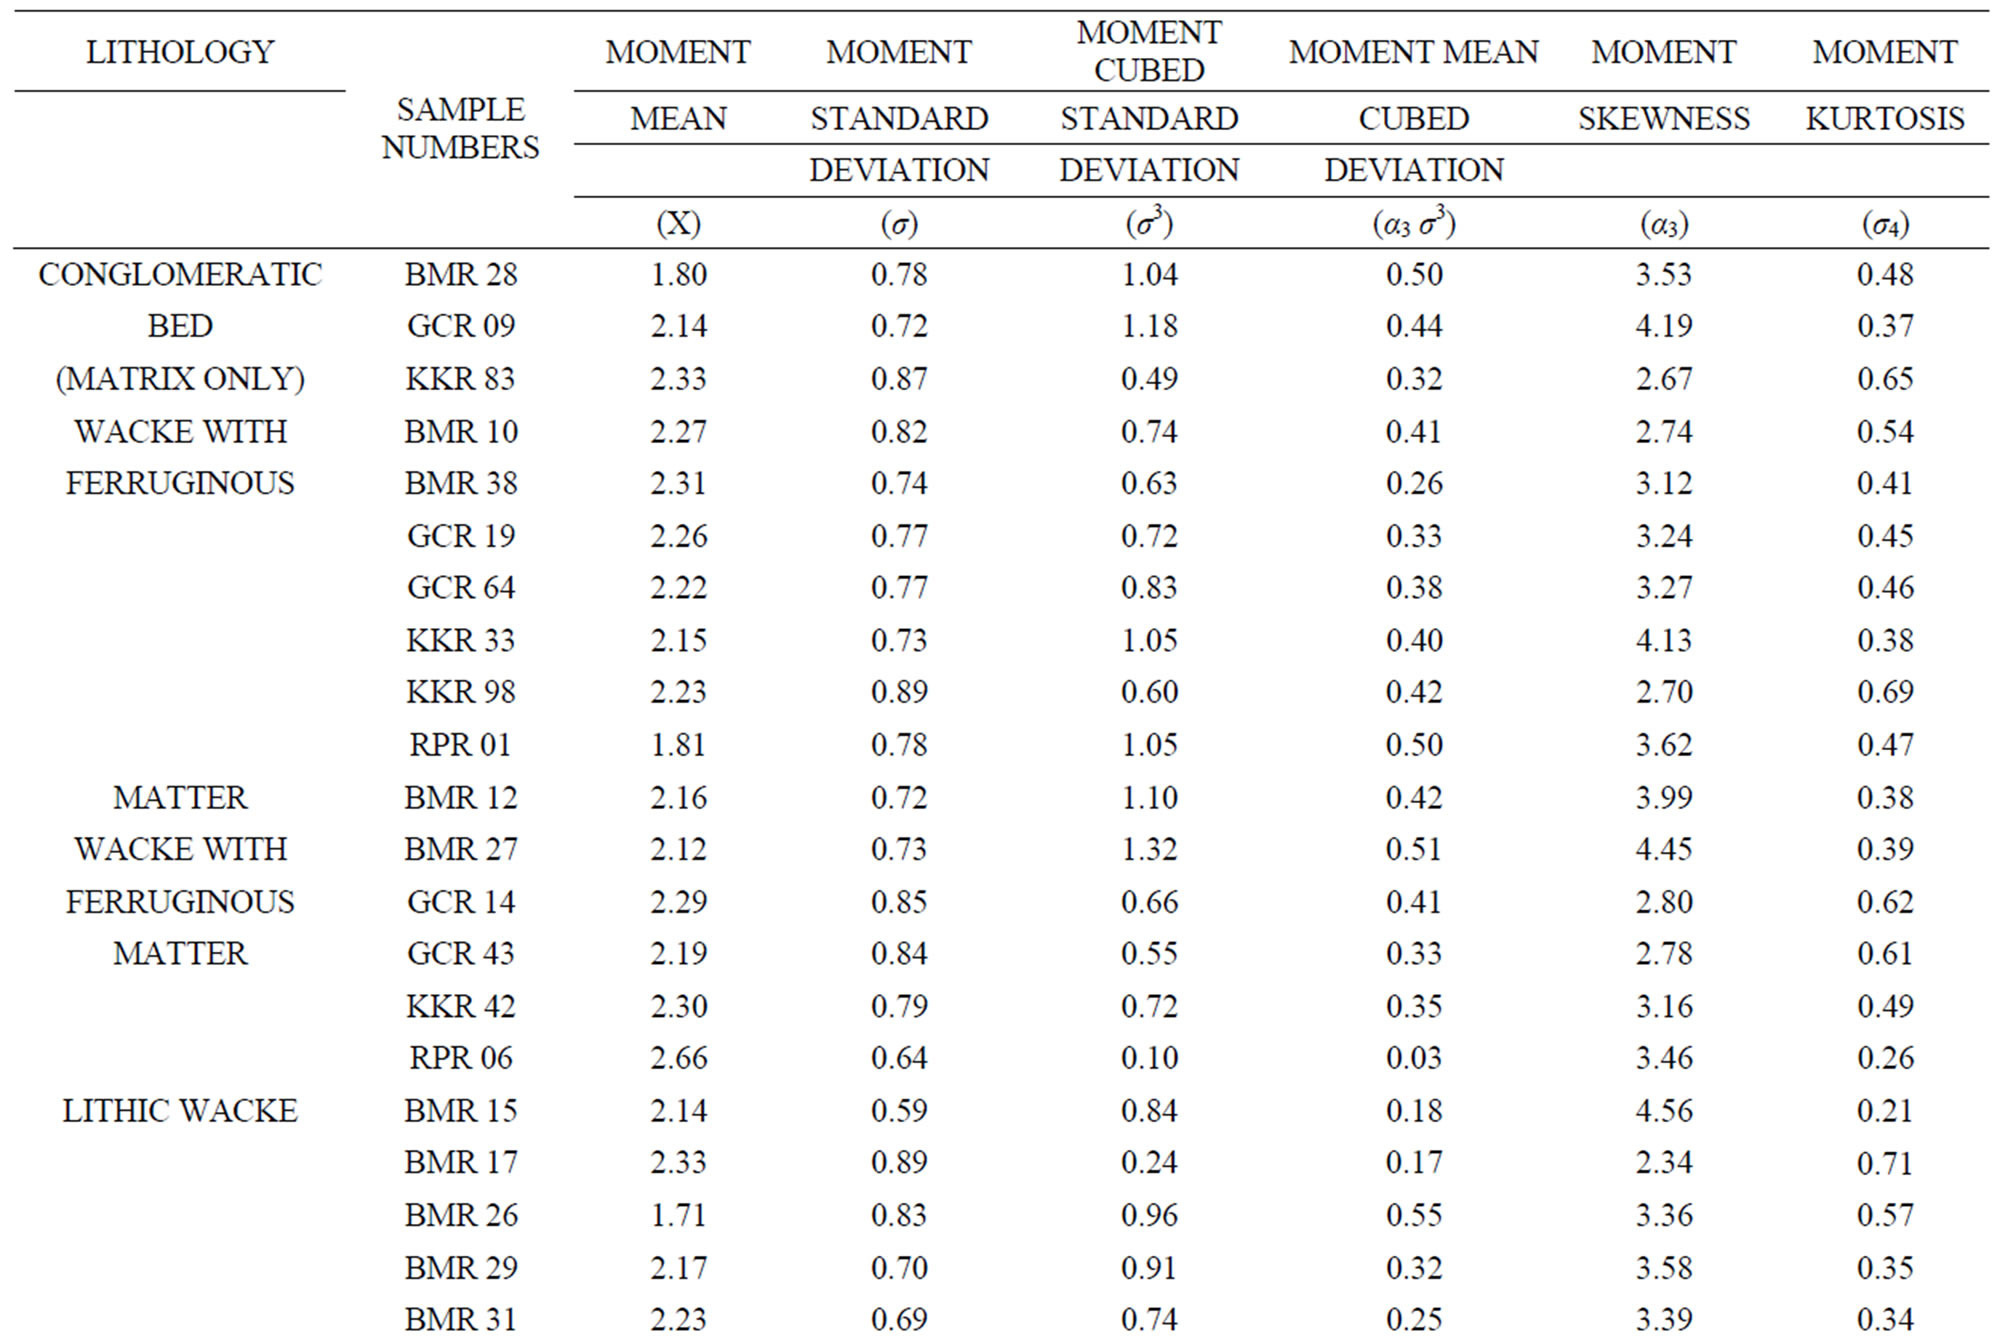
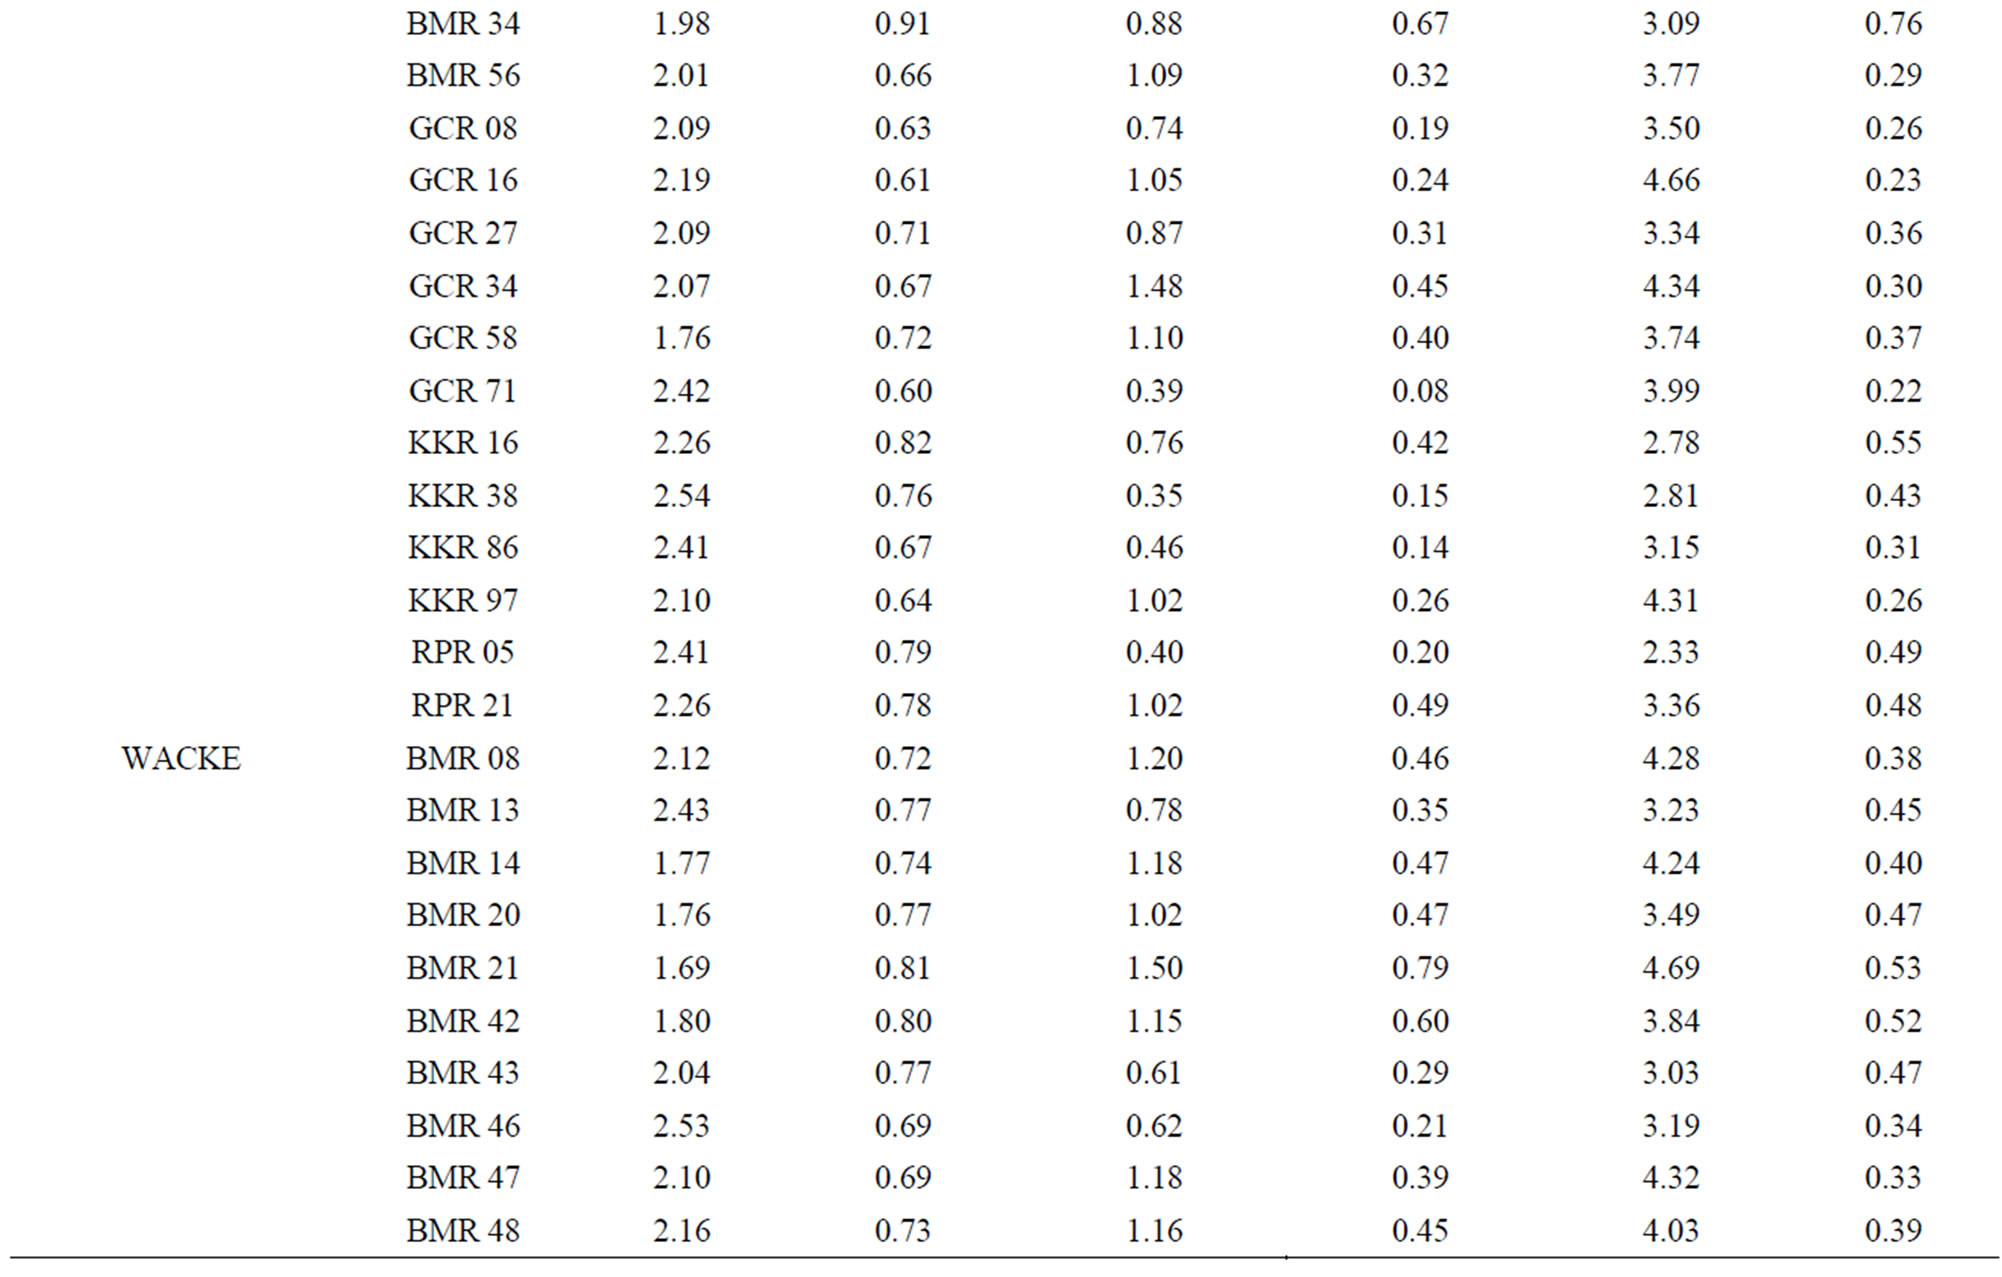
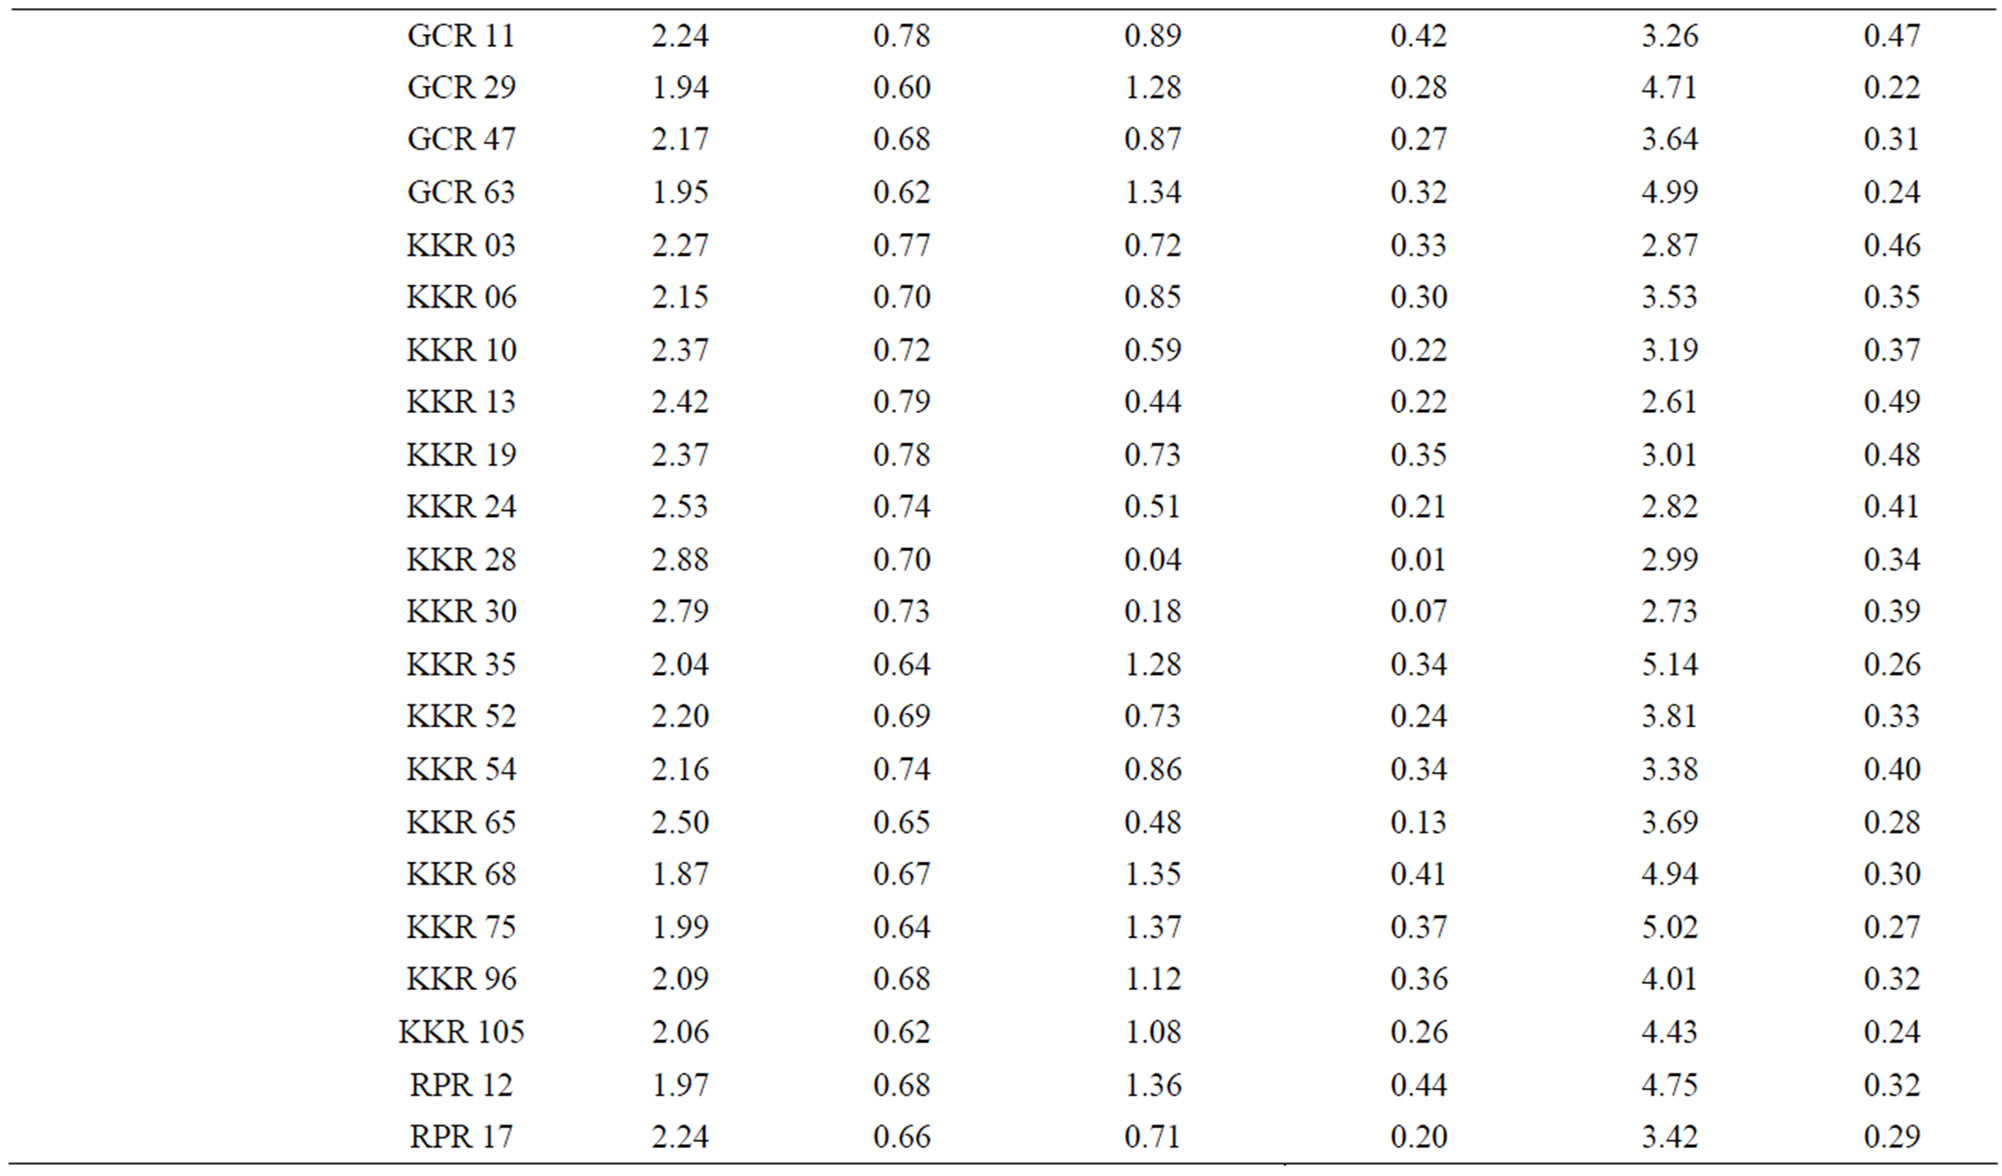
Table 2. Textural parameters (moment measures) of the Upper Siwalik Late Pliocene-Early Pleistocene sediments.
+2.61 to +5.14.
3.8. Kurtosis
In the matrix of the conglomeratic bed of the BerwalaMandhna Section, the value of graphic kurtosis and moment kurtosis are 0.74 and 0.48 and in the Kona-Karundanwala Section these are 1.17 and 0.65 respectively.
In wacke with ferruginous matter, the values of graphic kurtosis and moment kurtosis in the BerwalaMandhna Section ranges from 0.97 to 0.98 and 0.41 to 0.54 respectively. In the Ghaggar River-Chauki Nadah Section, the values of graphic kurtosis and moment kurtosis range from 0.93 to 1.02 and 0.45 to 0.46 respectively. In the Kona-Karundanwala section, the values of graphic kurtosis and moment kurtosis range from 0.98 to 1.08 and 0.38 to 0.69 respectively. In random samples the value of graphic kurtosis and moment kurtosis is 0.82 and 0.47.
In wacke with calcareous matter, the values of graphic kurtosis and moment kurtosis in the Berwala-Mandhna Section varies from 1.50 to 1.64 and 0.38 to 0.39 respectively. In the Ghaggar River-Chauki Nadah Section these values ranges from 1.02 to 1.08 and 0.61 to 0.62 respectively. In the Kona-Karundanwala Section, the values of graphic kurtosis and moment kurtosis are 1.04 and 0.49. The random samples show the graphic kurtosis and moment kurtosis value 1.43 and 0.26 respectively.
In lithic wacke, the values of graphic kurtosis and moment kurtosis in the Berwala-Mandhna Section range from 0.83 to 1.37 and 0.21 to 0.76 respectively. In the Ghaggar River-Chauki Nadah Section, the values of graphic kurtosis and moment kurtosis vary from 0.99 to 1.56 and 0.22 to 0.37 respectively. In the Kona-Karundanwala section, the value ranges from 1.26 to 1.43 and 0.26 to 0.55 respectively. The random samples show the graphic kurtosis and moment kurtosis value from 0.91 to 1.17 and 0.48 to 0.49 respectively.
In wacke, the value of graphic kurtosis and moment kurtosis in the Berwala-Mandhna Section ranges from 0.82 to 1.64 and 0.33 to 0.53 respectively. In the Ghaggar River-Chauki Nadah Section, the values of graphic kurtosis and moment kurtosis vary from 1.12 to 1.41 and 0.22 to 0.47 respectively. In the Kona-Karundanwala section, the values of graphic kurtosis and moment kurtosis range from 0.84 to 1.75 and 0.24 to 0.49 respectively. In the random samples, the graphic kurtosis and moment kurtosis values vary from 1.10 to 1.50 and 0.29 to 0.32 respectively.
4. Discussion and Conclusions
The analytical results of the statistical parameters reveal that the sediments of the Upper Siwalik Pinjor Formation are bimodal to polymodal in nature suggesting their derivation from a tectonically active terrain where abundant sediments were being brought to the basin of sedimentation from different sources. The sediments are of medium to fine grain size suggesting their moderate to not very long distance of transport. During this time, the topography of the positive areas was periodically affected by tectonic movements which were interspersed with relatively quite periods. Majority of the sediments are moderately sorted suggesting their derivation from a tectonically active and a dominantly wet palaeoclimatic regime where source rocks were being eroded at a fast pace.
A moist and well drained palaeoenvironment for the lower Siwalik succession of the kumaun Himalaya has been documented by [14]. Sharma [15] considered the fine grained sediment of the Lower Siwalik sediments of Jammu area to have been deposited by over bank flooding. A humid palaeoclimate for the Middle Siwalik subgroup in Tista vally has been suggested by [16].
The inclusive graphic standard deviation and moment standard deviation values of the Pinjor Formation indicate that the sediments have moderately sorted to moderately sorted population which suggests their deposition in shallow to moderately deep agitated waters. Reineck and Singh [17-19] postulated that the deposition of such sediments usually takes place under fluvial condition. These observations are in consonance with the views expressed by [20].
The log probability plots indicate that the sediments of the Pinjor Formation were deposited in fluvial environment by traction, saltation and suspension mode, but the saltation mode dominated the depositional processs. The Pinjor sediments are polymodal in nature and as such skewness value has limited interpretation significance in such a setting [21]. The fine skewed to coarse skewed nature of the sediments reflects the presence of levee and channel micro-environment sediments.
Log-probability plots (Figures 2 and 3) and C-M pattern (Figure 4) indicate the deposition of sediments from graded and uniform suspension which are characteristic of flood plain and levee sub environments of fluvial domain. For getting the precise information about the depositional environments, binary plots are made between the environment-sensitive textural parameters. Binary plots between one percentile and median (C-M diagram); between mean (Mz) and standard deviation (σI); between mean-cubed deviation (α3 σ3) and standard deviation (σ); between mean-cubed deviation (α3 σ3) and cubed standard deviation (σ3); between skewness (SkI) and standard deviation (σI); between skewness (SkI) and mean (Mz) reveal that the sediments of the Pinjor Formation have been deposited by rivers and rivulets draining the region (Figures 4-9).
The Pinjor sediments show platykurtic to leptokurtic character. Chaudhri and Khan [22], [18,21,23,24] observed that kurtosis is not a very good parameter for distinguishing the environment of sedimentation. The posi-
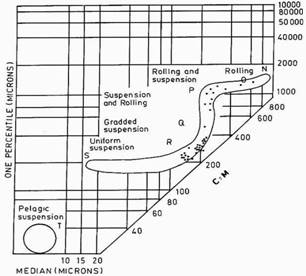
Figure 4. CM diagram. The overlapping points show high density of plots.
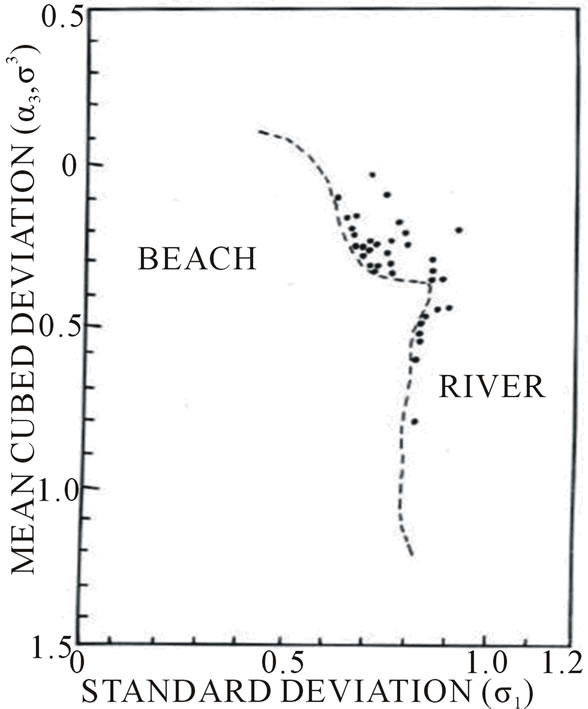
Figure 5. Binary plot between mean and standard deviation.

Figure 6. Binary plot between mean cubed deviation and standard deviation.
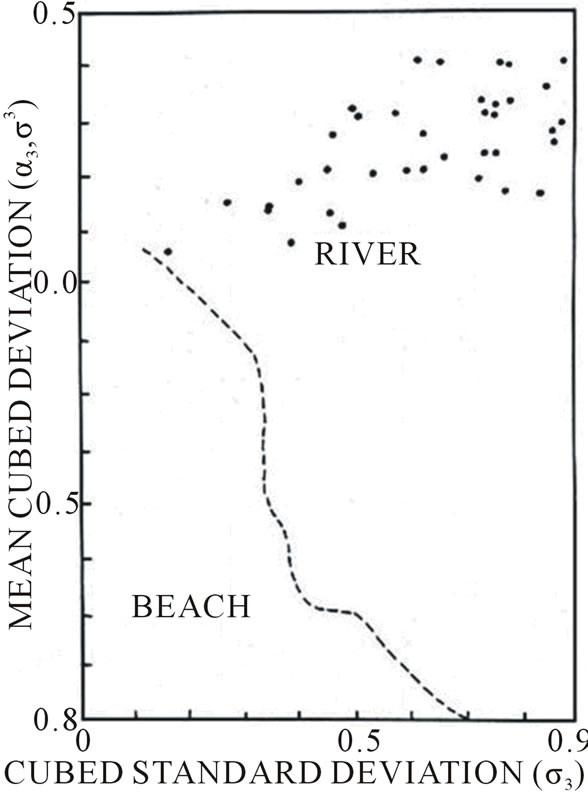
Figure 7. Binary plot between mean cubed deviation and cubed standard deviation.
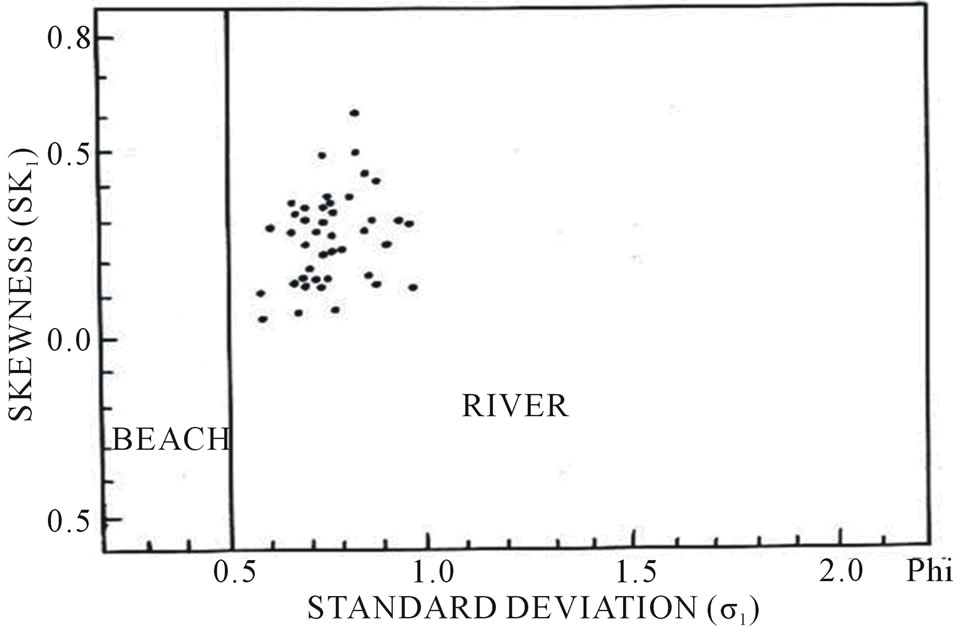
Figure 8. Binary plot between skewness and standard deviation.
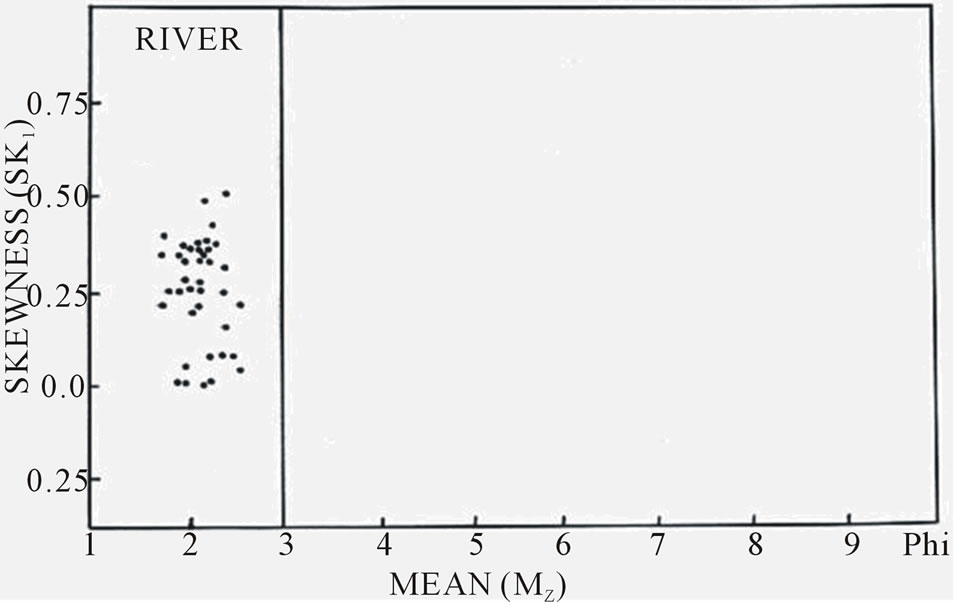
Figure 9. Binary plot between skewness and mean.
tive value of moment mean cube deviation reflects the deposition of the sediments in dominantly fluvial environment.
To sum up, the detritus of the Pinjor Formation in the type area Pinjor and adjoining regions appear to have been deposited in shallow agitated to moderately agitated deep water environments. The Pinjor sediments are continental in character and were deposited by fluvial agencies. These conclusions are in broad harmony with the views expressed by [25-28].
5. Acknowledgements
The authors wish to record their sincere gratitude to Prof. Dr. R.S. Chaudhri for his constant support and guidance. The work was carried out at Department of Geology, Kurukshetra University, Kurukshetra.
REFERENCES
- R. S. Chaudhri, “Geology of the Siwalik Group of western and central Himalaya: Fifty Years of Research on Sustainable Resource Management,” S. P. Mittal, R. K. Aggarwal and J. S. Samra, Eds., Central Soil and Water Conservation Research and Training Institute, Research Centre, Chandigarh, 2000, pp. 3-18.
- M. Singh, “Sedimentology of the Pinjor Formation Exposed in the Type Area Pinjore and Surrounding Regions,” Unpublished Ph.D. Thesis, 2009, p. 339.
- N. Suresh, S. K. Ghosh, R. Kumar and S. J. Sangode, “Clay Mineral Distribution Pattern in Late Neogene Fluvial Sediments of Subathu Sub-Basin, Central Sector of Himalayan Foreland Basin: Implication for Provenance and Climatic Condition,” Sedimentary Geology, Vol. 163, No. 3-4, 2004, pp. 265-278. http://dx.doi.org/10.1016/j.sedgeo.2003.07.006
- R. Kumar, S. K. Ghosh and S. J. Sangode, “Depositional Environment of Mio-Pleistocene Coarse Clastic Facies in the Himalayan Foreland Basin, India,” Himalayan Geology, Vol. 25, No. 2, 2004, pp. 101-120.
- K. Ullan, M. Arif and M. T. Shah, “Petrography of Sandstones from the Kamlial and Chinji Formations Southwestern Kohat Plateau, NW Pakistan Implication for Source Lithology and Palaeoclimate,” Journal Himalayan Earth Science, Vol. 39, 2006, pp. 1-13.
- V. Kumaravel, S. J. Sangode, S. Siddaiah and R. Kumar, “Major Element Geochemical Variations in a MiocenePliocene Siwalik Paleosol Sequence: Implications to Soil Forming Processes in the Himalayan Foreland Basin,” Journal Geological Society India, Vol. 73, No. 6, 2009, pp. 759-772.
- A. R. Chaudhri, M. Singh and A. Kumar, “Textural Parameters of the (Saraswati) River Sediments from Bhor Sayidan, Kurukshetra, India,” In: A. R. Chaudhri, Ed., Saraswati River, Saraswati Nadi Shodh Sansthan, Haryana, 2009, pp. 58-63.
- P. Jalal and S. K. Ghosh, “Provenance of the Late Neogene Siwalik Sandstone, Kumaun Himalayan Foreland Basin: Constraints from the Metamorphic Rank and Index of Detrital Rock Fragments,” Journal Earth System Science, Vol. 121, No. 3, 2012, pp. 781-792.
- A. R. Chaudhri and M. Singh, “Clay Minerals as Climate Change Indicators—A Case Study,” American Journal of Climate Change, Vol. 1, No. 4, 2012, pp. 231-239. http://dx.doi.org/10.4236/ajcc.2012.14020
- M. Singh, “Sedimentary Structures of the Pinjor Formation Exposed in the Type Area Pinjor, Northwestern Himalaya,” PARIPEX-Indian Journal of Research, Vol. 1, No. 6, 2012, pp. 73-75.
- M. Singh, “Heavy Mineral Assemblage of the Pinjor Formation of the Northwestern Himalaya and Its Significance in Deciphering the Provenance of the Sediments,” Geosciences, Vol. 2, No. 6, 2012, pp. 157-163.
- R. L. Folk and W. C. Ward, “Brazos River Bar—A Study in the Significance of Grain Size Parameters,” Journal Sedimentary Petrology, Vol. 27, No. 1, 1957, pp. 3-26. http://dx.doi.org/10.1306/74D70646-2B21-11D7-8648000102C1865D
- G. M. Friedman and J. E. Sanders, “Principles of Sedimentology,” John Wiley and Sons, New York, 1978, p. 792.
- U. K. Shukla, D. S. Bora and C. K. Singh, “Geomorphic Positioning and Depositional Dynamics of River Systems in the Lower Siwalik Basin, Kumaun Himalaya,” Journal Geological Society India, Vol. 73, No. 3, 2009, pp. 83-89. http://dx.doi.org/10.1007/s12594-009-0014-z
- S. Sharma, M. Sharma and I. B. Singh, “Facies Characteristics and Cyclicity of Lower Siwalik Sediment, Jammu Area: A New Perspective,” Geological Magazine, Vol. 138, No. 4, 2001, pp. 455-470. http://dx.doi.org/10.1017/S0016756801005659
- A. Kundu, A. Matin and M. Mukul, “Depositional Environment and Provenance ao the Middle Siwalik Sediments in Tista Valley, Darjiling District, Eastern Himalaya, India,” Journal Earth System Science, Vol. 121, No. 1, 2012, pp. 73-89. http://dx.doi.org/10.1007/s12040-012-0154-1
- H. E. Reineck and I. B. Singh, “Depositional Sedimentary Environments,” Springer-Verlag, Berlin, 1973, p. 439. http://dx.doi.org/10.1007/978-3-642-96291-2
- R. S. Chaudhri and A. Chakarborty, “Textural Parameters of the River Sediments-Ghaggar River, India,” Contemporary Geoscience Research in the Himalaya, Vol. 2, 1982, pp. 105-116.
- G. T. S. Gill, “Sedimentology of the Siwalik Group Exposed between the Rivers Ghaggar and Markanda Northwestern Himalaya,” Publication Centre Advanced Studied Geology, Panjab University, Vol. 13, 1983, pp. 274-312.
- G. M. Friedman, “Difference in Size Distribution of Populations of Particles among Sands of Various Origins, Address of Retiring President of the International Association Sedimentologists,” Sedimentology, Vol. 26, No. 1, 1979, pp. 3-32. http://dx.doi.org/10.1111/j.1365-3091.1979.tb00336.x
- R. S. Chaudhri, “Textural Behaviour of Modern Cratonic Sediments and Its Application in Deciphering Ancient Analogues,” Bulletin Indian Geological Association, Vol. 20, No. 2, 1987, pp. 103-119.
- R. S. Chaudhri and H. M. M. Khan, “Textural Parameters of Desert Sediments-Thar Desert, India,” Sedimentary Geology, Vol. 28, No. 1, 1981, pp. 43-62. http://dx.doi.org/10.1016/0037-0738(81)90033-6
- R. S. Chaudhri and S. Chandra, “Textural Parameters of Lake Sediments-Sukhna Lake, Chandigarh,” Research Bulletin (Science) Panjab University, Chandigarh, Vol. 33, 1982, pp. 113-121.
- R. S. Chaudhri, “Sedimentological Parameters of the Recent Sediments from the River, Beach and Desert Domains and Their Bearing on the Interpretation of Ancient Depositional Environments,” Publication Centre Advanced Studied Geology, Panjab University, Vol. 13, 1983, pp. 44-70.
- R. S. Chaudhri, “Petrogenesis of the Siwalik Sediments of Northwestern Himalaya,” Journal Geological Society India, Vol. 13, 1972, pp. 399-402.
- R. S. Chaudhri, “Sedimentology and Genesis of Cenozoic Sediments of the Northwestern Himalayas (India),” Geology Rundschau, Vol. 64, No. 3, 1975, pp. 958-977. http://dx.doi.org/10.1007/BF01820706
- A. R. Chaudhri, “Heavy Mineral Assemblage of the Nagthat Formation of Northwestern Himalaya and Its Significance in Deciphering the Provenance of Sediments,” Bulletin Indian Geological Association, Vol. 24, 1991, pp. 55-59.
- R. S. Chaudhri and G. T. S. Gill, “Fabric and Sedimentology of the Upper Siwalik Boulder Conglomerates Exposed in the Neighbourhood of Punjab, Kumaon Himalaya,” Journal Geological Society India, Vol. 20, 1979, pp. 83-89.