International Journal of Geosciences
Vol.4 No.6A2(2013), Article ID:36028,9 pages DOI:10.4236/ijg.2013.46A2002
Stability Analysis of Cliff Face around Kegon Falls in Nikko, Eastern Japan: An Implication to Its Erosional Mechanisms
Center for Spatial Information Science, The University of Tokyo, Chiba, Japan
Email: hayakawa@csis.u-tokyo.ac.jp
Copyright © 2013 Yuichi S. Hayakawa. This is an open access article distributed under the Creative Commons Attribution License, which permits unrestricted use, distribution, and reproduction in any medium, provided the original work is properly cited.
Received June 15, 2013; revised July 2, 2013; accepted August 11, 2013
Keywords: Bedrock Erosion; Knickpoint; Waterfall; Recession; Terrestrial Laser Scanning
ABSTRACT
A waterfall highlights the locus of active fluvial erosion of bedrock, and its mechanism has been the subject of several studies; however, erosional processes remain to be clarified for specific rock structures composing a waterfall. Herein, the detailed morphology of cliffs around a waterfall is examined by a terrestrial laser scanning (TLS) approach to analyze erosional processes occurring in the cliffs. The study site is Kegon Falls in Japan, which has a vertical drop of surface water from the top of its cliff and groundwater outflows from its lower portion. The entire cliff is mostly overhanging and minor rockfalls are often observed. The latest major rockfall occurred in 1986, causing an approximate 8-m upstream shift of the waterfall lip. From the point cloud obtained by TLS measurement, a digital elevation model on a vertical plane was generated, and cross-sectional profiles were extracted. A distinct 5- to 10-m depression was found at the bottom of the upper andesite layer of the waterfall cliff, which appears to have been formed by freeze-thaw and wet-dry weathering following the upstream shift of the surface water drop. Stability analysis of the waterfall cliff with an undercutting notch indicates that the igneous rock composing the cliff is sufficiently strong to maintain its current overhanging shape and that catastrophic collapse of the entire waterfall face rarely occurs. Following the formation of the depression, the upper cliff face appears to have been gradually eroded by gravitational collapses of relatively small blocks bounded by columnar and platy joints.
1. Introduction
Erosion of knickpoints, which often act as erosional fronts that propagate upstream, is an important process in the formation of longitudinal river profiles. Waterfalls in bedrock rivers are particular cases of knickpoint that reflect the locus of active fluvial erosion into bedrock [1]. The rate of waterfall recession is often higher than that of other erosional processes in bedrock rivers [2]. Such recession plays a significant role in the evolution of mountainous and plateau terrains to form new longitudinal profiles of rivers responding to base-level changes induced by climatic, tectonic, or volcanic forcings [3-6]. Mechanisms and rates of waterfall recession have been examined through field investigations [7-10], physical experiments [11-14], and numerical simulations [15-17]. Although the erosion rate of waterfalls is often considered to be independent from its mechanism [9,18], detailed mechanical investigation is necessary for improving models of waterfall recession and longitudinal profile development.
Various models have been proposed to explain erosional mechanisms present at waterfalls. The caprock erosion model, based on Niagara Falls in North America, is a well-known explanation of waterfall erosion that assumes rapid undercut of the softer layer beneath the harder caprock layer forming a waterfall [19]. Similar, yet mechanically different, models have also been proposed for vertical to overhanging waterfalls, such as those that explain erosion by failure of subcaprock layer [18]; vertical crack propagation and toppling [20]; and plunge pool deepening and toppling [21]. These models apply particularly to knickpoints with vertical faces. However, for knickpoints with either vertical or degraded faces, shear stress of water flow, including gradual abrasion on the waterfall lip, is also an important factor in the erosion of waterfalls [9]. A model that includes this factor, even without considering undercut erosion, effectively explains the erosion rate of Niagara Falls [22]. A wide variety of waterfall erosion types has been documented for various waterfalls. However, only limited descriptions address the variability of erosional processes in a single waterfall.
Kegon Falls in Japan is one such waterfall that erodes its face by several processes and exhibits relatively complex lithological structures of volcanic edifices that allow for underground outflows at the middle and lower portions of its cliff (Figures 1 and 2). Our previous study suggested the erosion rate of Kegon Falls can be generally explained by a simple erosional model [23]. However, detailed links between the morphology of the waterfall cliff face and erosion by surface water and groundwater remains largely unknown.
The October 1986 collapse of the upper portion of the Kegon Falls cliff face is the latest and most distinct collapse event to occur in the cliff. This rockfall caused the
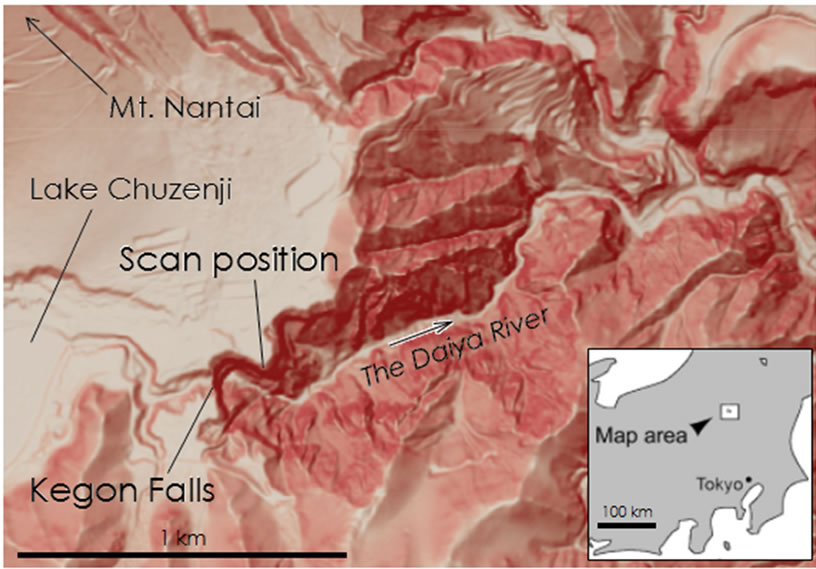
Figure 1. Study site. Kegon Falls and upstream Lake Chuzenji were formed following repeated eruption of Mt. Nantai volcano c. 20 ka. The river draining from the lake passes through the volcanic plateau of Kegon lava and falls over the cliff to form Kegon Falls.

Figure 2. Photographs of Kegon Falls prior to and following the 1986 collapse. (A) Kegon Falls in 1965; (B) Kegon Falls in 2011 (photograph taken by the author). Approximate extent of the 1986 rockfall is indicated by the white dashed line.
position of the waterfall lip to shift 4 - 5 m upstream [24]. In addition, the surface water flow, which had formerly fallen over the entire cliff at a height of 97 m, began to drop onto a protruding layer at the middle part of the cliff. Minor rockfalls in the cliffs near the waterfall have also been reported. However, despite such active deformation of the cliff, measurement of the cliff face morphology has been limited, partly due to difficulties in approaching the waterfall.
In this paper, the author examines the erosional processes of the waterfall cliff face by using detailed morphological data obtained by terrestrial laser scanning [25]. The terrestrial laser scanning method has recently been applied in geomorphology to analyse detailed morphology of such features as gravel bars [26], cliff surfaces [27-29], river banks [30], debris flows [31], and landslides [32]. Although laser measurement is often inapplicable to water surfaces, this method is valid for cliffs adjacent to waterfalls.
2. Study Area
Kegon Falls is located at Nikko in central eastern Japan (Figures 1 and 2), where Quaternary volcanoes are densely present due to a volcanic front induced by collision of the Eurasian and Pacific plates. The climate in the area is relatively cold with an annual mean temperature of 6.0˚C, which is attributed the region’s high altitude of 1292 m a.s.l., as reported by a local meteorological station. The air temperature near the waterfall fluctuates near 0˚C from November to April according to the observatory data from the Automated Meteorological Data Acquisition System (AMeDAS) obtained by the Japan Meteorological Agency. Such conditions are favourable for frequent occurrences of freeze-thaw processes. Mean annual precipitation at the station is 2230 mm, which is higher than the approximate 1500 mm recorded in the adjacent Kanto Plain.
Kegon Falls was formed during the early stages of activities of an adjacent stratovolcano, Mt. Nantai, the mountain body of which was built by repeated eruptions during c. 22,000 - 13,000 ka [33,34]. The formation of Mt. Nantai caused a southward shift in rivers that originally drained northward, forming an east-facing valley of the Daiya River [34]. The andesite lava flow (Kegon lava) in 20 ka filled the valley to form a dammed lake known as Lake Chuzenji, and Kegon Falls was formed at the end cliff of the lava flow [34]. Since that time, the waterfall has receded approximately 350 m at a long-term rate of 0.018 m/y [23]. As noted, the uppermost portion of the cliff near the crest of the waterfall (approximately 30 m in width and 20 m in height) collapsed in 1986, causing actual recession of the waterfall of 4 - 5 m (Figure 2).
Cliffs near the waterfall contain the following four major volcanic layers in descending order: 50 m of andesite lava (upper andesite), 15 m of agglomerate (upper agglomerate), 30 m of andesite lava (lower andesite), and 2 m of agglomerate (lower agglomerate) (Figure 3(a)). Some silty lacustrine sediments are partly interbedded between the upper agglomerate layer and the lower andesite layer [24]. The total height of Kegon Falls is 97 m. The surface water (3.5 × 10⁷ m3/y), which had formerly dropped from the top (1250 m a.s.l.) to bottom directly, has hit the upper agglomerate layer in the middle portion of the cliff since the 1986 rockfall. The upper and lower andesite layers exhibit overhanging profiles, whereas the agglomerate layers are relatively weak and appear to have been eroded by groundwater outflow beneath the andesite layers. The abundant groundwater outflow (6.5 × 10⁷ m3/y) at the boundary of the upper andesite and upper agglomerate layers is supplied from the upstream Lake Chuzenji. Hayakawa and Matsukura [23] showed that stream power by both the surface and groundwater flow is responsible for the recession of Kegon Falls. Moreover, Mino [34] reported the presence of a cave-like depression beneath the lower agglomerate layer with a width of 51 m, height of 5 m, and depth of 26 m. In addition, a 1.5-m-high water drop of the groundwater outflow from the upper Lake Chuzenji was observed at the innermost part of the cave.
3. Method
3.1. Terrestrial Laser Scanning
We used a terrestrial laser scanner (GLS-1500, Topcon Co.) with a maximum measurement range of 500 m and accuracies of 4 mm in distance (at 150 m range) and 6" in angle. The device is capable of measuring up to 30,000 points per second, and the minimum point spacing is 1 mm at 20 m distance; the spot diameter of the laser is approximately 16 mm at a range of 100 m. Laser scanning with an infrared laser (1535 nm for this case) is generally inapplicable to water and wet materials; hence, areas behind and adjacent to the waterfall are often immeasurable. In addition, this type of measurement is affected by atmospheric conditions such as dust and moisture, which can cause shortening of the measurable range.
The measurement was performed in November 2011 after tree leaves had fallen and before snow covered the area, which permitted a clear view from the laser scanner to the target cliff. Water spray from the waterfall was less enough for the laser scanning, and almost no shake occurred due to foot-traffic on the public deck because the scanning was carried out in the very early morning. One scan position was set in a public observation deck located in the front of the waterfall (Figure 1(c)). The elevation of the scan position (ca. 1273 m) is slightly higher than that of waterfall lip (1250 m). The horizontal distance between the waterfall and the scan position was approximately 150 m. Positions of the scanner and five reference targets situated near the scanner were measured with a dual-frequency, kinematic Global Navigation Satellite System (GNSS; GeoXH 6000, Nikon-Trimble), which displays geographic coordinates with horizontal and vertical accuracies of <10 cm.
Point cloud data was obtained and managed by ScanMaster software (Topcon). The point cloud was first projected onto a geographic coordinate (UTM Zone 54N) by distance resections using the five reference targets giving the position and XY direction of the scanner. The resultant coordinates of the scan position matched well with the coordinates measured by the kinematic GNSS by <10 cm in vertical/horizontal distances. The point cloud was then rotated in the following two dimensions
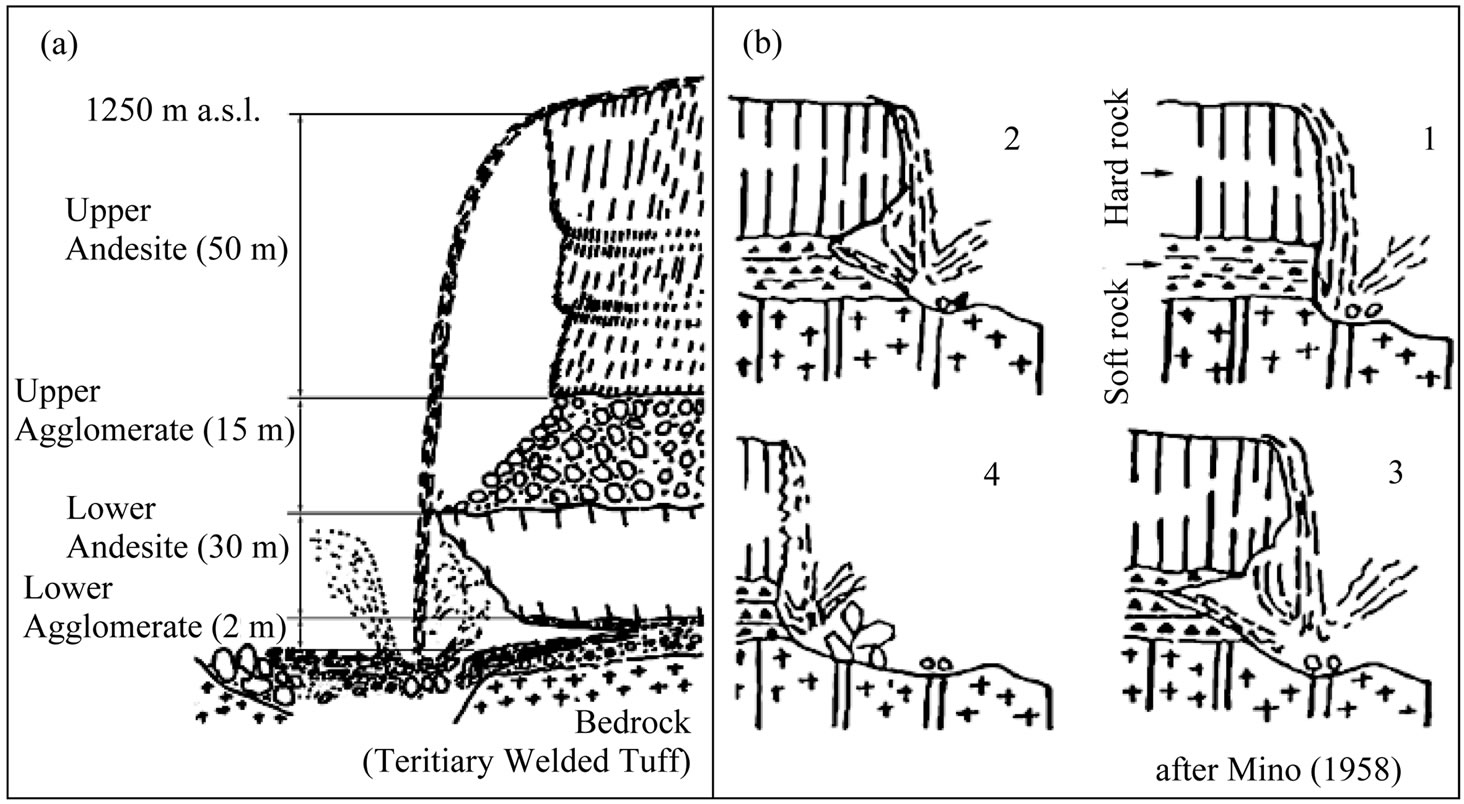
Figure 3. Sketches of Kegon Falls by Mino (1958). (a) Longitudinal profile of the waterfall with lithological structures; (b) Schematic model of the waterfall retreat showing catastrophic collapse.
to create a digital elevation model (DEM) of the cliff face on a vertical plane: 1) +260˚ rotation around the Z axis to set Y axis normal to the waterfall cliff, which is nearly the same as the original dimensions of the TLS device before projection; and 2) −90˚ rotation around the X axis to set the X-Z plane as the horizon plane. The final X and Y axes represent the horizontal distance along the waterfall cliff face and the altitude, respectively. The origin of the final Z axis was set at the waterfall lip.
After eliminating unnecessary points of surrounding areas and vegetation, the point cloud after rotation was converted into a DEM by using simple triangulated irregular network (TIN) interpolation because minimal vegetation cover was visible on the cliff face. To quantify dimensions of the waterfall cliff face, longitudinal and horizontal cross-sectional profiles were then extracted from the DEM on the vertical plane (hereafter referred to as vertical DEM) at a spacing of 10 m.
3.2. Stability Analysis Model of Undercut Cliff
A qualitative model of the recession of Kegon Falls has been proposed by Mino [34] such that the waterfall cliff face collapses episodically after the development of a long notch beneath the cliff (Figure 3(b)). To test this hypothesis, as well as the potential of gravitational collapses of rock blocks on the cliff, we conducted a stability analysis on the cliff face by using a cantilever beam model that incorporates notch development beneath a cliff and associated stress distribution by rotational moment inside the cliff (Figure 4) [35-39]. The application of a cantilever beam model for waterfall cliff face has also been verified in the case of Niagara Falls [22]. In this model, the maximum bending stress σmax inside a cliff is given as
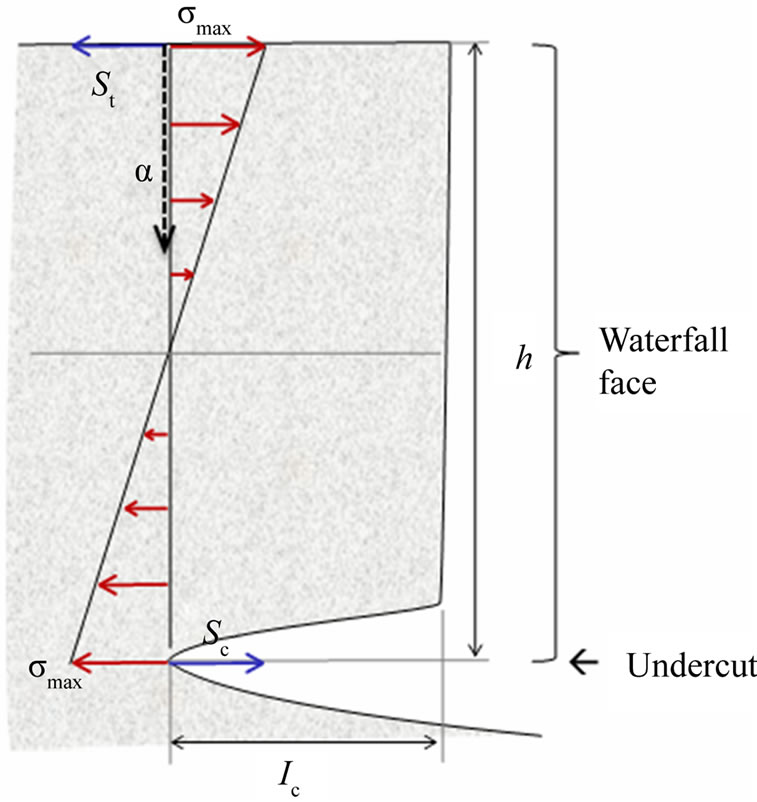
Figure 4. Cantilever beam model for the cliff face of a waterfall describing undercut notch, vertical crack, and stress distributions.
 (1)
(1)
where M is the bending moment and Z is the modulus of the section. At a given width (b) and height of a cliff (h), M and Z are respectively
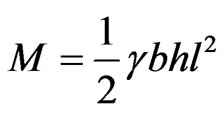 (2)
(2)
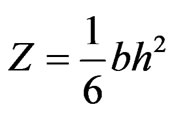 (3)
(3)
where l is the notch length, and γ is the unit weight of rock comprising the cliff. Because the compressive strength of rock (Sc) is generally 5 - 25 times greater than the tensile strength (St) [40], tensile strength on the upper section is predominantly responsible for cliff failures that can originate in the upper section when the maximum bending stress σmax exceeds tensile strength St (Figure 4). Critical notch length lc is therefore obtained from Equations (1), (2), and (3) by replacing σmax with St and l with lc:
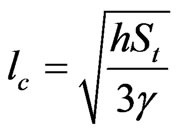 (4)
(4)
If a vertical crack length propagating from the upper surface of the cliff is introduced, the critical notch length is then represented as [39]
 (5)
(5)
where α is a normalized crack depth [0 ≤ α < 1].
The one-dimensional stability analysis above requires the height of the cliff and tensile strength and unit weight of the rock. The morphological parameter (h) was obtained from terrestrial laser scanning (TLS) measurement data, and rock properties were obtained from values reported in previous studies.
4. Results
4.1. Detailed Morphology of the Cliff Face
The number of points by measured TLS was 243,060 after the removal of unnecessary areas and noise. Although areas behind the waterfall could not be measured due to the inapplicability of laser measurement to water, measurement points for areas surrounding the upper lava layer and part of the upper agglomerate layer were effectively obtained. The points were then rotated and interpolated to generate a vertical DEM (Figure 5(a)). The resolution of the DEM was defined as 20 cm, according to the average point density of 33.3 pts/m2 (≈0.17 m/pt); the maximum point density was 244 pts/m2 (≈0.067 m/pt).

Figure 5. Detailed morphology of the Kegon Falls cliff face. (a) Hillshade image of the vertical DEM at a 20-cm resolution; (b) Seven longitudinal profiles of the cliff face on the right side of the waterfall. Numbers R1-R7 correspond to those on the hillshade image; (c) Three longitudinal profiles, L1-L3, of the cliff face on the left side of the waterfall; (d) Six horizontal crosssectional profiles of the cliff face at elevations of 1200 - 1250. The view is from the bottom. The thick dashed line in gray indicates the probable surface of the cliff face prior to the 1986 collapse.
Seven longitudinal profiles on the cliff face of the right-side bank and three longitudinal profiles on that of the left-side bank were then extracted from the DEM at a spacing of 10 m (Figures 5(b) and (c)). Six horizontal cross-sectional profiles were also extracted at a spacing of 10 m, which correspond to elevation levels of 1200 - 1250 m a.s.l. (Figure 5(d)). The profiles near the waterfall exhibit an overhanging trend of the upper andesite lava layer. The uppermost portion of the upper lava layer, at a height of 10 - 15 m, exhibits several vertical planar surfaces, likely representing platy joint planes formed within the lava. Spacing of the major joint planes is approximately 5 m, which indicates that major rockfalls tend to occur for block units bounded by the joints. Several minor joint planes are apparent in the lower part of the upper lava layer, where columnar joints dominate. An approximate surface before the collapse in 1986 (Figure 2(A)) can be reconstructed by connecting the foremost surfaces in the uppermost portion of the upper lava layer, which gives a rough estimation of missing rock volume at more than 8000 m3. The location of the reconstructed surface plane is approximately 8 m from the current waterfall lip (Figure 5), which is consistent with and slightly larger than the reported length of the waterfall recession created by the collapse (4 - 5 m). This discrepancy can be either by the uncertainties in the unknown method by which the reported recession distance was measured, or insufficient accuracy in the approximate surface reconstruction.
Although the measurement data is missing in the DEM at water surfaces with widths of approximately 8 m (Figure 5), the location of the waterfall lip can be estimated in the original point cloud because several exposed rock surfaces near the water indicate several points. The lip location appears to be depressed farther than the upper and middle parts of the surrounding cliff face, indicating that the surface water flow has been eroding the lip to some extent (Figure 5(d)). The lower part near the bottom of the upper lava layer exhibits a distinct depression, 8 m of which is more depressed than the lip. This depression has not been previously identified. The depth of the depression, compared to the adjacent horizontal profile 10 m above the measured cross section, is approximately 5 m. The approximate width and height of the depression are 40 m and 10 m, respectively. This depression behind the water drop likely developed after the collapse in 1986, because no such depression could be visually identified in photographs of the waterfall taken before 1986 (Figure 2(A)).
4.2. Stability Analysis of the Undercut Cliff
Figure 6 shows the relationships between the height of the cliff face and the critical notch length for various depths of vertical cracks (α) computed from Equation (5) by substituting the reported rock unit weight (γ) of 0.0026 kgf/cm3 and tensile rock strength (St) of 102 - 510 kgf/cm2, which is 1/5 - 1/25 of the andesite’s compressive strength (Sc) of 2550 kgf/cm2 [23]. The weaker value (102 kgf/cm2) of the tensile strength is applied here to examine the minimum notch length to cause collapse.
Stability analysis reveals a critical notch length (lc) of 112.6 - 251.8 m for the entire 97-m high cliff of Kegon Falls. At more than 100 m, this estimated critical notch length is considerably longer than the 26-m observed notch length beneath the lower agglomerate layer [34]; such a long notch length is not likely to be formed solely by underground outflow. The entire cliff face is stable until the vertical crack depth (α) reaches nearly 80% (Figure 6); however, such a long vertical crack is also unrealistic. Moreover, the critical notch length for the upper andesite layer with an h of 50 m is calculated to be lc = 80.8 to 180.8 m without vertical cracks, which also appears implausible. With an observed depression of 5 m at the bottom of the upper andesite layer, more than 90% of the vertical crack is necessary for collapse. However, as shown in the upper portion of the upper andesite layer, dense joints likely prevent development of such a long vertical crack in the cliff. For these reasons, a catastrophic collapse of the entire cliff face as described in the schematic model by Mino [34] unlikely occurs.
By using a typical height of 20 m for the fallen rock
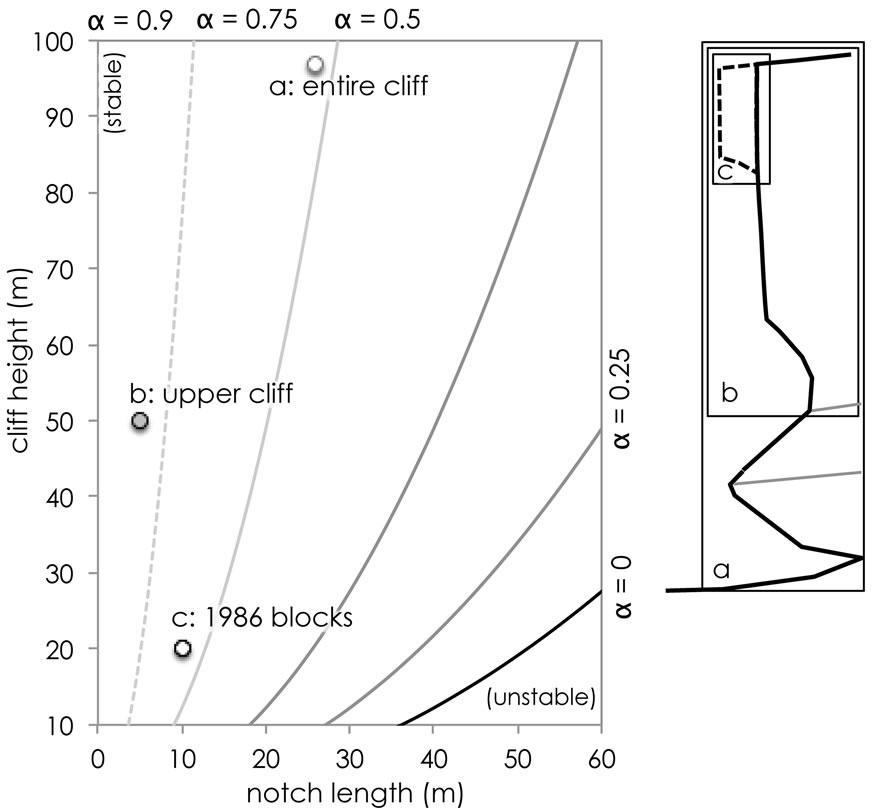
Figure 6. Stability of the entire cliff (a); upper andesite cliff (b); and uppermost andesite blocks (c) at Kegon Falls that collapsed in 1986 with regard to the notch length, cliff height, and the ratio of vertical crack depth to height (α).
blocks in 1986, stability analysis indicates a critical notch length for the collapse of the rock blocks of 51.1 - 114.3 m if no vertical crack exists. Compared with the actual depth of the fallen blocks of approximately 10 m, this estimated critical notch length is again excessively long to have caused the collapse; a vertical crack (α) of nearly 80% is necessary. Unlike that for the entire cliff or andesite layer, such a vertical crack could have developed along the platy joint planes, which is observed in the present surface morphology of the cliff face at the upper portion of the upper andesite layer.
5. Discussion
5.1. Responsibility of Joints and Cracks for the Rockfalls in 1986
Stability analysis indicates that the massive collapse (>8000 m3) of the upper andesite layer of the Kegon Falls cliff in 1986 could be attributed to vertical cracks that were developing in the upper andesite layer. On the surface of the cliff face of the upper andesite layer, several planar portions are observed to be aligned roughly north-south. This arrangement is consistent with the direction of the east-facing cliff around the waterfall, which is nearly perpendicular to the flow direction. These planes presently observed may reflect either of the following: 1) joint planes formed upon cooling of the andesite lava, or 2) gravitational cracks formed with cliff development. The first case is more likely because the upper andesite layer typically exhibits platy joints in the upper portion and columnar joints in the lower portion, as observed at the left-side cliff 150 m downstream of the waterfall [24]. Such joints, appearing as closed cracks with less weathering, are well aligned within the rock, as observed through a construction borehole inside the andesite layer. Although the exact direction of the platy joints within the andesite rock is unknown, the northsouth planar surfaces observed on the cliff face are consistent with the direction of the original lava flow from Mt. Nantai located north, and the cracks could have developed along such platy joints. Conversely, weathered, open cracks coloured reddish by oxidation are also observed within the upper andesite layer at a spacing of centimetres to decimetres [24]. These cracks are more randomly located but appear to be sloping toward the cliff face and may thus be related to gravitational forces toward the cliff face. The presence of these open and closed cracks within the andesite layer suggests that the development of vertical cracks within the upper andesite layer is plausible.
5.2. Implications for Erosional Mechanisms of the Waterfall
If the 5-m depression at the bottom of the upper andesite layer was formed after the 1986 rockfalls, the mean deepening rate of the depression for 25 years is 0.2 m/y. This deepening or erosion rate is one order higher than the 0.018 m/y long-term recession rate of the waterfall [23]. Such rapid local erosion may be affected by the abundant supply of splashes from the dropping water located on the slope of the upper agglomerate layer after the 8-m recession of the waterfall lip in 1986. Such an increase in the splash water could have enhanced freezethaw weathering at the bottom of the upper andesite layer, and weakened surface rocks at the cliff bottom could have readily collapsed and been removed by the groundwater outflow. Moreover, load from the dropping water on the upper agglomerate layer caused vertical erosion or scouring in the agglomerate rock slope, as is clearly observed in the field, and the erosion could have propagated upslope to cause instability in the base of the andesite layer.
Figure 7 shows a schematic model of morphological development of the waterfall cliff. After the collapse of the uppermost andesite rock block, the surface water began to drop onto the upper agglomerate layer (I), which caused scouring and upslope propagation of erosion of the upper agglomerate layer. The protruding portion, supported by the lower andesite layer, is being destroyed in part.

Figure 7. Schematic illustration of the development of the Kegon Falls cliff face.
Water splash from the dropping water on the upper agglomerate layer then caused freeze-thaw and wet-dry weathering in the base of the upper andesite layer where dense columnar joints dominate (II), and the depression was formed at the bottom of the andesite cliff. The rapid formation of the depression will be stabilized when the water drop completed scouring through the slope of the upper agglomerate layer, ending the supply of splash water. Erosion of the slope of the upper agglomerate layer and the bottom depression of the upper andesite cliff is also supported by the groundwater outflow from the boundary of the upper andesite and upper agglomerate layers.
The formation of the depression will be followed by its upward propagation due to gravitational minor rockfalls in the lower part of the upper andesite cliff containing columnar joints (III). This process may last significantly longer—at least not as fast as the formation of the depression—because the weathering of the andesite rock depends on freeze-thaw or wet-dry weathering with fewer water supplies. Concurrently, the lip of the waterfall can also be eroded to some extent by surface water flow, although little evidence has been obtained (IV). Cavitation may be responsible for this process because the maximum discharge at the waterfall is 94 m3/s, which appears sufficiently high to cause cavitation at the 8-mwide waterfall lip. It should be noted that this discharge is presently controlled at the water gate between the waterfall and the upstream lake; the natural maximum discharge could have been higher depending on lake level.
After the upward propagation of the minor rockfalls (III) and the development of a vertical crack within the andesite layer (V), the uppermost blocks of the andesite layer will finally collapse along the platy joints (VI). Thus, the processes of the erosion of Kegon Falls are variable in time and space, and both surface water and underground outflow are responsible for direct erosion and indirect effects on weathering of the rocks.
The long-term recession rate of 0.018 m/y indicates that a time period of 220 - 280 years is necessary for the entire Kegon Falls to recede 4 - 5 m. If the collapse of the upper blocks of the upper andesite layer occurs after the upward propagation of the depression together with the downward development of a vertical crack along joints within the rock, as was the case in 1986, the upward propagation of the depression (III) will continue for several hundreds of years. During this stage, rock blocks on the surface of cliffs surrounding the waterfall can also be destabilized, and small to large collapses will continue to occur in the surrounding cliffs.
6. Concluding Remarks
In this study, the first measurement of detailed morphology of the Kegon Falls waterfall cliff face was performed by using a TLS. The results indicate that the volume of the rockfall in 1986 was greater than approximately 8000 m3, and the associated recession distance of the waterfall lip was approximately 8 m. A clear depression was identified at the base of the upper andesite layer of the waterfall face, which could have been formed during the 25 years following the 1986 collapse of the waterfall lip at a rate of 0.2 m/y. Stability analysis indicates that a catastrophic collapse of the waterfall cliff with a long undercut notch is rare, while gradual collapses on the surface of the cliff along joints is more plausible. Erosional processes of the waterfall are variable in both space and time for several hundreds of years; therefore, such variability in the erosional processes of a single waterfall should be further examined through numerical modelling or physical experiments.
Although the upper andesite and agglomerate layers were essentially studied in this paper, the entire scope of Kegon Falls erosion can be revealed only through examination of additional erosional processes occurring in the lower andesite and agglomerate layers which can be affected by groundwater outflow beneath them, as well as at the waterfall lip where cavitation may be occurring. Multiple processes including rockfalls, surface water freefall load, freeze-thaw or wet-dry weathering, and cavitation at the lip seem all responsible for the erosion of the entire waterfall cliff. Moreover, spatial distribution of minor rockfalls can be identified if repeated TLS measurement of the cliff face is continued on an annual basis.
7. Acknowledgements
The author gratefully acknowledges the financial support in the form of a Grant-in-Aid for Young Scientists B (23701028) and A (25702014) received from the Japan Society for the Promotion of Science.
REFERENCES
- O. D. von Engeln, “A Particular Case of Knickpunkte,” Annals of the Association of American Geographers, Vol. 30, No. 4, 1940, pp. 268-271,281-284. doi:10.2307/2560885
- R. W. Young, “Waterfalls: Form and Process,” Zeitschriftfür Geomorphologie NF Supplementband, Vol. 55, 1985, pp. 81-95.
- S. S. Philbrick, “Horizontal Configuration and the Rate of Erosion of Niagara Falls,” Geological Society of America Bulletin, Vol. 81, No. 12, 1970, p. 3723. doi:10.1130/0016-7606(1970)81[3723:HCATRO]2.0.CO;2
- R. M. Derricourt, “Retrogression Rate of the Victoria Falls and the Batoka Gorge,” Nature, Vol. 264, 1976, pp. 23-25. doi:10.1038/264023a0
- B. Crosby and K. Whipple, “Knickpoint Initiation and Distribution within Fluvial Networks: 236 Waterfalls in the Waipaoa River, North Island, New Zealand,” Geomorphology, Vol. 82, No. 1-2, 2006, pp. 16-38. doi:10.1016/j.geomorph.2005.08.023
- Y. S. Hayakawa, S. Yokoyama and Y. Matsukura, “Erosion Rates of Waterfalls in Post-Volcanic Fluvial Systems around Aso Volcano, Southwestern Japan,” Earth Surface Processes and Landforms, Vol. 33, No. 5, 2008, pp. 801- 812. doi:10.1002/esp.1615
- P. Bishop and G. Goldrick, “Morphology, Processes and Evolution of Two Waterfalls near Cowra, New South Wales,” Australian Geographer, Vol. 23, No. 2, 1992, pp. 116-121. doi:10.1080/00049189208703061
- Z. Alexandrowicz, “Geologically Controlled Waterfall Types in the Outer Carpathians,” Geomorphology, Vol. 9, No. 2, 1994, pp. 155-165. doi:10.1016/0169-555X(94)90073-6
- Y. Hayakawa and Y. Matsukura, “Recession Rates of Waterfalls in Boso Peninsula, Japan, and a Predictive Equation,” Earth Surface Processes and Landforms, Vol. 28, No. 6, 2003, pp. 675-684. doi:10.1002/esp.519
- P. Bishop, T. B. Hoey, J. D. Jansen and I. L. Artza, “Knickpoint Recession Rate and Catchment Area: The Case of Uplifted Rivers in Eastern Scotland,” Earth Surface Processes and Landforms, Vol. 30, No. 6, 2005, pp. 767-778. doi:10.1002/esp.1191
- T. W. Gardner, “Experimental Study of Knickpoint and Longitudinal Profile Evolution in Cohesive, Homogeneous Material,” Geological Society of America Bulletin, Vol. 94, No. 5, 1983, pp. 664-672. doi:10.1130/0016-7606(1983)94<664:ESOKAL>2.0.CO;2
- A. Bigi, L. E. Hasbargen, A. Montanari and C. Paola, “Knickpoints and Hillslope Failures: Interactions in a Steady-State Experimental Landscape,” Geological Society of America Special Paper, Vol. 398, 2006, pp. 295- 307.
- K. L. Frankel, F. J. Pazzaglia and J. D. Vaughn, “Knickpoint Evolution in a Vertically Bedded Substrate, Upstream-Dipping Terraces, and Atlantic Slope Bedrock Channels,” Geological Society of America Bulletin, Vol. 119, No. 3-4, 2007, pp. 476-486. doi:10.1130/B25965.1
- M. P. Lamb and W. E. Dietrich, “The Persistence of Waterfalls in Fractured Rock,” Geological Society of America Bulletin, Vol. 121, No. 7-8, 2009, pp. 1123-1134. doi:10.1130/B26482.1
- A. D. Howard, W. E. Dietrich and M. A. Seidl, “Modeling Fluvial Erosion on Regional to Continental Scales,” Journal of Geophysical Research, Vol. 99, No. B7, 1994, pp. 13971-13986. doi:10.1029/94JB00744
- J. D. Niemann, N. M. Gasparini, G. E. Tucker and R. L. Bras, “A Quantitative Evaluation of Playfair’s Law and Its Use in Testing Long-Term Stream Erosion Models,” Earth Surface Processes and Landforms, Vol. 26, No. 12, 2001, pp. 1317-1332. doi:10.1002/esp.272
- M. M. Berlin and R. S. Anderson, “Modeling of Knickpoint Retreat on the Roan Plateau, Western Colorado,” Journal of Geophysical Research, Vol. 112, No. F3, 2007, pp. 1-16. doi:10.1029/2006JF000553
- I. Haviv, Y. Enzel, K. X. Whipple, E. Zilberman, A. Matmon, J. Stone and K. L. Fifield, “Evolution of Vertical Knickpoints (Waterfalls) with Resistant Caprock: Insights from Numerical Modeling,” Journal of Geophysical Research, Vol. 115, No. F3, 2010, pp. 1-22. doi:10.1029/2008JF001187
- G. K. Gilbert, “Rate of Recession of Niagara Falls,” U.S. Geological Survey Bulletin, Vol. 306, 1907, pp. 1-31.
- G. Vastola, “Asymmetric Crack Propagation near Waterfall Cliff and Its Influence on the Waterfall Lip Shape,” EPL (Europhysics Letters), Vol. 96, No. 4, 2011, Article ID: 49002.
- M. P. Lamb, A. D. Howard, W. E. Dietrich and J. T. Perron, “Formation of Amphitheater-Headed Valleys by Waterfall Erosion after Large-Scale Slumping on Hawai’i,” Geological Society of America Bulletin, Vol. 119, No. 7-8, 2007, pp. 805-822. doi:10.1130/B25986.1
- Y. S. Hayakawa and Y. Matsukura, “Factors Influencing the Recession Rate of Niagara Falls since the 19th Century,” Geomorphology, Vol. 110, No. 3-4, 2009, pp. 212- 216. doi:10.1016/j.geomorph.2009.04.011
- Y. Hayakawa and Y. Matsukura, “Recession Rates of Kegon Falls in Nikko, Tochigi Prefecture, Japan,” Journal of Geography (Tokyo), Vol. 112, No. 4, 2003, pp. 521-530.
- Tochigi Prefecture, “Report of the Government Subsidy Survey for Erosion Controls in Volcanoes,” Tochigi Prefecture, Utsunomiya, 2001.
- G. L. Heritage and A. R. G. Large, “Laser Scanning for the Environmental Sciences,” Wiley-Blackwell, Chichester, 2009.
- D. J. Milan, G. L. Heritage and D. Hetherington, “Application of a 3D Laser Scanner in the Assessment of Erosion and Deposition Volumes and Channel Change in a Proglacial River,” Earth Surface Processes and Landforms, Vol. 32, No. 11, 2007, pp. 1657-1674. doi:10.1002/esp.1592
- N. J. Rosser, D. N. Petley, M. Lim, S. A. Dunning and R. J. Allison, “Terrestrial Laser Scanning for Monitoring the Process of Hard Rock Coastal Cliff Erosion,” Quarterly Journal of Engineering Geology and Hydrogeology, Vol. 38, No. 4, 2005, pp. 363-375. doi:10.1144/1470-9236/05-008
- B. D. Collins and N. Sitar, “Processes of Coastal Bluff Erosion in Weakly Lithified Sands, Pacifica, California, USA,” Geomorphology, Vol. 97, No. 3-4, 2008, pp. 483- 501. doi:10.1016/j.geomorph.2007.09.004
- M. Sturzenegger, D. Stead and D. Elmo, “Terrestrial Remote Sensing-Based Estimation of Mean Trace Length, Trace Intensity and Block Size/Shape,” Engineering Geology, Vol. 119, No. 3-4, 2011, pp. 96-111. doi:10.1016/j.enggeo.2011.02.005
- M. A. O’Neal and J. E. Pizzuto, “The Rates and Spatial Patterns of Annual Riverbank Erosion Revealed through Terrestrial Laser-Scanner Surveys of the South River, Virginia,” Earth Surface Processes and Landforms, Vol. 36, No. 5, 2011, pp. 695-701. doi:10.1002/esp.2098
- T. A. Wasklewicz and T. Hattanji, “High-Resolution Analysis of Debris Flow-Induced Channel Changes in a Headwater Stream, Ashio Mountains, Japan,” The Professional Geographer, Vol. 61, No. 2, 2009, pp. 231-249. doi:10.1080/00330120902743225
- A. Viero, G. Teza, M. Massironi, M. Jaboyedoff and A. Galgaro, “Laser Scanning-Based Recognition of Rotational Movements on a Deep Seated Gravitational Instability: The Cinque Torri Case (North-Eastern Italian Alps),” Geomorphology, Vol. 122, No. 1-2, 2010, pp. 191-204. doi:10.1016/j.geomorph.2010.06.014
- T. Suzuki, M. Okuno and Y. Hayakawa, “Eruption History of Volcanoes in Nikko,” Geekan Chikyu, Vol. 16, 1994, pp. 215-220.
- Y. Mino, “On the Kegon Water-Fall in Nikko, Tochigi Pref,” Miscellany of Reports for Celebrating Professor H. Fujimoto’s 60th Birthday, 1958, pp. 344-363.
- S. P. Timoshenko and J. M. Gere, “Mechanics of Materials,” Van Nostrand Reinhold Co., New York, 1978.
- C. R. Thorne and N. K. Tovey, “Stability of Composite River Banks,” Earth Surface Processes and Landforms, Vol. 6, No. 5, 1981, pp. 469-484. doi:10.1002/esp.3290060507
- T. K. S. Abam, “Genesis of Channel Bank Overhangs in the Niger Delta and Analysis of Mechanisms of Failure,” Geomorphology, Vol. 18, No. 2, 1997, pp. 151-164. doi:10.1016/S0169-555X(96)00010-4
- Y. Matsukura, “Cliff Instability in Pumice Flow Deposits Due to Notch Formation on the Asama Mountain Slope, Japan,” Zeitschrift fuer Geomorphologie, Vol. 32, 1988, pp. 129-141.
- T. Kogure, H. Aoki, A. Maekado, T. Hirose and Y. Matsukura, “Effect of the Development of Notches and Tension Cracks on Instability of Limestone Coastal Cliffs in the Ryukyus, Japan,” Geomorphology, Vol. 80, No. 3-4, 2006, pp. 236-244. doi:10.1016/j.geomorph.2006.02.012
- T. Sunamura, “Geomorphology of Rocky Coasts,” John Wiley & Sons, Chichester, 1992.