International Journal of Geosciences
Vol. 4 No. 4 (2013) , Article ID: 33351 , 8 pages DOI:10.4236/ijg.2013.44062
The Fracture Density and Fractal Dimension Prediction Based on Support Vector Machine
1State Key Laboratory of Oil and Gas Reservoir Geology and Exploitation of Southwest Petroleum University, Chengdu, China
2CNOOC Shanghai Branch, Shanghai, China
Email: zhaoleo927@foxmail.com
Copyright © 2013 Lei Zhao et al. This is an open access article distributed under the Creative Commons Attribution License, which permits unrestricted use, distribution, and reproduction in any medium, provided the original work is properly cited.
Received March 11, 2013; revised April 13, 2013; accepted May 12, 2013
Keywords: Fractured Reservoir; Support Vector Machine; Fracture Density; Fractal Dimension; MATLAB
ABSTRACT
The key of effective development for the fractured reservoir is to describe the distribution of the fracture and build the fracture geological model. To acquire more optimal exploration and development of the oilfield, objective geologic model of reservoir fractures is needed for further knowledge of the spatial distribution condition of fractures. Adopting well-logging and seismic techniques can be expensive and usually yield multiple solutions, yet resolution will disturb the seismic method, making it difficult to acquire accurate and sound fracture parameters from seismic data. In this paper, the theoretical foundation for support vector machine, fractal geometry, combined the various information in geology, logging, well core, seism and field outcrop about the fracture and calculate the parameters of the fracture (fracture density and fractal dimension), and the good foundation is established for fractured reservoir description of discrete fracture network model. Based on analysis of conventional prediction methods of development indices and factor influencing the parameters of the fracture, a support vector machine method is established to predict the parameters of the fracture. The new support vector machine method is based on time series analysis to select the kernel function. Trains and tests the support vector machine network with historical data to construct the support vector regression prediction model. A case was fit into the model to test and analyse its reliability, the results suggested that the model had a high prediction performance, and could be well applied to the prediction of fracture parameters.
1. Introduction
A considerable part of proven reserves in the world comes from fractured reservoirs, which occupied a large proportion of the oil and gas output among nations. In China, fractured reservoirs have quite a substantial oil and gas reserves. Strong anisotropy is one important feature that fractured reservoirs have, the rich cracks and pores in this kind of reservoir offer various shapes to the reservoir space, making the exploitation rather difficult. The existence of rich cracks in the reservoir affects the efficiency of oil exploration in a significant way. On one hand, with a large amount of cracks in the reservoir to help boost the seepage flow, the oil recovery efficiency can be increased efficaciously, which is good. But on the other hand, abundant cracks in reservoirs usually cause water flooding, lowering the oil recovery efficiency. It’s undeniable that an important reason to the loss of the exploitable reserves in fractured reservoirs is that the distribution method of the cracks is too complex for people to grasp. Learning this, we can gather that a good and thorough study on the features of the cracks—aiming at accurate description and predicting of the features—is of crucial importance to the efficient exploitation of fracture reservoirs [1].
So far, however, there is no sound system available to be used to accurately describe fractured reservoirs and to build models of them. After comparing plenty mathematical models of this sort, the discrete fracture network (DFN) model is found most suited to describe fractured reservoirs, be numerical simulated, and mirror the anisotropy of the reservoirs. The building of a DFN model is complicated, it starts from calculating the characteristic parameters of the cracks from previously measured data, and then comes out with a characteristics distribution function, and forms a fracture network in the end. In the predicting of the parameters of the fractures, most researchers adopted data from logging and seismic technique. But as is known to all, logging and seismic technique have their drawbacks such as high cost, low resolution ratio and multiple solutions. Due to this, relying solely on these two methods we can neither get fracture parameters efficiently nor build the fracture network model accurately. In this paper, a support vector regression machine method is presented to solve the problem logging and seismic techniques have in describing fractures. And in order to meet the challenge of choosing proper SVR kernel function and parameters, a new SVR kernel function selecting method based on the characteristics of time series analysis is presented as well. The correlation between the fracture characteristic parameters and their influencing factors, the prediction accuracy of the model and its reliability are all considered in this method. It integrates the seismic and logging environment, their data, the data analysts’ knowledge and the processing results of the input data. For those well sections that have core and imaging logging data, fracture dip, azimuth, fracture density and fractal dimension value can be calculated, and the results of these calculations can be applied to areas without these data to establish a support vector regression machine network and calculate the well point fracture density and the fractal dimension value of it.
2. Basic Theory of Support Vector Regression and Its Improvement
2.1. Support Vector Regression Principles
Support Vector Machine (SVM) was first widely used in the field of pattern recognition. After the mathematician Vapnik introduced  no sensitive loss function into the support vector machine, SVM systems was expanded to solve the problem of regression estimation of nonlinear systems that have very excellent learning performance. A new prediction method called support vector regression (SVR) was produced. The idea of the method is to obtain a better model generalization ability by map the input variables from the primal space to higher dimensional feature space, and through nonlinear mapping
  to construct a linear decision-making (regression) function. This method controls the learning accuracy and the reliability of sample well, and the linear regression will finally complete [2].
General regression problem can be described by the following mathematical model:
 (1)
(1)
where T represents the training sample set,  ,
,  ,
, .
.
T is independent and identically distributed data sets selected based on probability distribution  of x × y. Assuming the loss function is
  which is given value. In the case of the expected risk
  is the minimum value, obtained regression function
 . Where
  is a non-linear mapping, it mapped the data x to a high dimensional feature space and w is weight vector.
Support vector regression (SVR) is a powerful technique for solving the regression problem.
2.2. The Improvement of Support Vector Regression
The selection of the parameters of SVR model decides its generalization performance. In a SVR model it contains two sorts of parameters: the basic parameters and kernel function related parameters. Most scholars have adopted empirical function method, Bayesian method and Crossvalidation method to calculate C and prediction error  [3]. Yet presently there’s no ideal method in choosing kernel function through way of theoretical basis, but only by repeatedly modifying the model itself [4,5], which means the polynomial kernel function, radial basis function (RBF), Sigmoid kernel function have to be tested, their accuracy of predicting be compared, and then the one with the best accuracy is chosen to be the ultimate kernel function. The drawback of this method is that the whole process could be time-consuming and frustrating, yet the input information will not be efficiently used.
In this paper, a new kernel function selecting methodTime series analysis method is proposed. In this method, the SVR kernel function could be selected on the basis of the statistical analysis of a data set. Considering the basic idea of SVR and the characteristics of its kernel function,  should be used to replace the non-lineal mapping
  in order to compute the prediction indices.
Considering this, to select the kernel function on the basis of the time-series graph of prediction indices makes sense, and it ensures that the computed values of the prediction indices conform to the trend of the historical data. Suppose that  is the kernel function,
  is the feature mapping of k, and k gives a pseudo-distance to input space
 , which stands for the measure of similarity between x and
 . In addition, it’s feasible and effective to select the kernel function by analyzing and comparing the characteristics of the data sample set in the regression problem. If the time-series graph appears to have a trend variation, then a linear kernel function or a polynomial kernel function will fit to be the SVR kernel function; if the time-series graph appears to move or vary in a periodic or seasonal way, then a Sigmoid kernel function will fit to be the SVR kernel function; if the time-series graph appears to move in an irregular or random way, an RBF kernel function will fit to be the SVR kernel function.
3. Fractal Geometry of the Fracture Size
The self-similarity of non-continuity of objects and different scales can be quantitatively described based on fractal geometry. Fractal geometry has been widely used in various aspects of fracture characteristics description such as the description of crack length, opening degree of clustering of fractures, fracture branching and growth. For interval with core and imaging log data, fractal theory can be used to calculate the fractal dimension values to describe the fracture characteristics [6]. Self-similarity describe both the part and whole of object has the same complex structure, and which use the fractal dimension to describe the complex degree. Scientist Falque by research on various types of fractal phenomena, definition of fractal dimension is as follows:
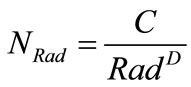 (2)
(2)
which  is characteristic number, Rad is geometrical magnitude, D is fractal dimension, and C is constant [7].
The area perimeter method, the box method, index spectrum variorum method are commonly used to determine the fractal dimension. One of the main methods is box method that uses the graphical method to determine the fracture fractal dimension. This method uses core, imaging logging and outcrop and seismic data, which by examining the fracture trace to determine the fractal dimension. The fracture system is contained in a length of (L0) square area, by checking fractures the area is divided into  boxes which length is l,
  is the number of boxes intersect with fractures or contains fractures (Figure 1), the expression can be obtained from the Equation (2):
 (3)
(3)
Which D is fractal dimension, and C is proportionality coefficient. Through drawing logarithmic curve of the number of boxes and , we can get the slope of the straight line (Figure 2), and fractal dimension D is finally obtained by divide the value by C.
The above method is used to determine the fracture fractal dimension, can accurately generate discrete fracture network [8]. This paper adopts the method of support vector machine (SVM) and the box method to determine the fractal dimension: First, calculate the fractal dimension by using the box method through to the core and imaging log data of well point; then predict the fractal dimension combine SVM with other data on different wells at the point.
4. The Establishment of the Support Vector Machine Model
Step 1: Determine the SVR model input parameters and
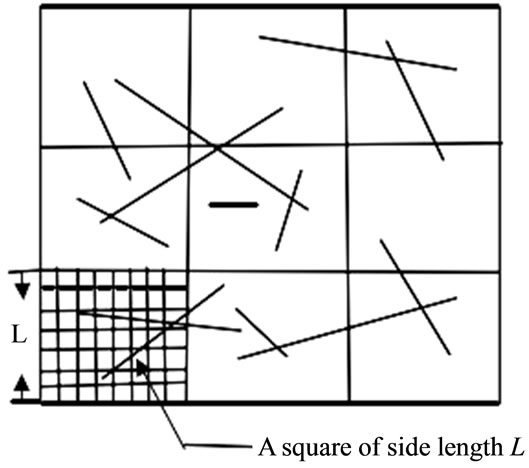
Figure 1. Box method for solving fractional dimension.
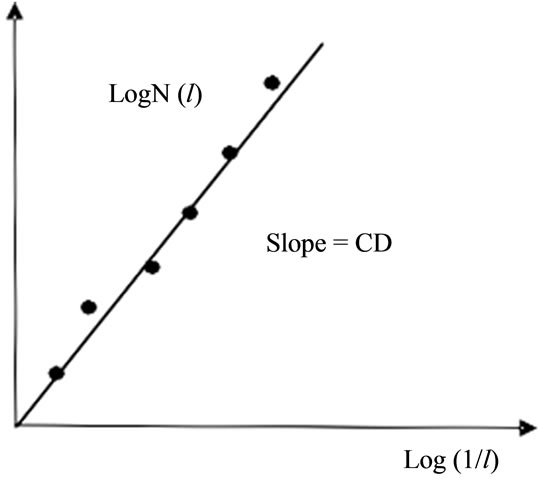
Figure 2. Fractal dimension & logarithmic coordinates linear regression.
output indicators.
Do the correlation analysis of fracture parameters and its influence factors, select indicators that reflect the fracture characteristics and its influencing factors as support vector regression model input parameters and output indicators.
Step 2: Build the Support vector regression prediction model.
1) Enter the training sample sets ,
,  is the sample I in influencing factors samples,
  is the sample I in predictor variables. The obtained data were normalized before calculation.
2) Determine the parameters C,  , the kernel function
  of SVR model.
3) Construct the optimization problems
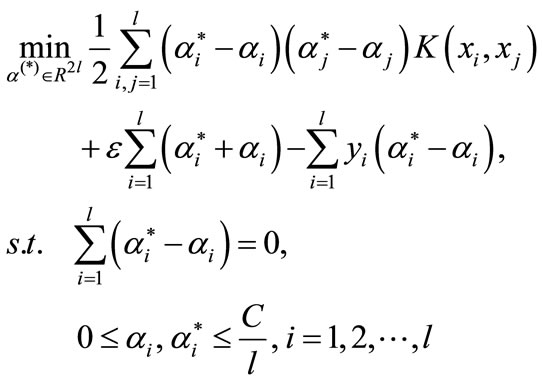 (4)
(4)
The first term is Kernel function related item, the second term is Error term , the third term is Samples related item. Which ,
,  is Lagrange multiplier; C is penalty factor, it is a constant, it indicates that the bigger the value, the bigger the punishment fitting deviation;
  is the maximum allowable error of regression.
4) Solve the optimization problem, get the optimal Lagrange multiplier .
.
5) Minimize the expected risk  of regression function are obtained
 (5)
(5)
which , calculate b by follow ways: Select between
  and
and  in the open interval
 , if the election is
 , then
 ; else if the election is
 , then
 .
.
6) Substitute test set data generation into the input layer to inspect decision function, if it can reach expected precision, the fracture characteristics parameters prediction model is obtained; otherwise, return to step (2) to modify parameter values and kernel function.
Step 3: Step 2 is used to get the characteristic parameters of fractures forecasting model to forecast characteristic parameters.
Enter the value of the fracture characteristics indicators influencing factors, the prediction model for the prediction of the indicators derived above.
5. Case Study
According to the SVR algorithm described in the previous section, SVR program compiled with MATLAB was used in a certain domestic oilfield H5 block, selected 49 sets of data for the training parameters and 19 sets of data selected for comparison samples used to verify the reliability of the model [9]. The clear flow chart to the process is followed (Figure 3).
Step 1: Parameter selection:
Input layer parameters used in the SVM training mainly are:
1) Logging data: acoustic travel time (AC), MINV (RLML), micro normal (RNML), gamma ray (GR), resistivity curve (RT), caliper (CAL), flushed zone resistivity curve (RXO), litho-density (DEN), shaliness (SH), neutron porosity (CNL);
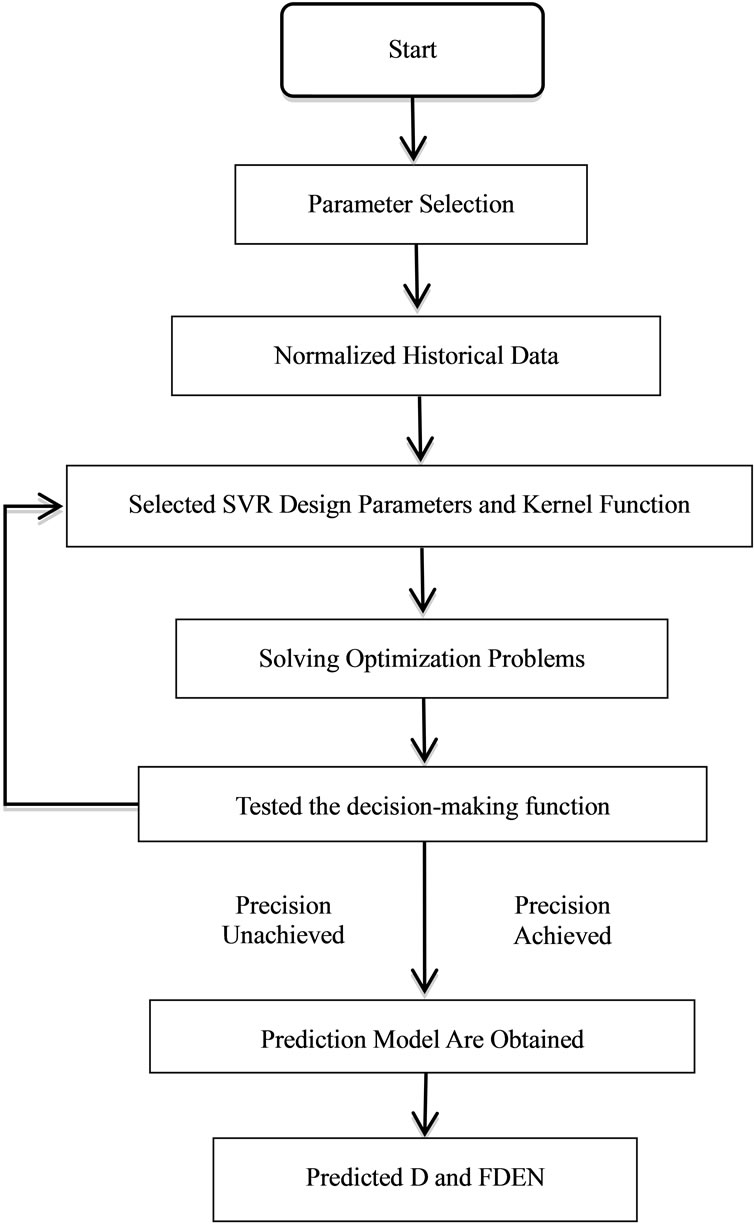
Figure 3. The clear flow chart to the process.
2) Seismic data: Instantaneous frequency (f), instantaneous phase (ph), seismic velocity (v), amplitude (Am), absorption coefficient (Abs).
According to the correlation analysis method based on fracture attribute parameters and influencing factors, determined fractal dimension and the impact factor of the well point fracture density are: Logging data parameters (AC, RLML, RNML, RT, RXO, DEN, SH, CNL) and seismic data parameters (f, v, Am). Training sample values are shown in Table 1.
Output parameters are predicted fractal dimension (D) and fracture density (FDEN).
Step 2: Established SVR forecasting models of D and FDEN separately:
1) Normalized historical data of D, FDEN and influencing factors, and select the top 40 groups of data as the training set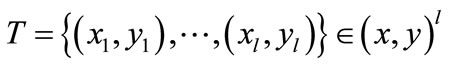 , where
 ,
,  ,
, ; select the last nine samples as the test set, wherein
  represents the sample I of factors set which affected D and FDEN, and
  represents the sample I of D and FDEN.
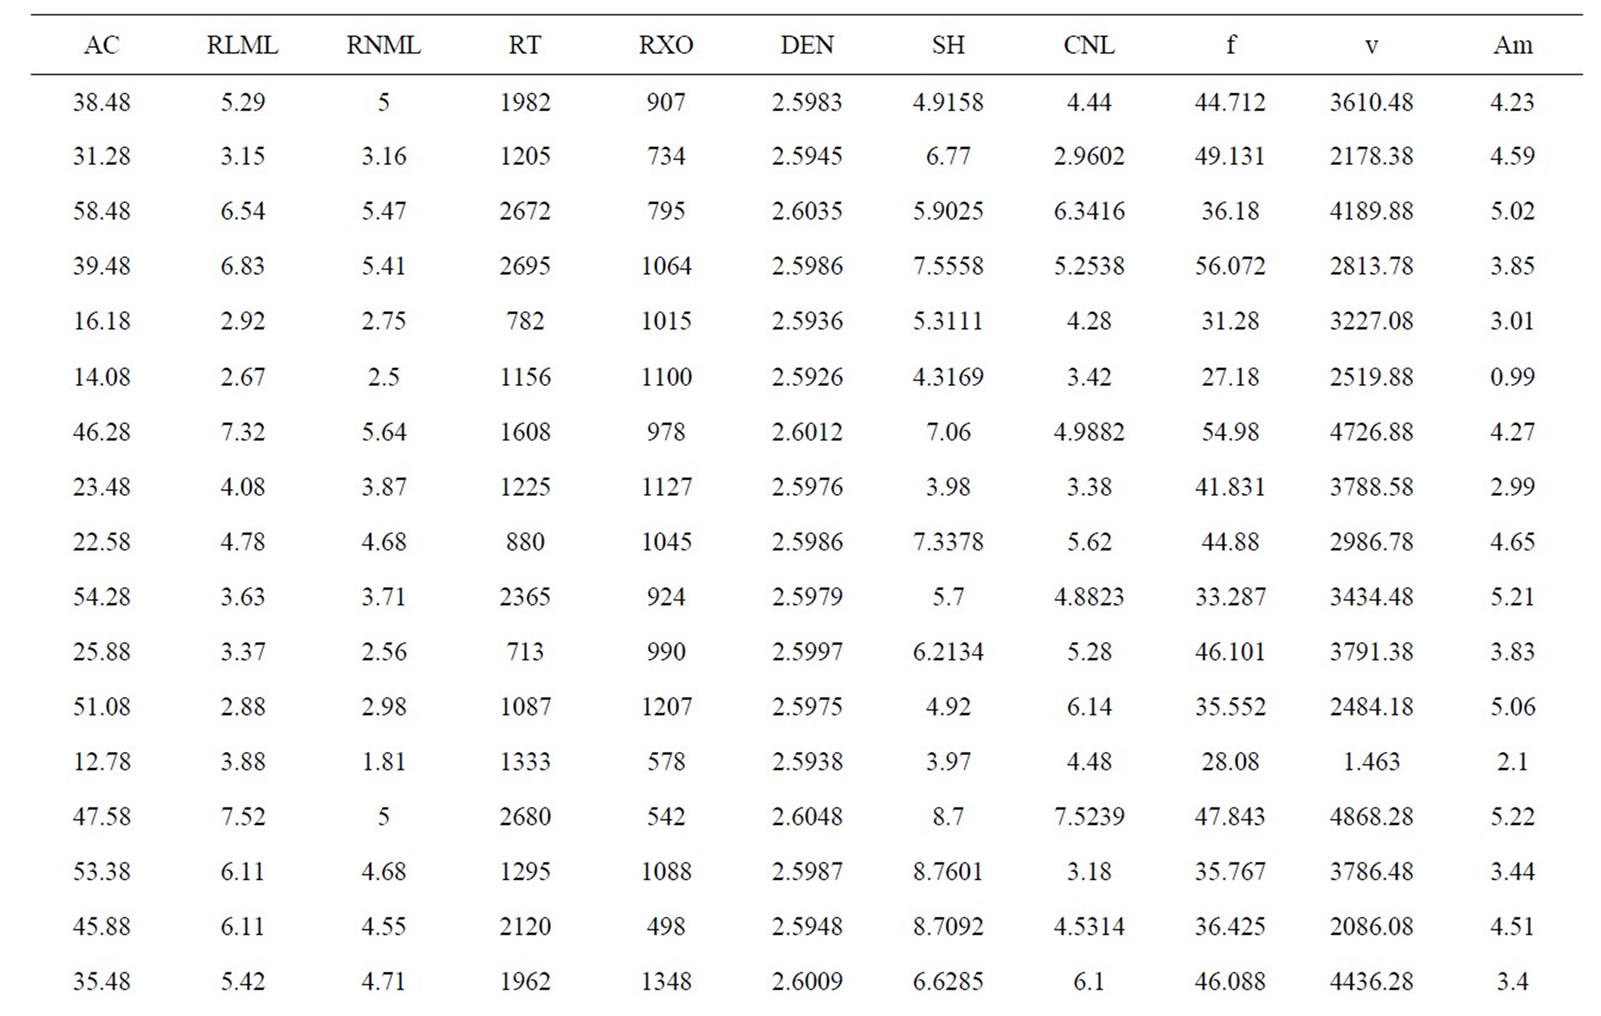
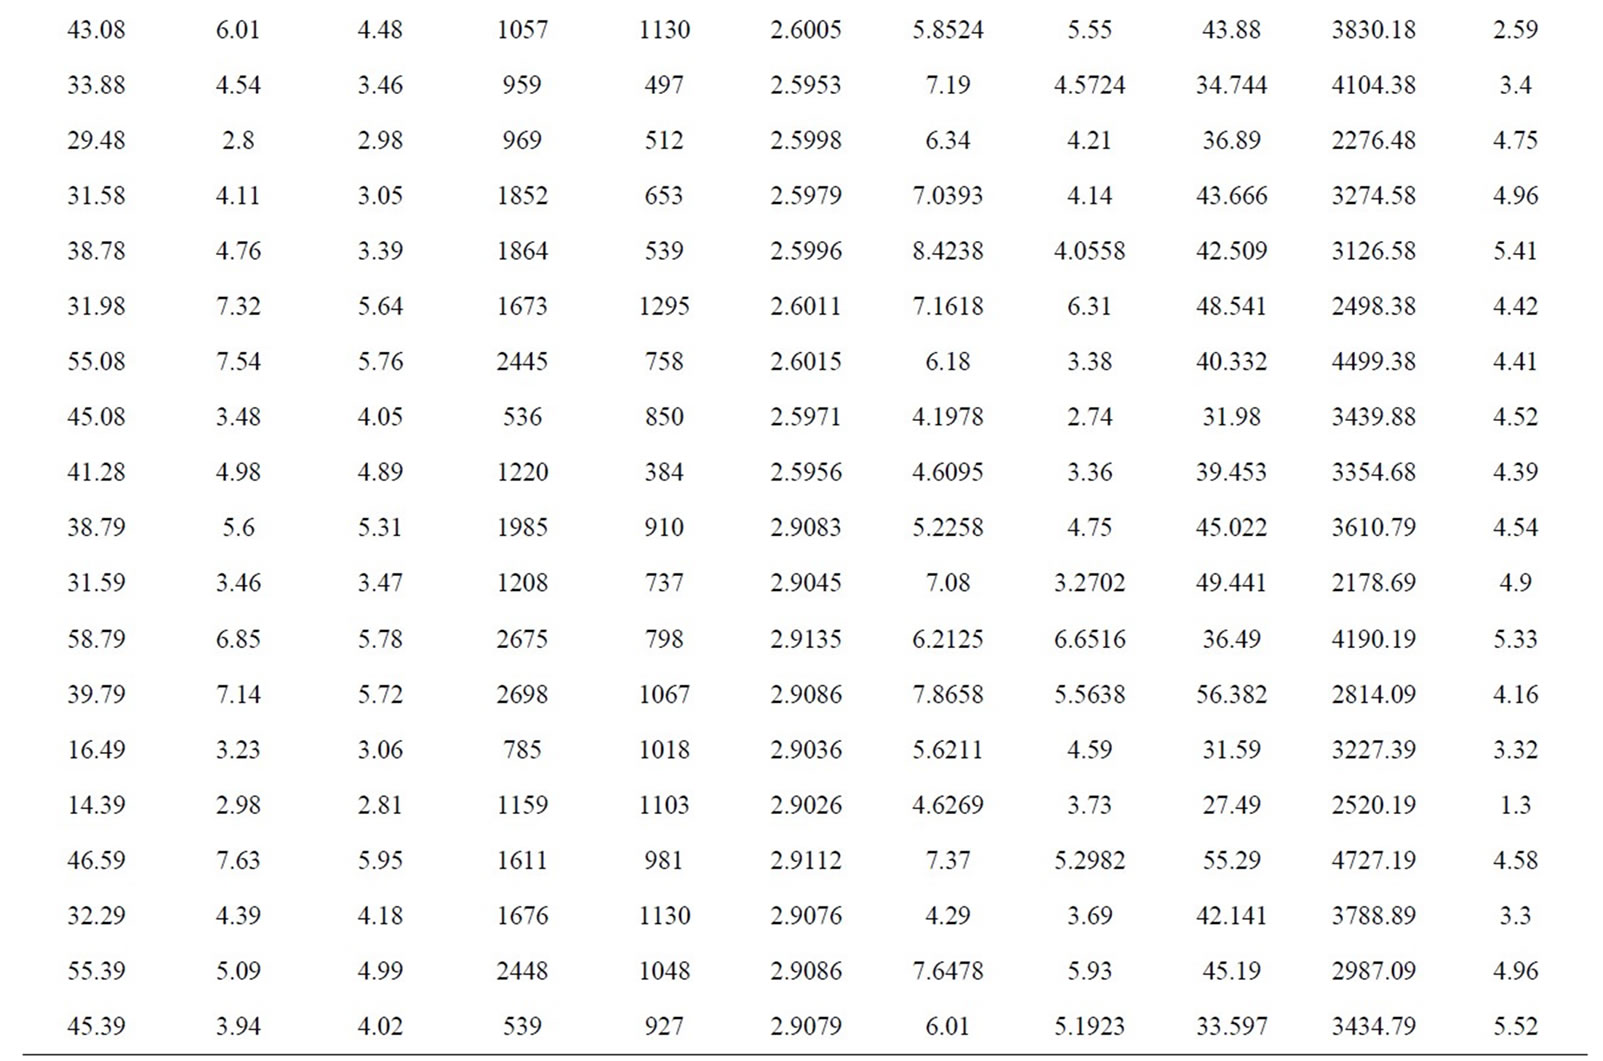
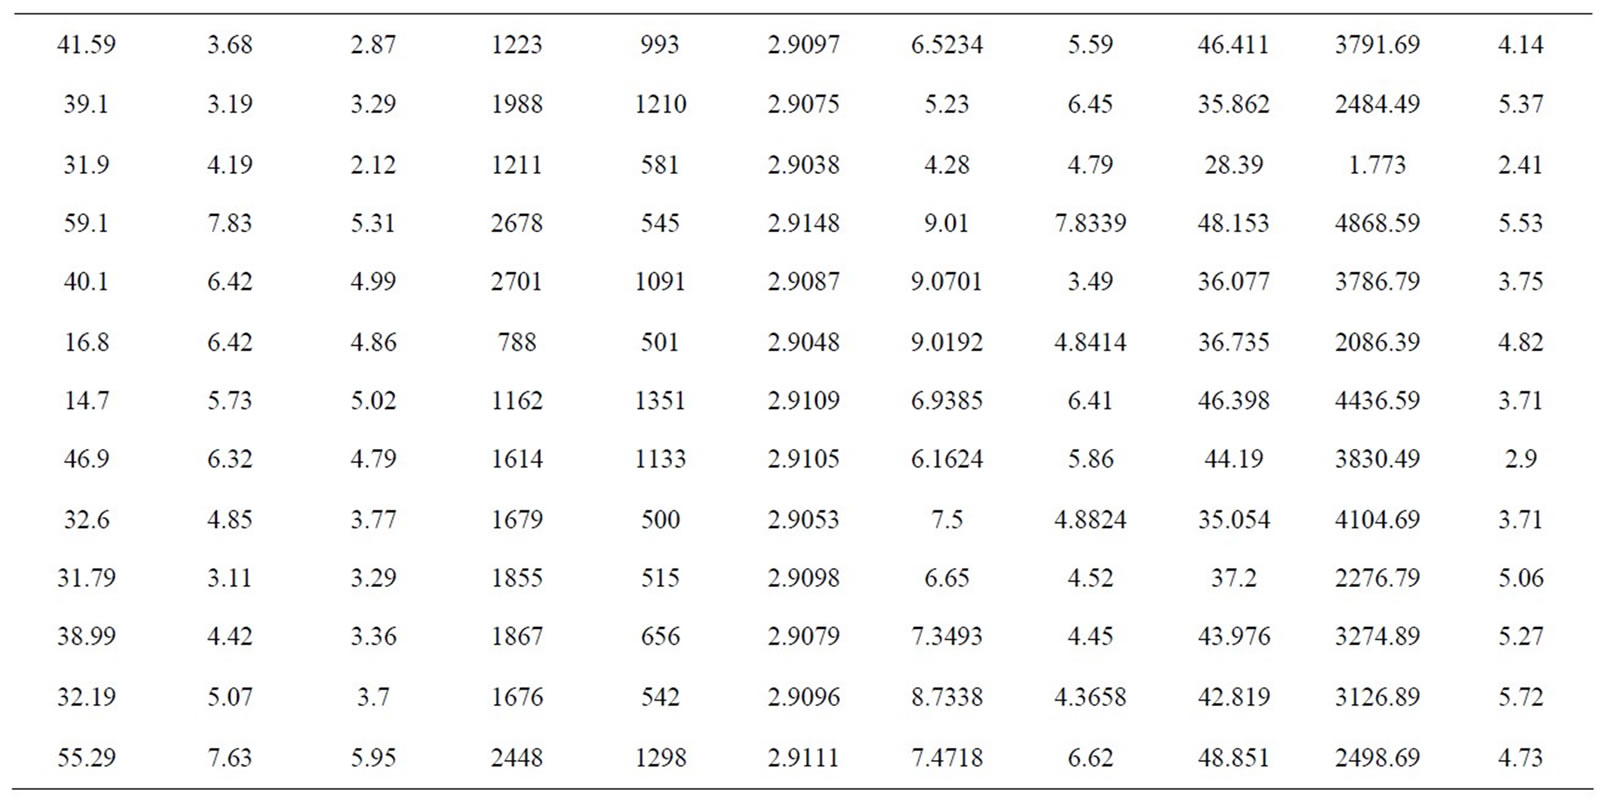
Table 1. Logging and seismic parameters.
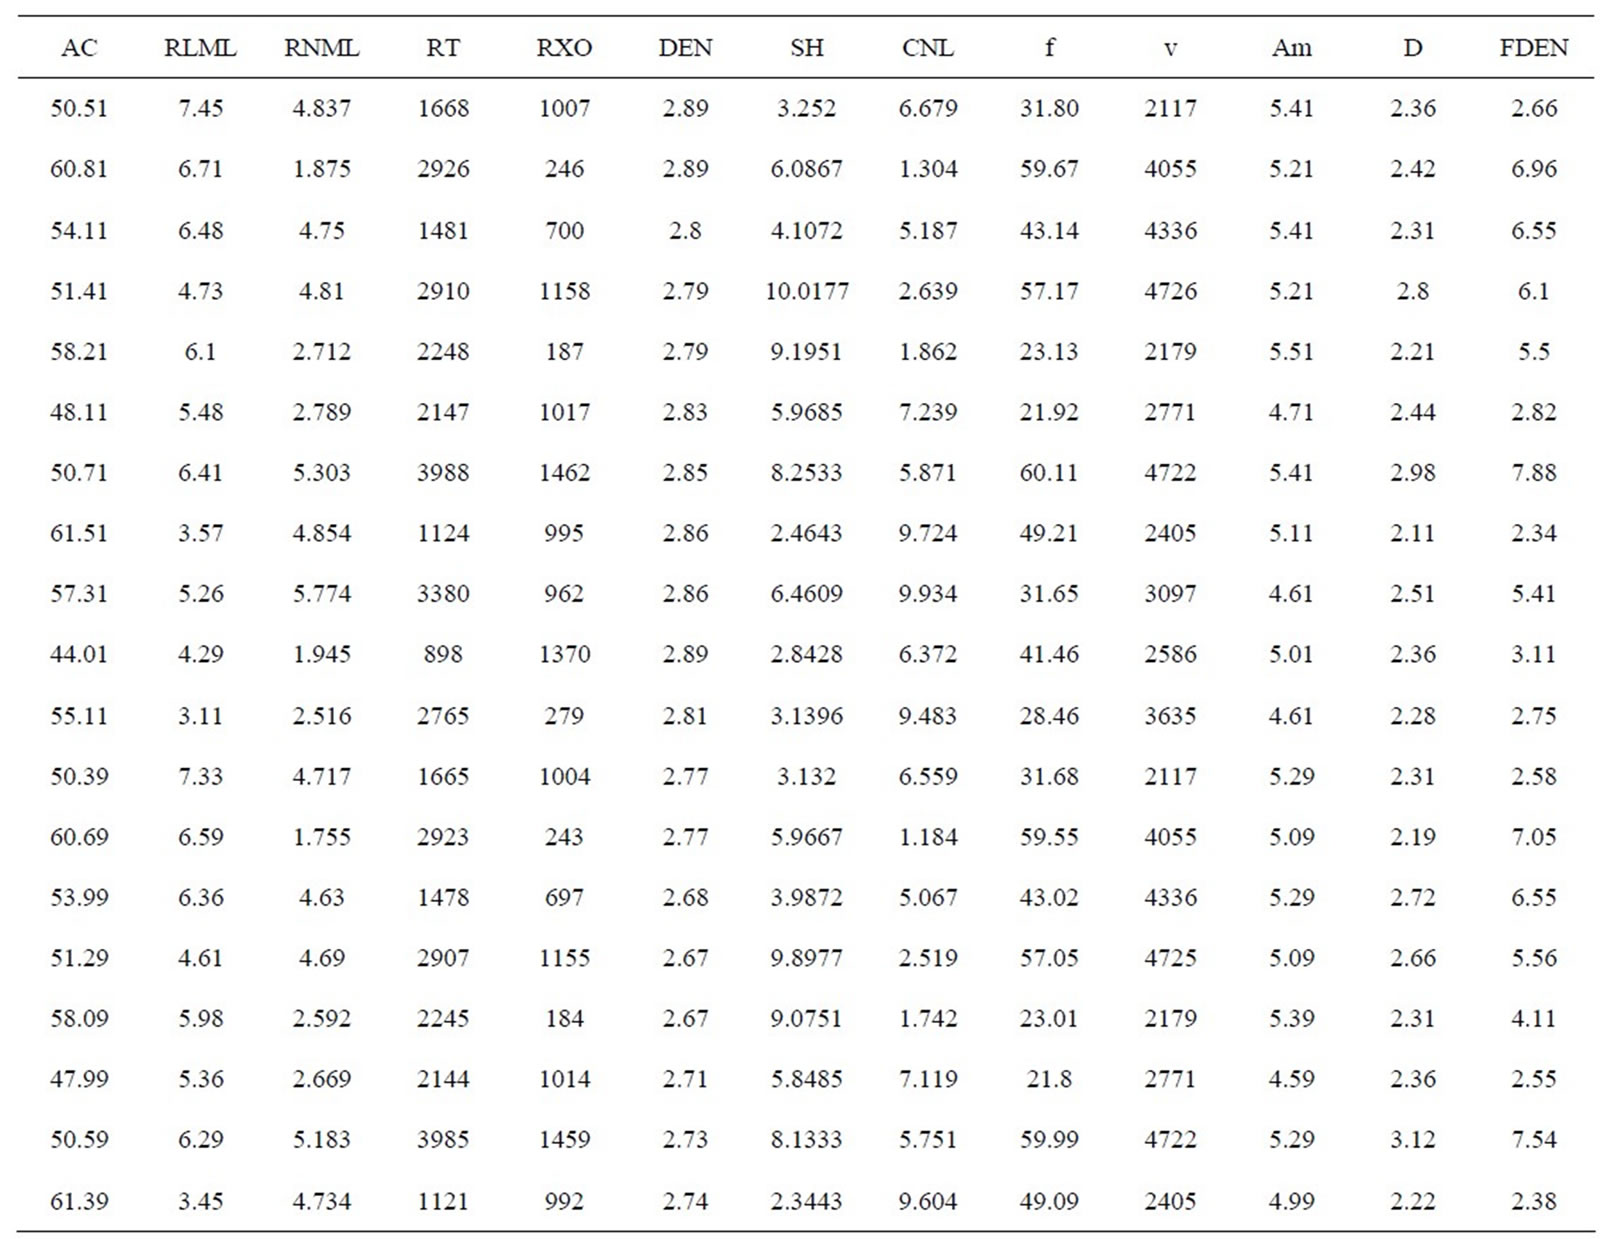
Table 2. Support vector machine network forecast results.
2) Selected SVR design parameters and kernel function.
This example used the empirical formula method:
 and
and , taking
0.012,  [10]. Select the kernel function using characteristic analysis of time series. The time series of D and FDEN are random variation, so Radial Basis Function (RBF) kernel function was selected, Wherein the parameter
 .
.
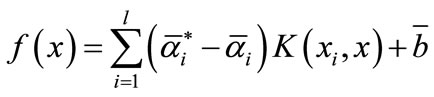
3) Optimized problem (1) and solved the optimal solution  using programmed software, then obtained
  and constructed a decision function
 , where the corresponding sample which
  is not equal to zero is support vector.
4) Tested the decision-making function using a test set of data, support vector machine prediction model are obtained if reached the desired accuracy, if not, modify and adjust the design parameters and kernel function.
Step 3: Predicted D and FDEN:
Entered the influencing factors predictive value of D and FDEN separately, predicted D and FDEN using the prediction model previously obtained, prediction samples are shown in Table 2. Prediction accuracy of D in support vector machine model is 94.81%, and prediction accuracy of FDEN is 95.65%, High precision proved that the model has good extension potential. Comparative analysis of measured and predicted values are shown in Figures 4 and 5.
6. Conclusion
Since the core and imaging logging data is very limited,
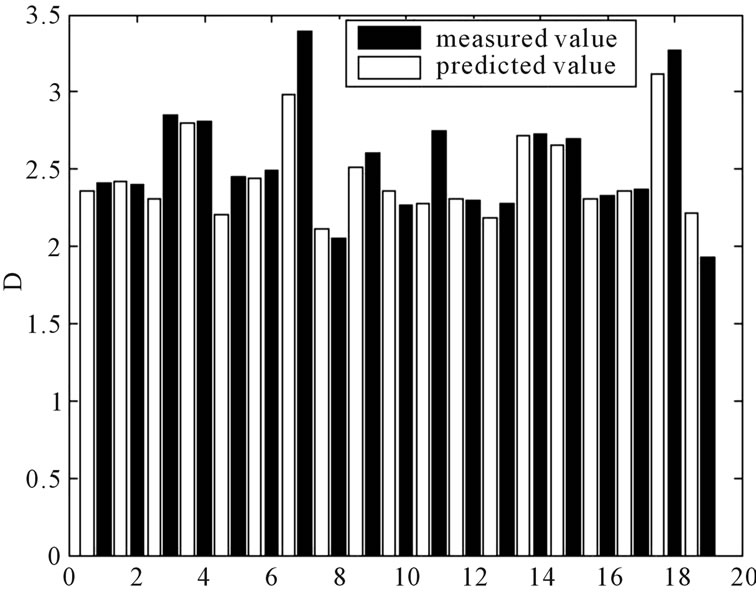
Figure 4. Observed data of D with predicted results comparison chart.
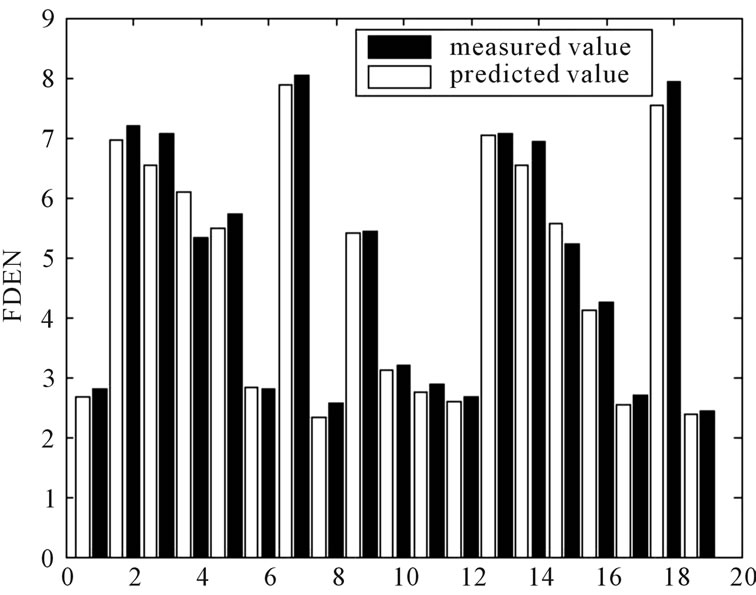
Figure 5. Observed data of FDEN with predicted results comparison chart.
in this paper we propose to describe the crack size using fractal geometry, combine box method and support vector machine, and compute fracture density, fractal dimension of wells that lack core and imaging logging data. To cope with the trouble that the selecting method of kernel function can not be deduced through theoretical basis but only by repeatedly testing and modifying, a new method of SVR kernel function selecting method is proposed. The correlation between the fracture characteristic parameters and their influencing factors, the prediction accuracy of the model and its reliability are all considered in this new method. It can put up with the drawbacks of generally used predicting methods, and can be applied to predict fracture characteristic parameters that are under control of several factors. The case study of this method shows high prediction accuracy, which suggests that SVR is suitable for logging and seismic data description. The new method we proposed is also applicable to prediction of indices that have the characteristics of time-series in other areas.
7. Acknowledgements
The authors are grateful for financial support by National Science Fund for Distinguished Young Scholars of China (Grant No. 51125019).
REFERENCES
- L. Guaiquirian and P. Gonzalez, “Use of Discrete Fracture Network ‘DFN’ to Characterize and Model a Naturally Fractured Sandstone Reservoir: A Case Study of Orocual Field,” SanJuan Formation, Venezuela, 2007, pp. 15-18
- R. M. Fang, “Support Vector Machine Theory and Its Application Analysis,” China Electric Power Press, Beijing, 2007.
- Z. H. Feng and J. M. Yang, “Practical Selection of Support Vector Machine Parameters for SVM Regression,” Mechanical Engineering & Automation, Vol. 3, 2007, pp. 17-18.
- K. Ito and R. Nakano, “Optimizing Support Vector Regression Hyperparameters Based on Cross-Validation,” Proceedings of the International Joint Conference on Neural Networks, Vol. 3, 2003, pp. 2077-2082.
- X. H. Han, S. L. Lu, “Dentification of the Lithology of Dujiatai Formation in J13 Well Block with Least Squares Support Vector Machine,” Special Oil & Gas Reservoirs, Vol. 6, 2011, pp. 18-20.
- H. Y. Li, S. M. Peng, “Prediction of Inter-Well Fractures with Fractal Technique,” Journal of The University of Petroleum, 2002, pp. 48-50.
- L. K. Dong, “Fractal Theory and Applications,” Liaoning Science and Technology Press, Shenyang, 1991, pp. 10- 21.
- G. L. Zhang, “Assessing Hydrocarbon Accumulation of Fractured Reservoir in Qijia Buried Hill by Fractal Theory,” Special Oil & Gas Reservoirs, Vol. 2, 2002, pp. 15-16.
- G. Recktenwald, “Numerical Methods With MATLAB Implementation and Application,” China Machine Press, Beijing, 2004, pp. 128-186
- Z. H. Feng and J. M. Yang, “Practical Selection of Support Vector Machine Parameters for SVM Regression,” Mechanical Engineering & Automation, Vol. 3, 2007, pp. 17-18.