International Journal of Geosciences
Vol. 4 No. 3 (2013) , Article ID: 31447 , 12 pages DOI:10.4236/ijg.2013.43049
Changes in Spatiotemporal Land Use Patterns in Selected Hydrogeomorphic Areas of China and the USA
1Hunan Province Engineering Laboratory of Geospatial Information, Hunan University of Science and Technology, Xiangtan, China
2USDA/ARS, National Sedimentation Laboratory, Oxford, USA
3Middle Tennessee State University, Murfreesboro, USA
Email: quanbin308@yahoo.com.cn
Copyright © 2013 Bin Quan et al. This is an open access article distributed under the Creative Commons Attribution License, which permits unrestricted use, distribution, and reproduction in any medium, provided the original work is properly cited.
Received February 6, 2013; revised March 9, 2013; accepted April 7, 2013
Keywords: Land Use/Land Cover Change; Geographical Information System; Remote Sensing; China; USA
ABSTRACT
Differences exist in land use/cover pattern and its change between the P. R. China and the USA. In order to describe those differences, land use changes in representative regions were quantitatively analyzed and compared. Xiamen City, Changzhutan region and Liupan Mountains regions were selected to represent three different hydrogeomorphic areas of eastern, central, and western China, respectively, while the Goodwin Creek Experimental Watershed (GCEW) located in the north-central part of Mississippi in the bluff hills just east of the Mississippi River floodplain was chosen in the USA. By integrating historical Landsat TM imagery and geographical information system data, the spatiotemporal land use dynamics and conversion of land use in China and the USA between 1980 and 2010 were explored and compared. Results indicated an urban sprawl in eastern and central China, which encroached upon large amount of cropland, forest land and grassland. On the other hand, western China reclaimed cropland from grassland, forest land, which led to severe soil erosion between 1990 and 2000. Goodwin Creek Watershed of the USA converted 73.3% of the lost cropland into forest land, pasture and idle land, which accounted for about 90% in 2010. Further, counter-urbanization occurs in the GCEW due to favorable eco-environment for living. Compared with the land dynamic degree of the GCEW, eastern China is greater than it; western China is smaller than it while central China is almost equal to it. And the land use intensity index of GCEW is smaller than that of China all these years. Eastern China advocated ecological civilization in 2007 to meet the serious challenges of sustainable development. Western China started the Return of Land from Farming to Forestry and Grassland Project in 2000. The Changzhutan region in central China is served as the resource-saving and environment-friendly community in 2007, which will be favorable for the sustainable land utilization and protection of ecology. From the eco-environmental view, China might use the experience of USA for future reference.
1. Introduction
Land use/cover change (LUCC) is an important parameter in assessing regional and global environmental changes [1]. LUCC has been for many decades the subject of intense research in academic circles [2-4]. However, few studies exist where LUCC’s pattern of distinctly different geographical areas in terms of size, agricultural practices, and environmental variables are compared. This paper attempts to demonstrate the usefulness of the dynamic degree concept in describing and quantifying land use changes in different regions. Four hydrogeomorphic areas were chosen, three similar in size but in different parts of China, the other much smaller in size but representation of bluff line watersheds in the USA.
In China, urban areas have substantially increased during the last 30 - 40 years, with now nearly half of the population 665.57 million people, or 49.7% living in urban areas [5]. The increased urbanization and the introduction of modern and efficient industrial production processes in China, may have increased the short-term supplies of material goods in the urban ecosystem, but may also potentially undermine the long-term ecosystem services at a regional scale [6]. On the other hand, the USA has been experiencing some degree of suburbanization in the last several decades [7]. Clearly, these changes could impact LUCC values in the two countries. In order to determine the difference in the future trend of LUCC between the two countries, this paper will explore and compare the land use change patterns of several regions in China with that of the USA Goodwin Creek Experimental Watershed (GCEW), an ARS benchmark watershed, between 1980 and 2010. The results may be useful in making management decisions for land utilization in China and the USA.
2. Materials and Methods
2.1. Study Area
2.1.1. Xiamen City
Xiamen City, with an area of 1638 km2, is located in southeast Fujian province, China, which faces the Taiwan Straits (Figure 1). The region has a southern subtropical monsoon humid climate, an annual mean temperature of 20.8˚C, and an average annual precipitation of 1144 mm. The natural vegetation is a south subtropical monsoon rainforest of Masson Pine (Pinus massoniana Lamb.) and Taiwan Acacia (Acacia confusa Merr). The area consists of hilly and flat bottom land, in which over time lateritic red soils have developed [8]. Xiamen consists of seven administrative districts with a total population of 1.31 million in 2001. When China began a policy of opening up to the world in 1978, Xiamen became one of the first four economic development zones. Since then the economy has grown rapidly and represents an example in eastern China for development.
2.1.2. Changzhutan Region
The Changzhutan region is located in the northeast part of Hunan Province, China, has an area of 28,100 km2, and consists of the cities of Changsha, Zhuzhou, and Xiangtan (Figure 2). The Xiangjiang River runs through this region and the cities are located at the vertices of a triangle with respect to each other along this river and are spaced about 45 kilometers from each other. This region is located in a transition zone in the midand south-subtropics and has a subtropical humid climate with monsoon periods. The mean annual temperature fluctuates between 16˚C and 18˚C and the mean annual precipitation is about 1400 mm. Rainfall is largely concentrated in the period from April to September, and accounts for 60% to 80% of the annual precipitation. Because the region has ample rainfall and a lot of sunshine it is favorable for crop growth. The geomorphology consists mainly of mountains, hills, footslopes, and plains [9]. Major crops are paddy rice, rape, and tea. The landscape is covered by forest of evergreen and deciduous broad-leave and mixed evergreen trees in which the Lithocarpus gla-
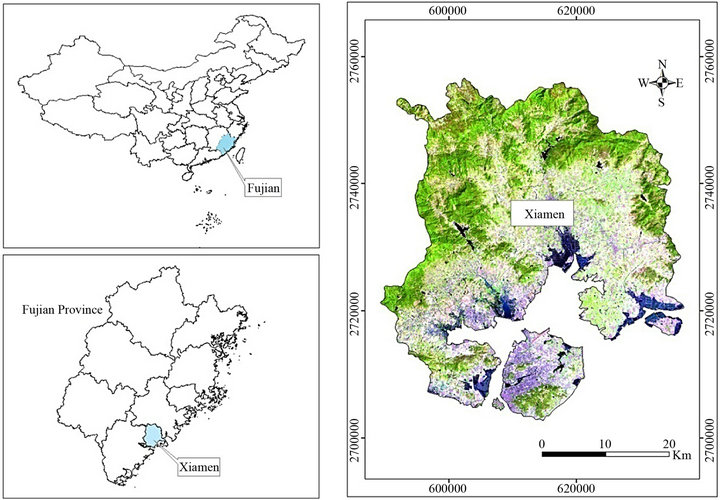
Figure 1. Location of Xiamen City in Fujian Province and China.
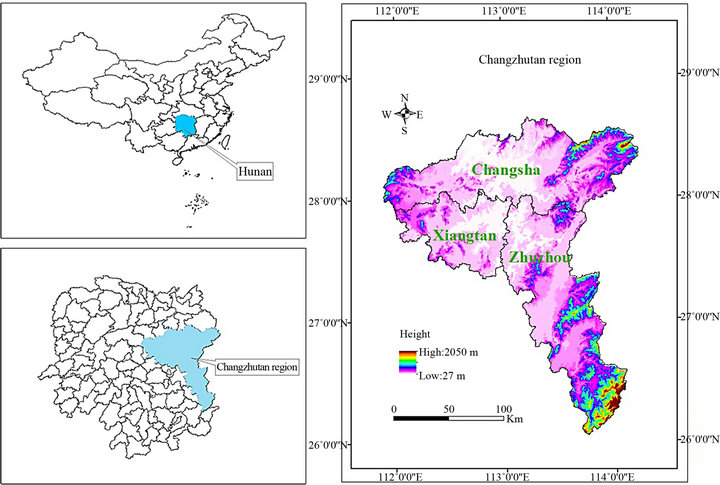
Figure 2. Location of Changzhutan region in Hunan Province and China.
ber, Castanopsis sclerophylla + Cyclobalanopsis glauca, and Cinnamomum camphora species are representative communities. Cinnamomum camphora, Castanopsis sclerophylla, Liquidambar formosana, Ilex chinensis are commonly occurring types of vegetation [10]. A large part of the evergreen broad leave trees make it one of the most important forested headwater conservation areas of the Xiangjiang River basin. The annual runoff volume is 82.65 × 10⁸ m3 and the annual runoff depth is 550 - 850 mm/a. More than 70 rivers and streams make up the river system and Xiangjiang River is the most important river in the Changzhutan region. Widely distributed red and yellow soils (Udic Ferraisols or Luvisols in the Chinese Soil Taxonomy) cover large areas in the Changzhutan region. In 2009, its population was 13,300,000 and the gross domestic product (GDP) was 5.5 × 10¹¹ RMB yuan. Economic improvement is contributed to urban growth. It is anticipated that the implemention of the “Dimorphous Community” Program will promote social and economic development of the Changzhutan region.
2.1.3. Liupan Mountains Region
The Liupan Mountains are located in the southern part of the Ningxia Hui Autonomous Region in China with an area of 16,775 km2 (Figure 3). This region has a temperate semi-humid climate in the south and a temperate semi-arid climate in the north. The mean annual temperature fluctuates between 5˚C and 8˚C, while the annual precipitation varies between 240 mm and 760 mm that decreases gradually from the southeast to the north-west. Because the region is situated in a transition zone between the humid and arid regions, there exist different ecosystems and large biodiversities. Vegetation changes gradually from forest in the southeast to desert in the northwest. A large part of the deciduous broad-leave forests extends into this mountain range resulting in one of the most important forested headwater conservation areas of the Loess Plateau in China. In 2000, the population was 1,868,528 and the net annual income per farmer was only 928 yuan (RMB), indicating great difficulties of providing sufficient food and fiber for the population. The Liupan Mountains represents an impoverished region in the western hydrogeomorphic area of China [11, 12].
2.1.4. Goodwin Creek Watershed
GCEW drains a 21.3 km2 area in Panola County, Mississippi, USA. The watershed is located in the bluff hills of the Yazoo River basin of northern Mississippi (Figure 4). Terrain elevation ranges from 71 to 128 m above mean
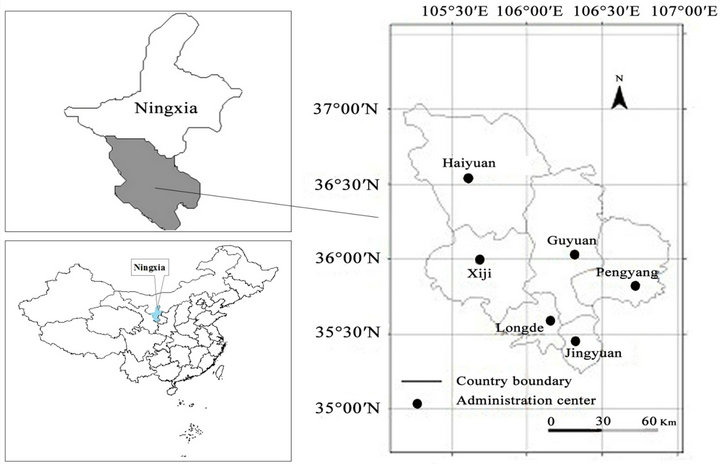
Figure 3. Location of Liupan Mountains region in Ningxia Hui Autonomous Region and China.
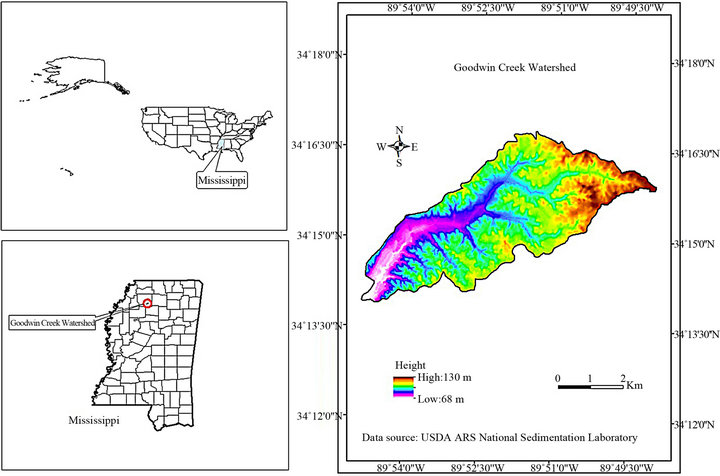
Figure 4. Location of Goodwin Creek in Mississippi State and USA.
sea level, with an average channel slope of 0.004 in Goodwin Creek. The watershed is an integral part of the Coastal Plain Physiographic Province, where the loesssoil cap overlying interfluve soils thins rapidly from west to east, and where Holocene alluvial deposits are present in all valleys. The watershed drains to the west into the Mississippi alluvial valley via the Yocona River. The watershed’s climate is humid, hot in the summer and mild in the winter. The climate exhibits an average annual temperature of approximately 17˚C and an average annual precipitation of approximately 1460 mm [13].
2.2. Data Source and Land Use Classification System
The land use data of the Chinese regions was partly obtained from the Chinese Resource and Environment Database, in which land use maps with scale of 1:100,000 were interpreted from Landsat Thematic Mapper (TM/ ETM) images of 1989/1990, 1995/1996, 1999/2000 and 2007. These images are in this paper denoted as 1990, 1995, 2000 and 2007, respectively. The classification accuracy of the three former data sets was 92.92%, 98.40%, and 97.45%, respectively [14] and the 2007 data set was obtained from the interpretation of images and the last three data sets. Also, other data sets were included such as DEMs and the boundaries of the administrative regions. The data were assembled into the same coordinate system and the Albers projection parameter is Krassovsky ellipsoid with central meridian 105˚E, 1st standard parallel 25˚N, 2nd standard parallel 47˚N, false easting 0, false northing 0, and 0 latitude of projection’s origin. According to the land classification system for remote sensing interpretation, land use in China was divided into seven classes: cropland, forestland, orchard, grassland, open water, rural-urban industrial land and unused land [8,11].
The GCEW data, an ARS benchmark watershed in the USA, was developed by the USDA/ARS, National Sedimentation Laboratory. The GCEW has been a main research watershed for more than three decades. Data collection has primarily relied on annual field surveys. Initially, the field boundaries were defined by homogeneous land use and terrain, and as thus were more difficult to correctly inventory, especially over time as land use extents changed. In an effort to create a more accurate historic land use record, georeferenced aerial photographs have been used to validate the historic field data and to refine field boundaries. Land use in the GCEW consists of cropland, forest land, pasture, idle, and residential areas.
2.3. Models
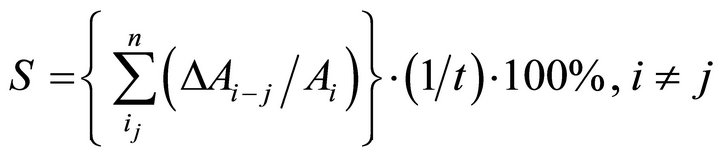
Land use changes can be quantified by the concept of the land use dynamic degree that is given by the following mathematically expression [15]:
 (1)
(1)
where S is the land use dynamic degree during the time interval t usually covering several years; Ai is the area of the i-th land use type at the beginning of the monitoring period; ΔAi-j is the area of the i-th type land use converted into the j-th type land use; and n is the total number of land use types. The land use dynamic degree is thus defined as the rate of change of the total land area that was converted into other types of land use. The dynamic degree concept expresses in a comprehensive manner the change in land use for a given region.
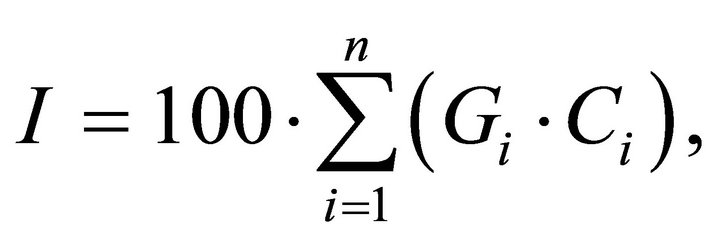
Regional differences in land use intensity index were calculated by using a comprehensive expression, which is given by Equation (2) [16,17]:
 (2)
(2)
where I is the land use comprehensive intensity index; Gi is the grade of the i-th land use type; Ci is the percentage of the area of the i-th land use type; and n is the number of land use grades. In grading land use of this paper, a grade index system was introduced, in which unused land was assigned the factor value 1; forest, grassland, orchard, pasture, idle and water areas, the factor value 2; cropland, the factor value 3; and rural-urban industrial land and residential, the factor value 4. Land use can be ranked on the basis of its importance or value to society [18].
The land use degree change parameter (ΔIb−a) represents the change in the land use intensity index and is given by:
 (3)
(3)
where Ib and Ia are the land use intensity indices at times b and a, respectively. If ΔIb−a > 0, then land use is continuously developing in the region or if ΔIb−a < 0, then the land use intensity is regressing. Thus the land use comprehensive intensity index reflects both magnitude and value of land use changes [19].
3. Results
3.1. Temporal Changes of Land Use
3.1.1. Xiamen
The spatiotemporal land use change between 1988 and 2001 in Xiamen is shown in Table 1. Cropland, forest land, and unused land types decreased while orchard, rural-urban industrial land, and open water increased from 1988 to 2001. Rural-urban industrial land had the largest increased with 10,152 ha. Cropland decreased by 11,305 ha, while forest and unused land reduced by 728
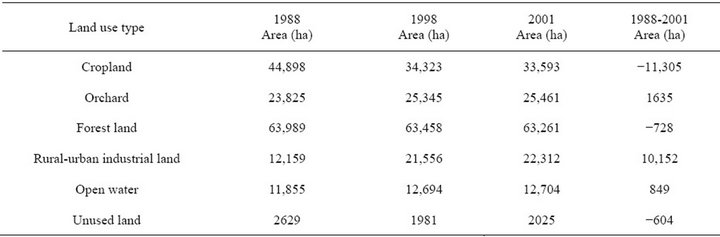
Table 1. The land use change from 1988 to 2001 in Xiamen.
ha and 604 ha, respectively.
3.1.2. Changzhutan Region
The temporal land use changes in the Changzhutan Region are summarized in Table 2. The data indicate that rural-urban industrial land and open water areas increased, while forest land, cropland and grassland decreased from 1990 to 2007. Rural-urban industrial land had the largest increase of 46,297 ha, followed by open water areas with 775 ha. On the other hand, the forest land area decreased by 22,580 ha, followed by cropland (21,808 ha) and grassland (5618 ha) due to an appreciable expansion of urban construction.
The data indicate that urban expansion accounts for most of the land use/cover changes of forestland, cropland, and grassland. The occurrence and distribution of rural-urban industrial land in the Changzhutan region changed from 1990 to 2007 as shown in Figure 5. The sprawling urban city areas, consisting of housing development, university expansions, Economic and Technological Development Zones, and Industry Parks, are dispersed among a large number of non-urban cropland and forestland, which potentially are suited for urban construction. It is expected that the continued expansion of the three cities will gradually lead to their consolidation into a metropolitan area.
3.1.3. Liupan Mountains Region
The temporal changes of land use in the Liupan Mountains region are summarized in Table 3. The data indicate that cropland, forestland, rural-urban industrial land increased, while grassland and open water areas decreased from 1990 to 2000. Cropland had the largest increase of 44,185 ha, followed by forest land (9000 ha) and ruralurban industrial land (1550 ha). On the other hand, the grassland area decreased by 54,025 ha, and open water areas decreased by 735 ha due to reclamation of land from grassland and rivers. Latter decreases suggested that the environmental quality may adversely be impacted.
3.1.4. Goodwin Creek Watershed
The temporal changes of land use in Goodwin Creek Watershed are summarized in Table 4 and Figure 6. The land cover of GCEW is mainly composed of forest land, pasture and idle land, which accounts for nearly 90% of the land area in 2010. The data indicate that cropland area decreased, while forest land and pasture increased from 1980 to 2010. Forest land had the largest increase of 276.8 ha, followed by pasture with 73.6 ha. On the other hand, the cropland area decreased by 403.8 ha. Kuhnle, et al. [20] described that the effects of land use change reduced the erosion and transport of sediment in the channels of the watershed. They suggested that the regional land resources had been protected and environmental protection had been practiced in the GCEW.
3.2. Conversions of Different Land Use Types
3.2.1. Xiamen Area
In Xiamen, 52.5% of the cropland area lost was converted into rural-urban industrial land, and 27.9% and 16.6% were converted into orchard and open water areas, respectively. Also, 50.8% of the forest land lost was converted into orchards due to better economic benefits of fruit production for farmers. For similar reasons, conversion of some cropland to fishing pond, reservoir and hydro-technical construction land, led to an increase of total open water body areas. The increase in rural-urban industrial land was most noticeable from cropland (Table 5).
3.2.2. Changzhutan Region
Tables 6 and 7 summarize these conversions among land use types between 1990 and 2000 (early stage) as well as between 2000 and 2007 (later stage) for the Changzhutan region, respectively. Table 6 shows that 58.2% of the lost cropland was converted into rural-urban industrial land during the early stage. The remaining part of the lost cropland during the early stage was converted into forest land (25.8%) and open water area (15.3%). while Table 7
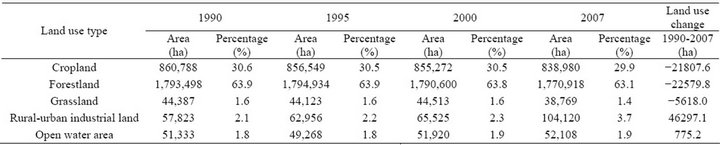
Table 2. Land use changes in the Changzhutan region between 1990 and 2007.
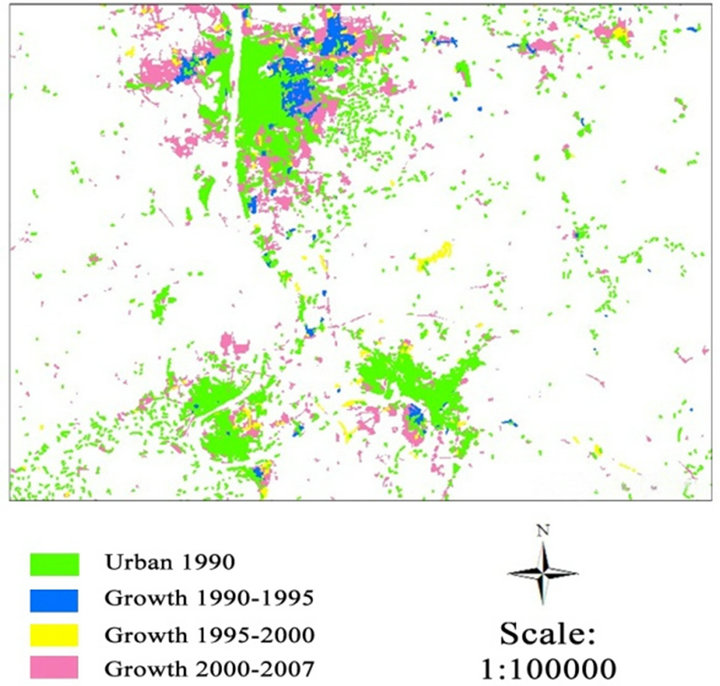
Figure 5. Urban expansion in Changsha, Zhuzhou and Xiangtan Cities in the Changzhutan region between 1990 and 2007. Not all study region are shown.
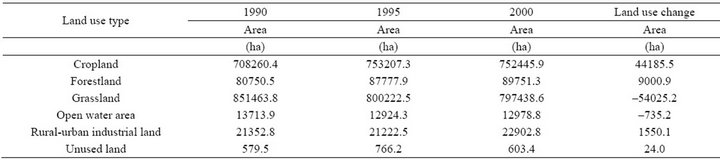
Table 3. Land use changes in the Liupan Mountains region during the period 1990-2000.
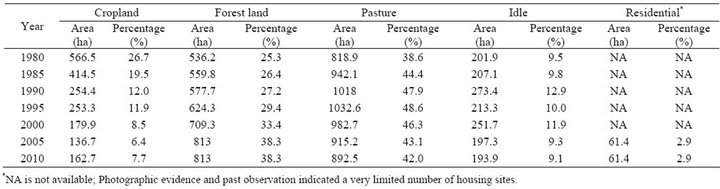
Table 4. Land use changes in Goodwin Creek during the period 1980-2010.
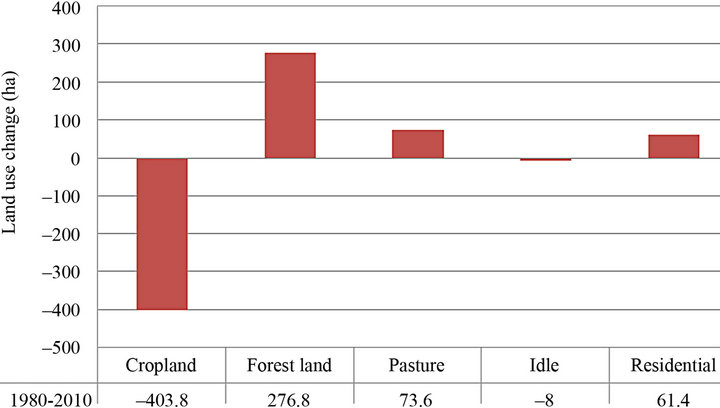
Figure 6. Net changes of land use in Goodwin Creek Watershed, USA.
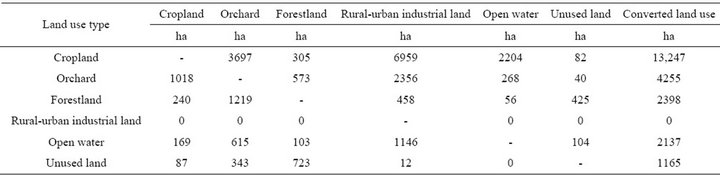
Table 5. Land use conversions between 1988 and 2001 in Xiamen.
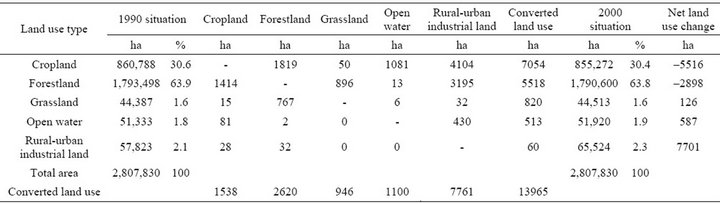
Table 6. Land use conversions between 1990 and 2000.
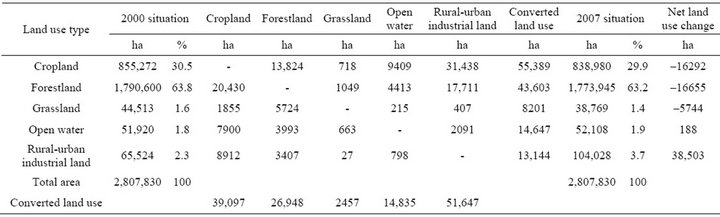
Table 7. Land use conversions between 2000 and 2007.
shows that about 56.8% of the cropland lost during the later stage was converted into rural-urban industrial land. The remaining lost cropland was converted into forest land (25.0%) and open water area (17.0%). However, the cropland areas which was converted into rural-urban industrial land during the later stage is 5.5 times that of the early stage which suggests that cropland loss accelerated over time. About 57.9% and 40.6% of the lost forestland was converted into rural-urban industrial land in the early stage (Table 6) and in the later stage (Table 7), respectively. Like for cropland, a large part of the forestland was also converted into rural-urban industrial land. These changes may have been influenced by policies of regional economic development, industrialization, and urbanization.
3.2.3. Liupan Mountains Region
Land conversions in the Liupan Mountains region were common among the various land use types in the study area. Table 8 summarizes these conversions between 1990 and 2000. Table 8 also shows that about 55% of the lost cropland was converted into forestland. The remaining lost cropland was converted into grassland (28.6%) and rural-urban industrial land (13.7%). Of the lost forestland, 65% were converted into cropland. Nevertheless, overall there was a net increase in forestland. However, the decrease in grassland was most notable. The converted acreage went into other land use types, particularly into cropland. Of the lost grassland, 49.4% were converted into cropland. Also, 64.3% of the lost open water areas were converted into cropland, the rest became grassland. It was a common phenomenon that people reclaimed land of riparian areas and lakes for agricultural production. Urbanization took place to a very limited degree. Only a small percentage of cropland and grassland were converted into rural-urban industrial land [11].
3.2.4. Goodwin Creek Watershed
Table 9 summarizes the land conversions among land use types between 1980 and 2010 in the GCEW. Table 9 shows that 73.3% of the lost cropland was converted into forest land, pasture and idle land. However, no forest land was converted into cropland. Also, the area of conversion into cropland from pasture (14.2 ha) and idle land (5.3 ha) was much less. One may conclude that appreciable conversions occurred among cropland and forest land, pasture and idle during this time period. These changes may have been influenced by sustainable land utilization and environmental protection.
3.3. Dynamics of Land Use
To better understand the dynamics of land use changes, the land use dynamic degree was calculated for the GCEW with Equation (1). Figure 7 shows a comparison of the land use dynamic degree of GCEW with those of the three typical regions in eastern, central, and western China during the period from 1980 to 2010. The land use dynamic degree of GCEW in the USA is similar to that of the Changzhutan region in central China, which in turn is lower than that of Xiamen City in southeastern China and higher than that of the Liupan Mountains region in northwestern China (Figure 7). Thus, the land use dynamic degree of the GCEW is moderate. From the view point of the land use dynamic degree, GCEW experienced unusual changes, which reflected the restoration in land utilization and eco-environment.
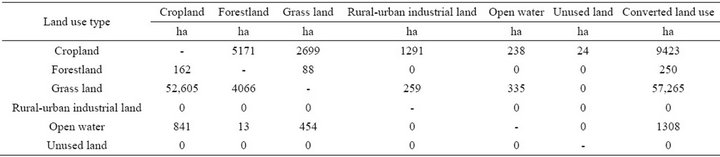
Table 8. Land use conversions between 1990 and 2000 in the Liupan Mountains region.
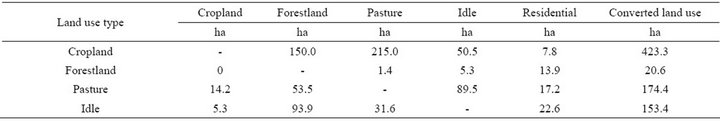
Table 9. Land use conversions between 1980 and 2010 in Goodwin Creek Experimental Watershed.
3.4. Regional Differences in Change of Land Use Degree
Table 10 summarizes the land use intensity index I and the change in the land use intensity index ΔI for GCEW and typical region in China from 1980 to 2010. A comparison of ΔI-values for different regions indicates that Xiamen City holds the largest value of 256.7 - 263.7 followed by the Liupanshan Mountain region with a value of 240. The Changzhutan region ranks third with the value level 230 and GCEW has an I-value below 210. The large I-value in Xiamen was attributed to the relatively favorable physical geography, opened-up policy, and large population density that favored tertiary industry and tourism activity through farmland conversion into urban land. The Liupanshan Mountain region has a larger land use degree since in that region much more forest land and grassland were converted into cropland which has a higher grade value. In the Changzhutan region, where urbanization and economic development was less than in Xiamen, a substantial acreage of cropland and forest land were converted into urban-industrial land. As for GCEW, forest land, pasture, and idle land accounted for about 90% of the whole watershed area, thus producing the smallest land use degree value. All ∆I-values are greater than zero, therefore, the land use is continuously developing in the four regions. The ∆I-values decreased from 201.8 to 196.6 for GCEW during 1995 and 2000 due to cropland conversion into forestland, pasture and idle land (Table 10). The conservation plan adopted in the GCEW increased protection of land resources and environmental systems, which led to reduced soil erosion [20]. The ∆I-value increased from 196.6 to 204.3 for GCEW during 2000 and 2010 due to newly built homes (Table 4). Residents live in small homesteads in the GCEW, that otherwise is still dominated by fields and forest. In this situation, one can still enjoy urban lifestyles including commuting to nearby towns. This phenomenon has been called “counter-urbanization”, which is a striking pattern of geographically de-concentrated population in some parts of the USA.
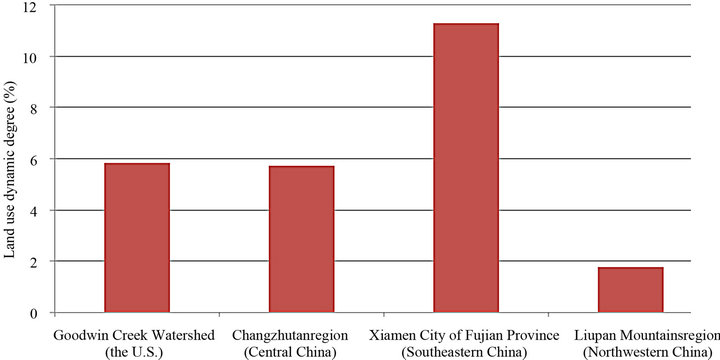
Figure 7. Land use dynamic degrees of Goodwin Creek Watershed from 1980 to 2010 as well as represented region of east, middle and west part of China from 1990 to 2007.
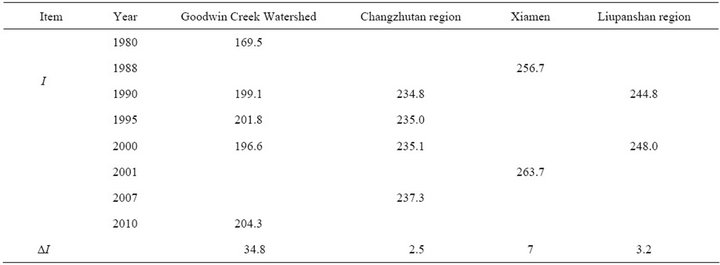
Table 10. Land use intensity index (I) and its change (∆I) for Goodwin Creek Watershed and China from 1980 to 2010.
4. Conclusion
This study has quantitatively and comparatively analyzed the spatiotemporal changes of land use in three watersheds in China and one watershed in USA, using spatiotemporal models, GIS and remote sensing tools. GCEW was found to have experienced moderate changes in the period from 1980-2010. Cropland decreased by 403.8 ha while forestland and pastures increased by 276.8 ha and 73.6 ha, respectively. At present, GCEW is mainly composed of forestland, pasture, and idle land, which accounted for about 90% of the total land. About 73.3% of the lost cropland was converted into forestland, pasture and idle land, which enhances the eco-environmental sustainability. Meanwhile residential areas developed due to counter-urbanization in GCEW from 2000 to 2010. The characteristic process of LUCC in GCEW has been that cropland is converted into idle land, then to pasture, back to idle land or directly to forest. Compared with China, the land use dynamic degree of GCEW is moderate and the land use intensity index is smaller. While fast urbanization has happened in eastern and central China, where much cropland, forest land are converted into urban land, orchard and open water area for more economic benefits. However, urban and economic development also caused damages to natural resources and ecoenvironment. In western China, grassland conversion to cropland was the principal change in land use during the 1990-2000 period. Ecological protection was adversely impacted by the conversion of forestland and grassland into cropland facilitating soil erosion in the region. Fortunately, the Changzhutan region is serving as the resource-saving and environment-friendly community in 2007. Also, western China practiced Returning Land for Farming to Forestry Project in 2000, which will impact the sustainable urban development and will protect the ecology.
5. Acknowledgements
This research was supported by program of United States Department of Agriculture (Agreement Number: 58- 6408-3-001FN). The senior author greatly appreciates the help by USDA/ARS, National Sedimentation Laboratory and Chinese Academy of Sciences Resource and Environment Science Data Center in providing land use data in the research project. My graduate student Zhikun Xiao, Yijun Bai, and Shi Lei at the Hunan University of Science and Technology helped to collect and analyze Changzhutan region data.
REFERENCES
- E. F. Lambin and H. J. Geist, “Land-Use and Land-Cover Change: Local Processes and Global Impacts,” SpringerVerlag, Berlin, 2006. doi:10.1007/3-540-32202-7
- D. C. Zhou, S. Q. Zhao and C. Zhu, “The Grain for Green Project Induced Land Change in the Loess Plateau: A Case Study with Ansai County, Shanxi Province, China,” Ecological Indicators, Vol. 23, No. 12, 2012, pp. 88-94. doi:10.1016/j.ecolind.2012.03.021
- M. E. Mendoza, E. L. Granados, D. Geneletti, D. R. PerezSalicrup and V. salinas, “Analysing Land Cover and Land Use Change Processes at Watershed Level: A Multitemporal Study in the Lake Cuitzeo Watershed, Mexico (1975-2003),” Applied Geography, Vol. 31, No. 1, 2011, pp. 237-250. doi:10.1016/j.apgeog.2010.05.010
- J. G. Wu, A. Buyantuyev, G. D. Jenerette, J. Litteral, K. Neil and W. J. Shen, “Quantifying Spatiotemporal Patterns and Ecological Effects of Urbanuzation: A Multiscale Landscape Approach,” In: M. Richer and U. Weiland, Eds., Applied Urban Ecology: A Global Framework, Wiley-Blackwell Publishing Ltd., Chichester, 2012, pp. 35- 53.
- X. Z. Peng, “China’s Demographic History and Future Challenges,” Science, Vol. 333, No. 6042, 2011, pp. 581- 587. doi:10.1126/science.1209396
- J. A. Foley, R. DeFries, G. P. Asner, C. Barford, G. Bonan, S. R. Carpenter, F. S. Chapin, M. T. Coe, G. C. Daily, H. K. Gibbs, J. H. Helkowski, T. Holloway, E. A. Howard, C. J. Kucharik, C. Monfreda, J. A. Patz, I. C. Pretice, N. Ramankutty and P. K. Snyder, “Global Consequences of Land Use,” Science, Vol. 309, No. 6, 2005, pp. 570-574. http://dx.doi.org/10.1126/science.1111772
- R. Auch, J. Taylor and W. Acevedo, “Urban Growth in American Cities: Glimpses of U.S. Urbanization,” 2004. http://pubs.usgs.gov/circ/2004/circ1252/
- B. Quan, J. F. Chen, H. L. Qiu, M. J. M. Römkens, X. Q. Yang, S. F. Jiang and B. C. Li, “Spatial-Temporal Pattern and Driving Forces of Land Use Changes in Xiamen,” Pedosphere, Vol. 16, No. 4, 2006, pp. 477-488. doi:10.1016/S1002-0160(06)60078-7
- J. Y. She and C. H. Chen, “Research on Modern Forestry Eco-System of Rural-Urban Unification in the Region of Changzhutan,” Hunan University Press, Changsha, 2007.
- Y. J. Yan, M. Wang, Q. Yang and K. W. Liu, “Study on Zonal Vegetation Landscape Characteristics in ChangshaZhuzhou-Xiangtan Region,” Forest Resources Management, Vol. 2, No. 2, 2009, pp. 60-65.
- B. Quan, M. J. M. Römkens, J. J. Tao, B. C. Li, C. K. Li and Q. C. Chen, “Spatial-Temporal Pattern and Population Driving Force of Land Use Change in Liupan Mountains Region, southern Ningxia, China,” Chinese Geographical Science, Vol. 18, No. 4, 2008, pp. 323-330. doi:10.1007/s11769-008-0323-y
- B. Quan, M. J. M. Römkens, R. Li, F. Wang and J. Chen, “Effect of Land Use and Land Cover Change on Soil Erosion and the Spatio-Temporal Variation in Liupan Mountain Region, Southern Ningxia, China,” Frontiers of Environmental Science & Engineering in China, Vol. 5, No. 4, 2011, pp. 564-572. doi:10.1007/s11783-011-0348-9
- C. V. Alonso and R. L. Bingner, “Goodwin Creek Experimental Watershed: A Unique Field Laboratory,” Journal of Hydraulic Engineering, Vol. 126, No. 3, 2000, pp. 174- 177. doi:10.1061/(ASCE)0733-9429(2000)126:3(174)
- J. Y. Liu, Z. X. Zhan and X. Z. Deng, “Spatio-Temporal Patterns and Driving Forces of Urban Land Expansion in China during the Economic Reform Era,” Ambio, Vol. 34, No. 6, 2005, pp. 444-449.
- J. Y. Liu and A. Buhe, “Study on Spatial-Temporal Feature of Modern Land Use Change in China: Using Remote Sensing Techniques,” Quaternary Sciences, Vol. 20, No. 3, 2000, pp. 229-239.
- Y. B. Lai, X. Xia, J. A. Wang, L. Wang, Y. Y. Yu and C. Y. Yang, “Analysis of LUCC Pattern of Physical Region in NSTEC,” Progress in Earth Sciences, Vol. 17, No. 2, 2006, pp. 215-220.
- C. Y. He, H. L. Zhou, Z. T. Yu and Q. T. Zhang, “Regional Land Use/Cover Information Processing,” Resources Science, Vol. 24, No. 2, 2002, pp. 64-70.
- X. L. Wang and Y. H. Bao, “Study on the Methods of Land Use Dynamic Change Research,” Progress in Geography, Vol. 18, No. 1, 1999, pp. 81-87.
- S. Y. Wang, Z. X. Zhang, Q. B. Zhou and C. Y. Wang, “Study on Spatial-Temporal Features of Land Use/Land Cover Change Based on Technologies of RS and GIS,” Journal of Remote Sensing, Vol. 6, No. 3, 2002, pp. 223- 228.
- R. A. Kuhnle, R. L. Bingner, G. R. Foster and E. H. Grissinger, “Effect of Land Use Changes on Sediment Transport in Goodwin Creek,” Water Resources Research, Vol. 32, No. 10, 2012, pp. 3189-3196. doi:10.1029/96WR02104