International Journal of Geosciences
Vol. 3 No. 3 (2012) , Article ID: 21202 , 20 pages DOI:10.4236/ijg.2012.33048
A Geostatistical Approach to the Seasonal Precipitation Effect on Boro Rice Production in Bangladesh
Instituto Superior de Estatística e Gestão de Informação, Universidade Nova de Lisboa Campus de Campolide, Lisboa, Portugal
Email: {m2010161, ccosta}@isegi.unl.pt
Received March 22, 2012, revised April 23, 2012; accepted May 25, 2012
Keywords: Climate; crop production; interpolation; kriging; monsoon
ABSTRACT
Geographical assessments on the relationship between climate variability and crop production are important for planning adaptation programs to climate change impacts on Asian rice production. This paper analyses the seasonal precipitation consequences to irrigated crop yields, in opposition to the idea that irrigated crop yields are not affected by precipitation changes. Geostatistical methods are applied to assess changes in the patterns of seasonal precipitation and corresponding changes in the Boro crop production in Bangladesh. Surfaces depicting changes in the monsoon, non-monsoon and total precipitation from 2006 to 2007, and changes in three varieties of Boro crop yield and Total Boro yield from 2006-2007 to 2007-2008 crop years are generated through Splines, Inverse Distance Weighting and Ordinary Kriging methods. Performance evaluation of these models is also performed. The relationships between the surfaces of different precipitation seasons and the surfaces of different Boro yield seasons are then assessed. The results show that there is a significant correlation between seasonal precipitation changes and Boro yield changes with notable correlation coefficients and similarity in the patterns. A significant conformity of the high precipitation zones to the high Boro yielding zones is also depicted.
1. Introduction
Geostatistics, which is based on the theory of regionalized variables [1-3], is increasingly being preferred to produce interpolated surfaces of spatial attributes because it allows one to capitalize on the spatial correlation between neighboring observations to predict attribute values at unmeasured locations. Spatial interpolation techniques, such as Splines, Inverse Distance Weighting or Kriging methods, are commonly used in climate variability analysis [4-8]; and agriculture management and planning [9,10]. The need for a geostatistical assessment of the vulnerability of crop production due to unfavorable weather events and climatic conditions at regional scale has been clearly expressed, particularly by the impact-research community [11-13]. Moreover, in the context of climate change impacts on Asian rice production, [14] argue that geo-spatial vulnerability assessments may become crucial for planning targeted adaptation programs.
Rain-fed crops are heavily affected by the annual variations in precipitation. Though it is commonly accepted that technological advances, such as improved crop varieties and irrigation systems, have reduced this vulnerability, weather and climate are still important factors and play a significant role in irrigated and highyielded crop productivity. Generally high temperatures and low precipitation in the dry lands lead to depletion of organic matters in the ground which affect crop productivity. The impacts of climate change on food production raise global concerns [15-18]. In Bangladesh, lives and livelihoods mainly depend on agriculture and this is one of the most vulnerable countries to climate volatility and change, which potentially increases poverty by affecting agricultural productivity [14,19-22].
National development programs of Bangladesh encouraged farmers to produce high yielding varieties (HYV) of rice all year round covering the three seasons, namely Aus rice (pre-monsoon), Aman rice (monsoon) and Boro rice (dry winter), particularly in areas endowed with supplemental irrigation facilities [23,24]. The Boro rice is the major cereal crop in Bangladesh as it represents approximately 60% of total cereal production [25]. The Boro crop is largely dependent on irrigation and proper application of other major inputs such as seeds, fertilizer and insecticides. Fertilizers are out of reach to most of the farmers in Bangladesh due to their higher costs, which causes an imbalance use of fertilizers [26] [27]. Nevertheless, at the growing and flowering stage, the most important factor for Boro production is a favorable climatic condition. The Bangladesh precipitation regime is highly variable in both time and space. The annual mean precipitation varies from 1400 mm in the west to more than 4300 mm in the east of the country [28]. Four seasons can be distinguished: the dry winter season (December to February), the pre-monsoon hot summer season (March to May), the rainy monsoon season (June to September), and the post-monsoon autumn season (October to November). In the pacific subtropical climate of Bangladesh, precipitation is an indicator of the climatic regime for crop production, during the hydrological period known as monsoon [29].
[30] showed that there will be no substantial change in the total demand of irrigation water in Boro rice fields in the northwest part of Bangladesh in the context of global climate change. The results from this study also show that there will be an increase in the daily use of water for irrigation, which may aggravate the situation of groundwater scarcity in the region during the dry season. Boro production is not likely to be affected by monsoon precipitation since it is an irrigated crop and is produced in the dry season. However, crop production statistics have shown that the total area under Boro crop has increased from 4,257,873 hectares in the 2006-2007 crop year to 4,607,630 hectares in 2007-2008 crop year, which corresponds to an increase of 8.21%, which was accompanied with an increase of monsoon precipitation from 1678 mm in 2006 to 2356 mm in 2007. At the same time, the average yield rate of 2007-2008 crop year has increased to 9.67 metric tons per hectare for Boro rice, which is 3.86% higher as compared to 2006-2007 [25]. Therefore, these statistics provide some evidences that there might be a considerable correlation between irrigated crop production and monsoon precipitation.
The main objective of this study is to analyse the effect of seasonal precipitation change on irrigated Boro production in Bangladesh. First, deterministic and kriging methods have been evaluated and compared in order to find the best method to generate surfaces describing the precipitation and Boro production change phenomenon in Bangladesh. Afterwards, the selected interpolation method has been used to spatially interpolate the total and monsoon precipitation of 2006 and 2007, the production of different varieties of Boro rice (Local, HYV, Hybrid), as well as the Total Boro production of 2006- 2007 and 2007-2008 crop years. Finally, the relationship between precipitation changes and Boro production changes has been assessed.
2. Study Area
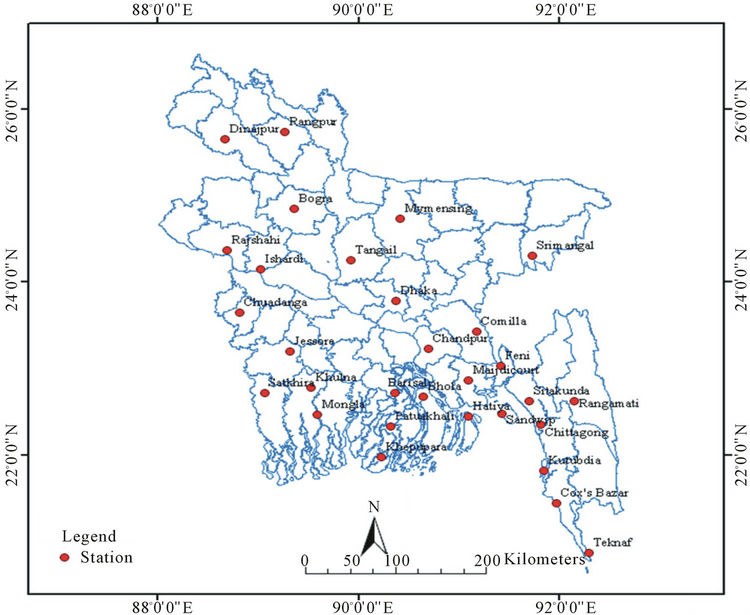
The total area of Bangladesh is 147,570 km2, and there are only 34 meteorological stations managed by the Bangladesh Meteorological Department, to measure precipitation and temperature [31]. Among them, 31 stations (Figure 1(a)) provide the precipitation data for 2006 and 2007. The total area is divided into 23 crop production regions which represent the crop districts of Bangladesh. The major cereal crop, Boro rice, is produced in all of the crop districts (Figure 1(b)) and Boro yield data of 2006- 2007 and 2007-2008 are available for all these districts.
The economy of Bangladesh depends primarily on agriculture. Approximately 84% of the total population live in rural areas and are directly or indirectly engaged in a wide range of agricultural activities. The agriculture sector plays a very important role in the economy of the country accounting for 31.6% of the total GDP in 2007- 2008 [31]. Within the agricultural GDP, the crop subsector contributes 71%, and within the crop sub-sector, food grain (particularly, the rice crop) dominates the country’s agricultural scenario in respect of both cropped and production, claiming a share of 74% and 54% percent, respectively, during 2006-2007. The sector generates 63.2% of total national employment, of which Boro crop share is nearly 55%. The prospect of Bangladesh self-sufficiency in rice has proceeded as the growth in the Boro production rate has increased. Three varieties of Boro are produced in the 23 crop districts: Local, High Yielded Varity (HYV) and Hybrid Boro. The Hybrid Boro has been introduced in the 2007-2008 crop year with a very satisfactory yield rate [31].
Bangladesh is one of the countries where crop production is most likely to suffer adverse impacts from anthropogenic climate change [30,32]. Climate change has a profound impact on precipitation intensity and variability in Bangladesh [33,34]. Global Climate Models (GCMs) showed that global warming will increase the intensity of extreme precipitation events in Bangladesh [35]. Regional projections also revealed that climate change would strengthen monsoon circulation, increase surface temperature, and increase the magnitude and frequency of extreme precipitation events [36]. In Bangladesh, the agriculture region of the southwest is adversely affected by extreme water shortages and severe moisture stress during the dry months [37]. In the northwestern part of Bangladesh, drought is also a common phenomenon [28]. In addition, monsoon precipitation has increased in the western part of the country [38]. Salinity ingress is also a major hazard faced by Bangladesh [32, 39]. The seasonal variation of precipitation will affect crop production that solely depends on precipitation, while also affecting the irrigation processes. [30] discusses the impact of climate change on irrigation water demand.
3. Materials and Methods
3.1. Data
The daily precipitation data of the years 2006 and 2007
 (a)
(a)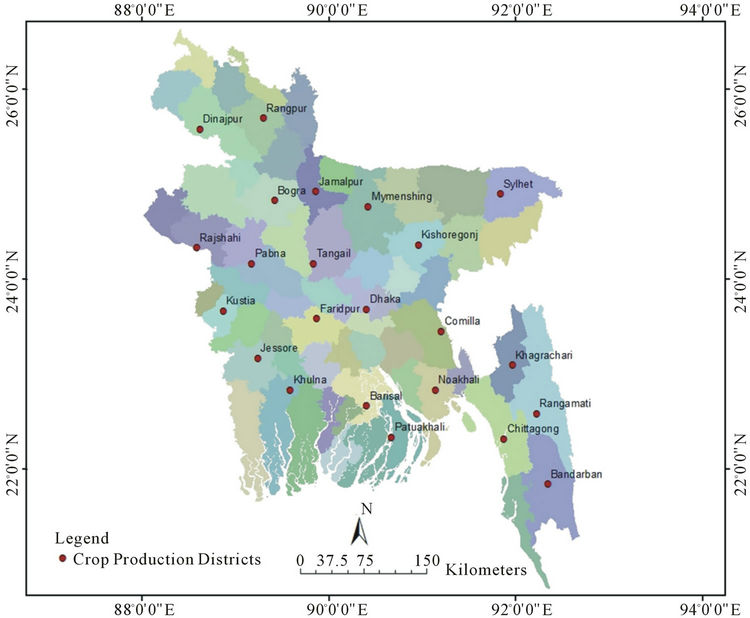 (b)
(b)
Figure 1. Bangladesh with the location of (a) 31 meteorological stations for which precipitation data is available for 2006 and 2007; and (b) 23 crop districts.
used in this study were provided by the Bangladesh Meteorological Department for 31 meteorological stations. Average and total precipitation, for monsoon (hydrological period) and dry season, have been computed from the daily precipitation dataset and have been used for surface interpolation. A quick overview of the data is presented in Figure 2, which shows an increase in the monsoon precipitation from 2006 to 2007 in almost every station, particularly in Chittagong, Feni and Sitakunda.
Total Boro production data for three varieties (Local, HYV and Hybrid) of the crop years 2006-2007 and 2007- 2008, collected from the Bangladesh Bureau of Statistics (BBS), for 23 crop districts are used in the Boro production analysis. Average yield per hectare of Local, HYV, Hybrid and Total Boro rice have been calculated for these two crop years. There has been an increase in average yield from 2006-2007 to 2007-2008 in every region of Boro production (Figure 3), which provides evidence for some correlation with the increase of monsoon precipitation in this period.
Daily precipitation has been measured at the meteorological stations and their geographical locations are known. However, the Boro production data has not been measured at any particular point location, rather it represents a region and thus this is inclusive and true for the whole area within a regional boundary. To overcome this shortcoming, the location of the meteorological station in a particular crop district has been considered as the point location of the Boro production in that district. The geographic centre of the district has been considered as the point location of the Boro production whenever the crop district had no station inside it (Figure 1(b)). Total, monsoon and non-monsoon precipitation data have been generated and used for spatial interpolating purposes. Similarly, Total, Local, HYV and Hybrid Boro yield data have been generated and interpolated.
3.2. Methodological Framework
Microsoft Excel® 2007 has been used to pre-process the data for the geostatistical analysis, and ArcGIS® 9.31 and GeoMS© have been used in the evaluation and application of the three widely used spatial interpolation techniques: Thin Plate Spline, Inverse Distance Weighting (IDW) and Ordinary Kriging. Prediction errors statistics derived through cross-validation are used to evaluate and compare their performance [40], namely the mean error and the root mean square error. The best approach is then used in the final surface generation of precipitation and crop yield. Total precipitation data of 2006 and HYV Boro yield data of 2006-2007 crop year have been selected to perform the evaluation.
3.2.1. Interpolation Methods
Splines are exact interpolators that belong to a family of
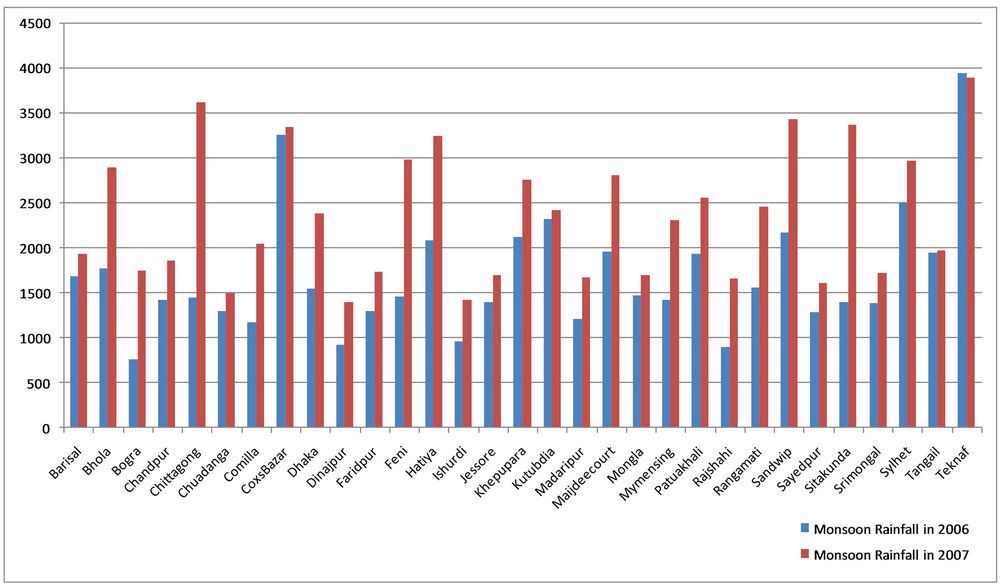
Figure 2. Monsoon precipitation at 31 meteorological stations of Bangladesh available for 2006 and 2007.
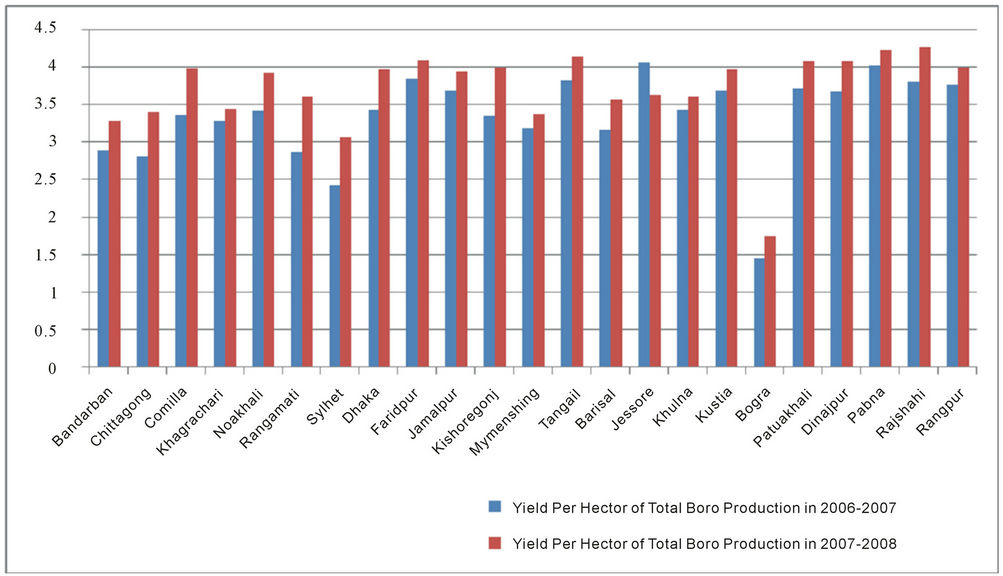
Figure 3. Average yield (in metric ton) per hectare of total Boro production at 23 crop production districts of Bangladesh available for 2006-2007 and 2007-2008.
methods called radial basis functions. These methods are a form of artificial neural networks, and are conceptually similar to fitting a rubber membrane through the measured sample values while minimizing the total curvature of the surface [41]. A commonly used radial basis function named Thin Plate Spline, introduced by [42], has been implemented in this study.
Inverse Distance Weighting (IDW) is based on the assumption that the nearby values contribute more to the interpolated values than distant observations. In other words, the influence of a known data point is inversely related to the distance from the unknown location that is being estimated. Accordingly, the attribute of interest is estimated as a weighted linear combination of several surrounding observations, with the weights being inversely proportional to the distance raised to the power value p (typically, p = 2) between each observation and the unmeasured location.
Similar to IDW, Ordinary Kriging is based on a linear estimator that assigns more influence to the nearest data points in the prediction of unmeasured locations. Ordinary Kriging, however, is not deterministic since it incorporates statistical properties of the measured data, such as the spatial autocorrelation. The Kriging approach uses the semivariogram to express the spatial continuity (autocorrelation) and requires two separate steps: first, calculating and modelling/fitting the semivariogram for the whole area, followed by Kriging estimation of unmeasured points in the area. The semivariogram measures the strength of the statistical correlation as a function of distance. Typically, an authorized variogram model (e.g. exponential or spherical) is fitted to the experimental semivariogram values, calculated from data, for given angular and distance classes. In bounded models (e.g., spherical and exponential), semivariogram functions increase with distance until they reach a maximum, named sill, at an approximate distance known as the range. The range is the distance at which the spatial correlation vanishes, and the sill corresponds to the maximum variability in the absence of spatial dependence.
For total precipitation in 2006, the Ordinary Kriging interpolation used an isotropic exponential semivariogram model with the range equal to 13 km, and the sill equal to 6984.5. For the HYV Boro yield in 2006-2007, the Ordinary Kriging interpolation used an isotropic Gaussian semivariogram model with the range equal to 8 km, and the sill equal to 0.74915.
The implementation of those interpolation techniques requires establishing the neighborhood search size, which defines the neighborhood shape and the constraints of the points within the neighborhood that are used in the prediction of an unmeasured location. These parameters have been set up by trial and error based on the crossvalidation results, particularly the minimum mean error and the minimum root mean square error criteria. The neighborhood size that has been obtained for Spline has also proved to be the best for all the other interpolation methods: the number of sample points to be used in the prediction of unmeasured locations was set to five, including two points as minimum. The limited number of observed data points explains this outcome. The default value of twelve points meant that about half of the available sample points were contributing to the prediction, despite the fact that many of those points were very far from the location being estimated. Reducing the number of points within the neighborhood of the location being estimated assured the use of the closest values in the calculation process.
After describing the reasoning of the interpolation techniques implemented, we now briefly introduce their mathematical formulation. Detailed descriptions of radial basis functions and their relationships to splines and kriging can be found in [43,44]. Interested readers should refer to geostatistical textbooks [2,44] for detailed descriptions on the IDW and Kriging methods.
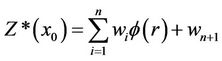
Considering the problem of estimating the attribute/variable z at an unmeasured location x0. Let {z(xi), i = 1, ∙∙∙, n} be the set of data xi measured at n locations. In the Splines approach, the predictor Z*(x0) is a linear combination of a radial basis function f(r) as (1).
 (1)
(1)
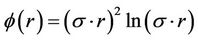
where, wi (i = 1, ∙∙∙, n + 1) are weights to be estimated (wn+1 is a bias parameter), and r = ||xi − x0|| is the Euclidean distance between the prediction location x0 and each data location xi. The Thin Plate Spline function is defined as (2).
 (2)
(2)
And the optimal smoothing parameter s is found by minimizing the root-mean-square prediction errors using cross-validation [41].
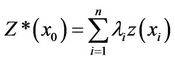
Both IDW and Kriging use a linear combination of neighbouring observations to estimate the unknown value at the unmeasured location x0 as (3).
 (3)
(3)
where li are the weights assigned to each measured point.
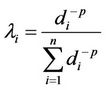
In the simplest form of the IDW interpolation, sometimes called Shepard’s method [45], the weights li are a function of the distance (di) between the prediction location x0 and the measured locations xi as (4).
 (4)
(4)
where, p is a positive real number, called the power parameter. Greater values of p assign greater influence to values closest to the interpolated point. In this study, the value of p was set to 2, and this method is known as the inverse distance squared weighted interpolation.
Ordinary Kriging is based on the assumption that the set of unknown values is a set of spatially dependent random variables, hence each measurement z(xi) is a particular realization of the random variable Z(xi). In (3), the optimal Kriging weights li are determined by solving the Kriging equations that result from minimizing the estimation variance while ensuring unbiased estimation of Z(x0) by Z*(x0). In Ordinary Kriging, the Kriging weight decreases as the datum location gets farther away from the location being estimated, but unlike IDW weights, negative Ordinary Kriging weights can occur. Typically, negative weights arise when the influence of a specific datum is screened by that of a closer one [2].
3.2.2. Performance Evaluation
The performance of each interpolation method has been evaluated through error statistics derived through Jackknife cross-validation, or “leave-one-out” cross-validation. The prediction errors are calculated as the differences between the predicted values z*(xi) and the observed values z(xi).
The mean error (ME) is commonly used to check if the estimation is biased, and is defined as (5).
 (5)
(5)
In order to check the accuracy of each method, the root mean square error (RMSE) has been used as (6).
 (6)
(6)
4. Results and Discussion
4.1. Performance Evaluation of the Interpolation Methods
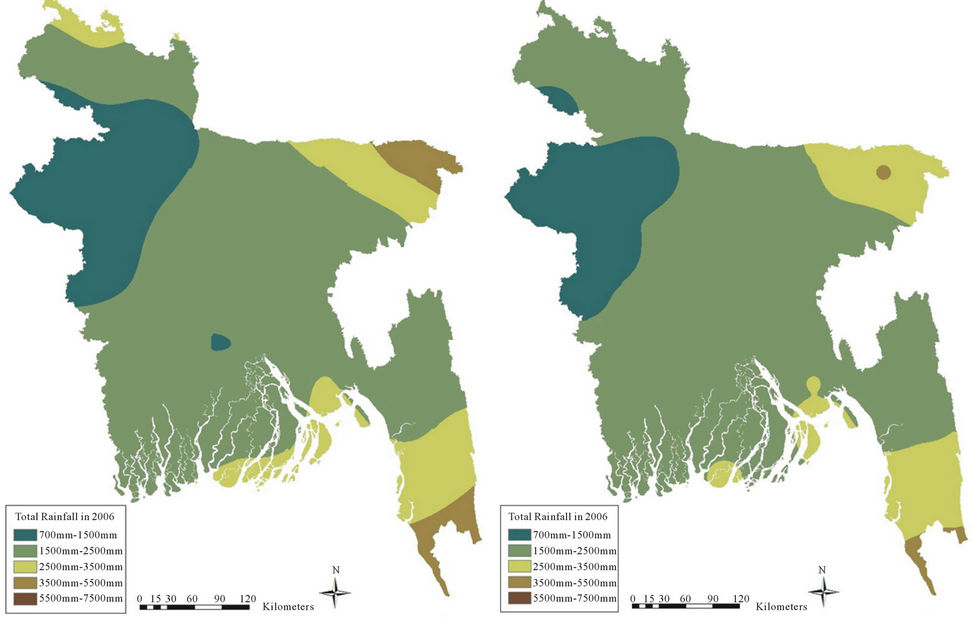
Interpolated surfaces of total precipitation of 2006 and HYV Boro yield of 2006-2007 crop year (Figures 4 and 5, respectively) have been produced through Spline, IDW and Ordinary Kriging techniques. Results show that the Spline approach provides a smoother surface than the other methods, and the surfaces generated using IDW show more diversity over the area than the Spline ones. Nevertheless, the spatial patterns of total precipitation and HYV Boro yield obtained through Ordinary Kriging exhibit more variability over the region than those obtained either by Spline or IDW methods.
The interpolation techniques used to create those surfaces have been evaluated through prediction errors statistics. The bias and precision of each method have been
 (a)
(a)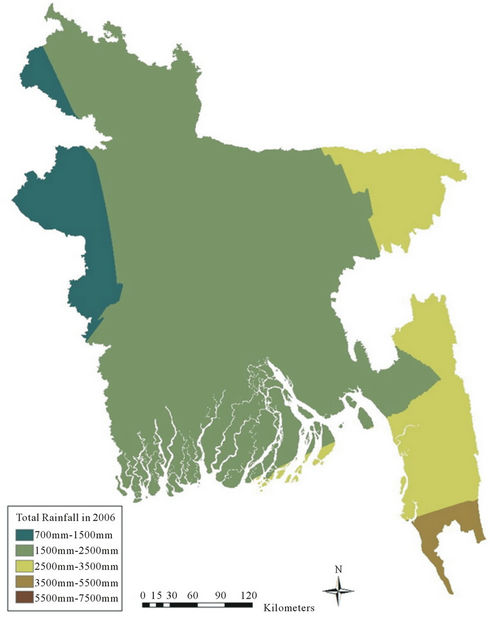 (b)
(b)
Figure 4. Total precipitation in 2006. The surfaces have been generated through (a) Spline; (b) IDW; and (c) Ordinary Kriging.
 (a)
(a)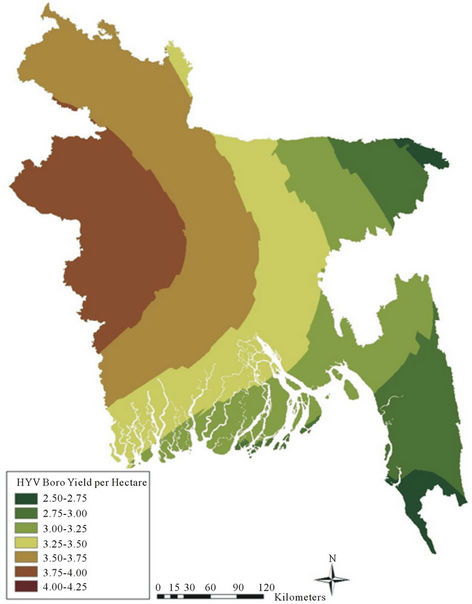 (b)
(b)
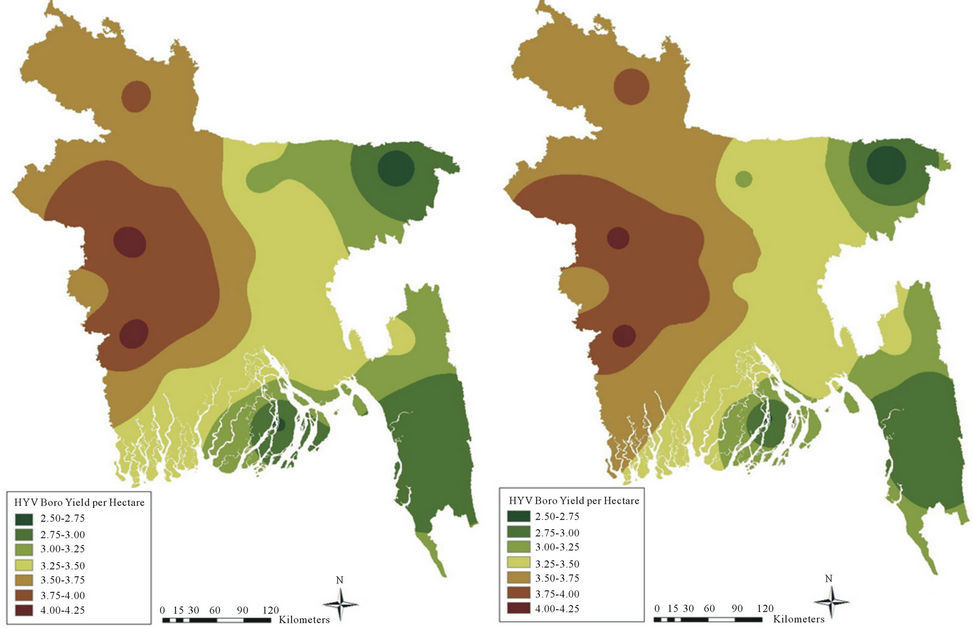
Figure 5. HYV Boro yield in metric ton per hectare of 2006-2007. The surfaces have been generated through (a) Spline; (b) IDW; and (c) Ordinary Kriging.
assessed through the mean error and the root mean square error, respectively (Table 1). The results show that Ordinary Kriging proved to be the best interpolation method since it has produced lowest errors statistics when generating the surfaces of total precipitation in 2006 and HYV Boro yield in 2006-2007. Therefore, Ordinary Kriging method has been applied to interpolate all the remaining surfaces of precipitation and Boro yield.
4.2. Spatiotemporal Patterns of Precipitation and Boro Yield
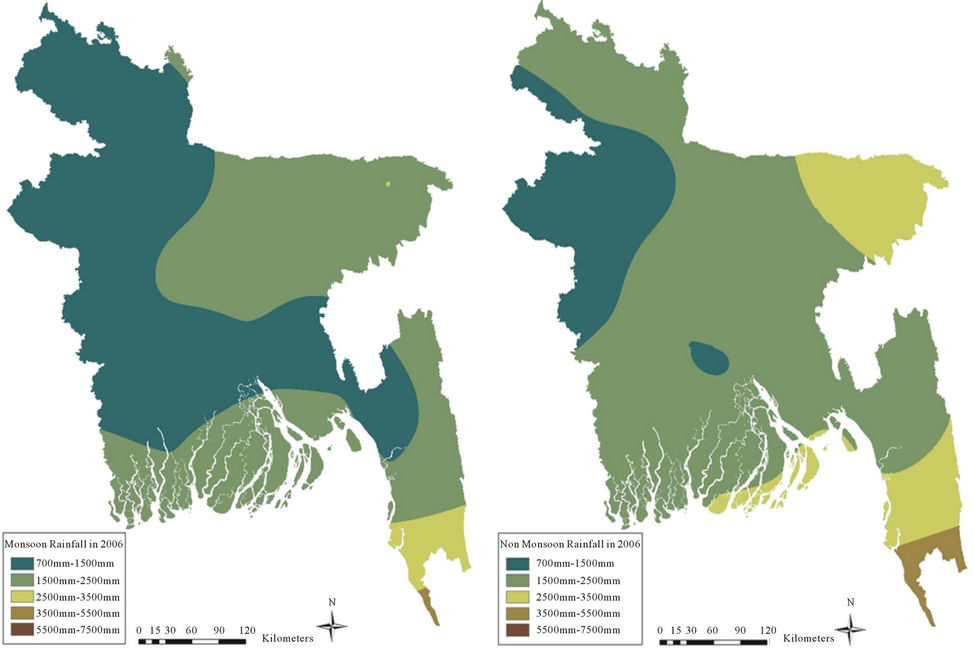
Considering the results of the previous section, Ordinary Kriging has been additionally used to spatially interpolate the total and monsoon precipitation of 2006 and 2007, and the production of different varieties of Boro rice (Local, HYV, Hybrid), as well as the Total Boro production of 2006-2007 and 2007-2008 crop years. The semivariogram models estimated to generate each kriging map of precipitation and Boro yield are listed in Table 2. The precipitation maps generated show that the south-eastern and north-eastern regions of Bangladesh have experienced the highest amounts of monsoon precipitation in the 2006 hydrological season, and the area under high monsoon precipitation has increased in 2007 in the south-eastern and north-eastern areas (Figures 6(a) and (d)). During both years, the mid-western part of Bangladesh corresponds to dry regions that have experienced the lowest monsoon precipitation amounts. The predicted surfaces for non-monsoon precipitation indicate that the areas with the highest precipitation have increased in the south-eastern and north-eastern areas of Bangladesh (Figures 6(b) and (e)). On the other hand, both surfaces indicate the mid-western part of Bangladesh as the driest region during the non-monsoon season.
Similarly to the maps of the monsoon season, the south-eastern and north-eastern regions of Bangladesh have experienced the highest amounts of total precipitation in 2006, and the area under high precipitation has increased in 2007 in those regions (Figures 6(c) and (f)). Likewise, the mid-western part of Bangladesh corresponds to the driest region in terms of total precipitation.
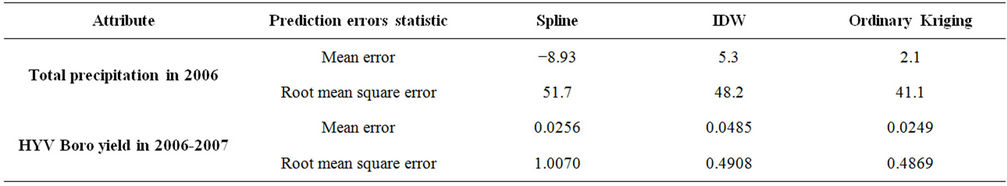
Table 1. Prediction errors statistics produced by the interpolation techniques for the surfaces of total precipitation in 2006 and HYV Boro yield in 2006-2007.
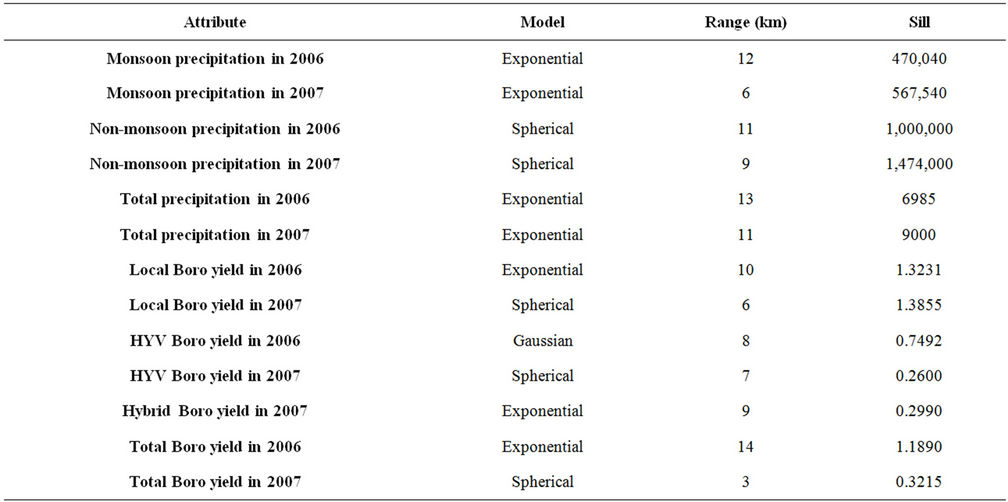
Table 2. Semivariogram models and parameters used in the Orinary Kriging interpolation of precipitation and Boro yield.
 (a)
(a)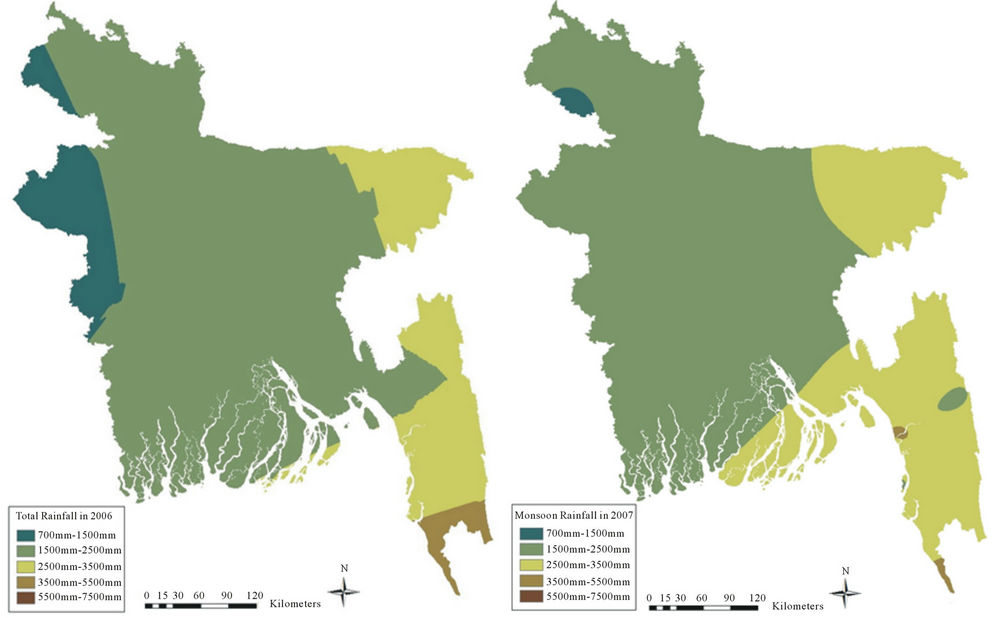 (b)
(b)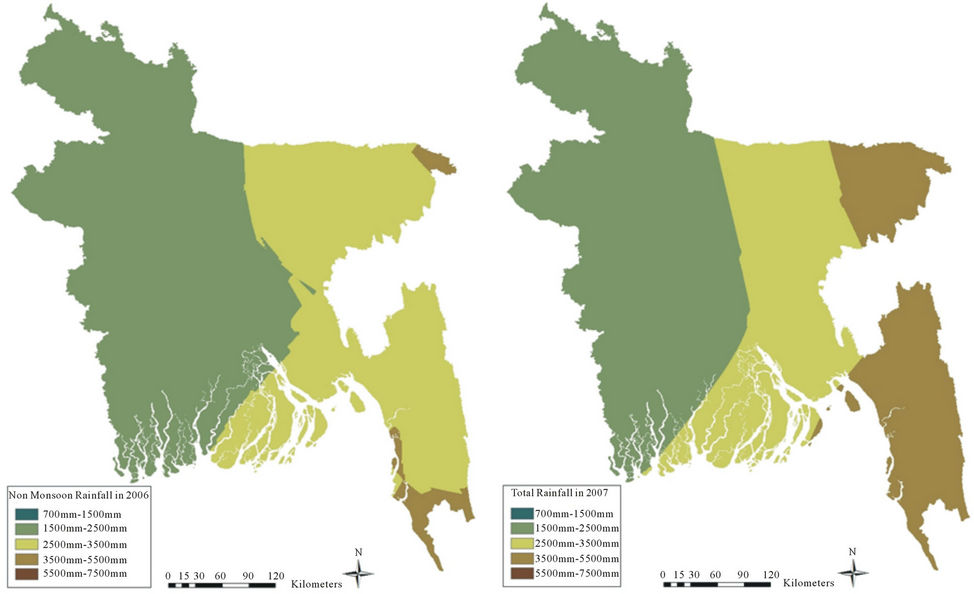 (c)
(c)
Figure 6. (a) Monsoon precipitation; (b) Non-monsoon precipitation; and (c) Total precipitation in 2006; and (d) Monsoon precipitation; (e) Non-monsoon precipitation; and (f) Total precipitation in 2007.
Hence, the total precipitation pattern over the year is basically determined by the monsoon precipitation.
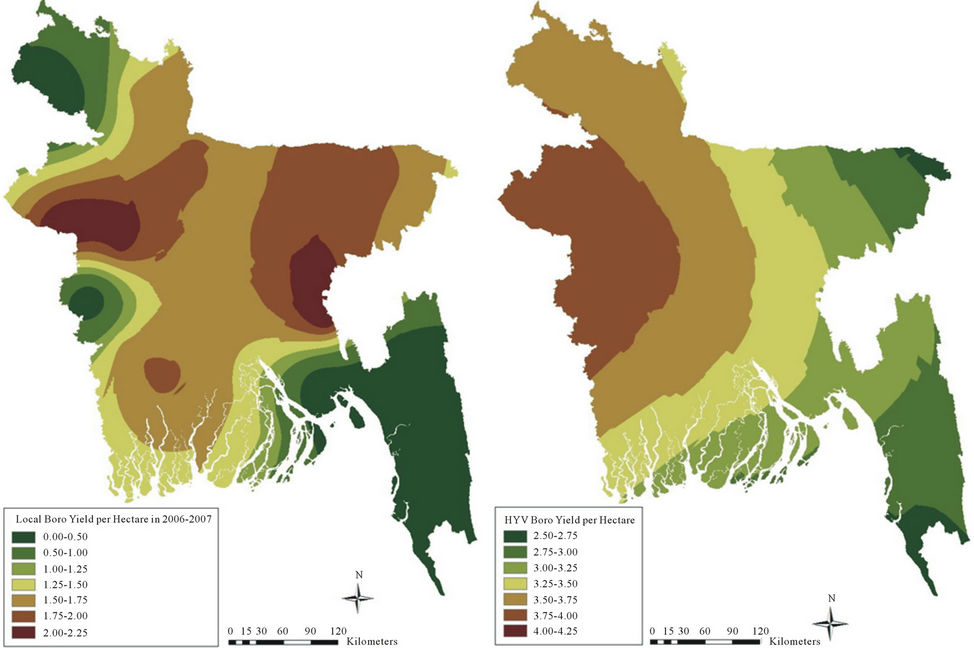
All regions have experienced moderate to high Local Boro yield in 2006-2007, except the north-western and south-eastern corners of the country (Figure 7(a)). Local Boro yield has increased significantly in the extreme south-eastern corner in 2007-2008, and also increased in the mid regions (Figures 7(a) and (c)). This result is in agreement with the significant increase of precipitation in this area. The remaining areas show similar patterns of Local Boro yield in 2006-2007.
Considering the HYV Boro yield of 2006-2007 (Figure 7(b)), almost all the regions have experienced moderate to high Boro yield in this crop year, except in the south-western corner. On the other hand, HYV Boro yield has considerably increased in the mid and northwestern regions in the 2007-2008 crop season, and decreased in southern regions. The north-eastern corner also indicates low values of HYV Boro yield in 2007- 2008 (Figure 6(d)).
Hybrid Boro has been introduced in 2007, thus only the surface of Hybrid Boro yield of 2007-2008 has been generated (Figure 7(e)). Except some areas in the southeastern region, the map shows a gradual increase of Hybrid Boro yield to the mid north-western region, which is the major crop production district of Bangladesh.
The maps of Total Boro yield in 2006-2007 and 2007- 2008 represent the cumulative result of the yield of all the Boro varieties (Figure 8). Total Boro yield is moderate to high all over the country, except in the southern region and in the north-eastern corner in the 2006-2007 crop year. Note that the southern region of Bangladesh does not correspond exactly to a crop district, because it corresponds to a highly irregular deltaic coastline, crossed by many rivers and watercourses flowing into the Bay of Bengal. The Total Boro yield has increased all over the region in 2007-2008, except in the southern region.
4.3. Changes in the Spatiotemporal Patterns of Precipitation and Boro Yield
The changes in the precipitation patterns from 2006 to 2007 have been evaluated and mapped using a raster calculator, as well as changes in the patterns of Boro crop yields from 2006-2007 to 2007-2008 (Figure 9). The north-west and the south-eastern corner of Bangladesh have experienced a decrease in monsoon and non-monsoon precipitation from 2006 to 2007, but the extent of the change in total precipitation is smaller in these areas. On the other hand, the mid north-western region, which is the major crop production district of the country, has experienced increased precipitation from 2006 to 2007.
 (a)
(a)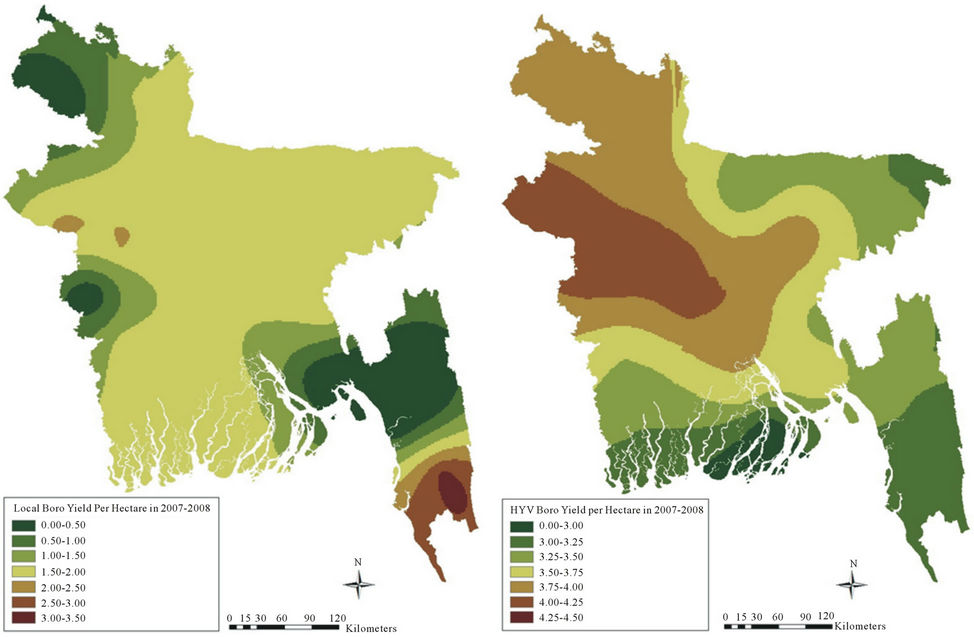 (b)
(b)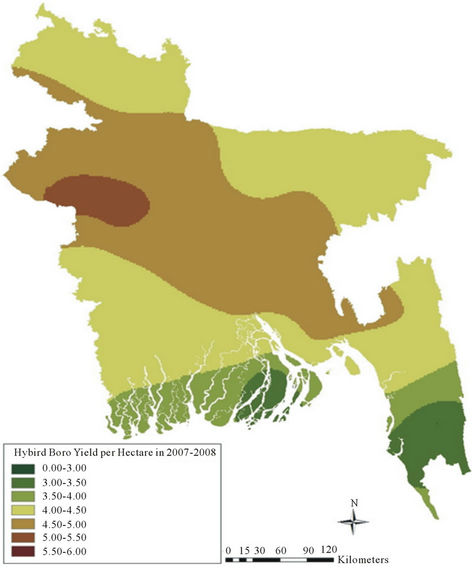 (c)
(c)
Figure 7. (a) Local Boro yield in metric ton per hectare and (b) HYV Boro yield in metric ton per hectare of 2006-2007; and (c) Local Boro yield in metric ton per hectare; (d) HYV Boro yield in metric ton per hectare and (e) Hybrid Boro yield in metric ton per hectare of 2007-2008.
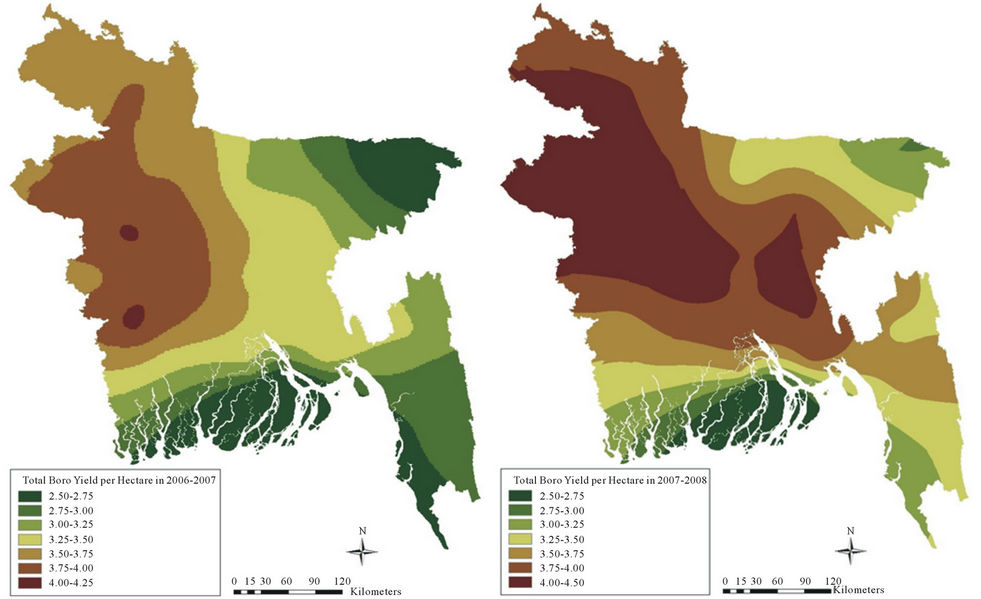 (a) (b)
Figure 8. Total Boro yield in metric ton per hectare of (a) 2006-2007 and (b) 2007-2008.
 (a)
(a)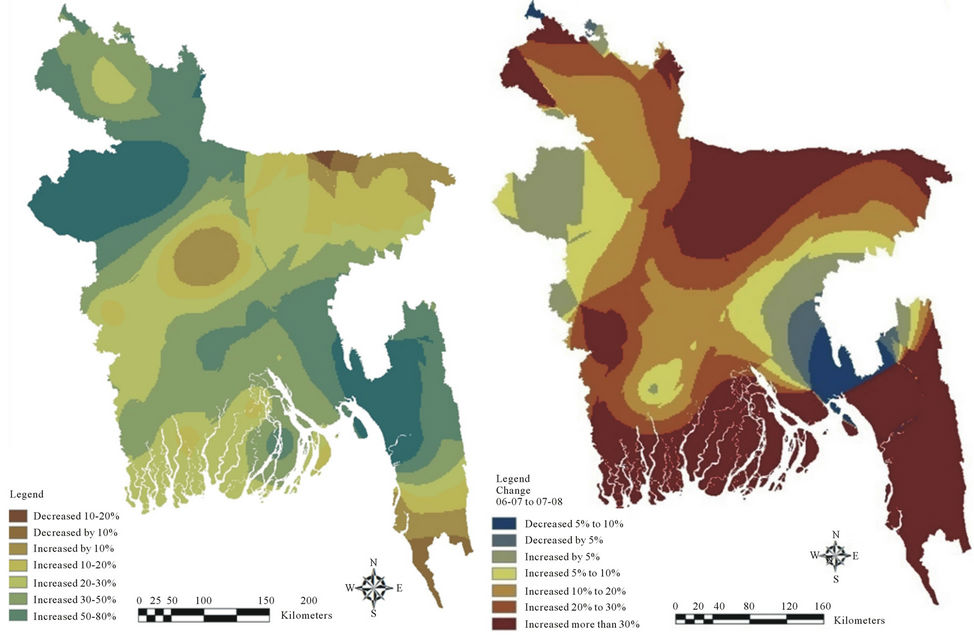 (b)
(b)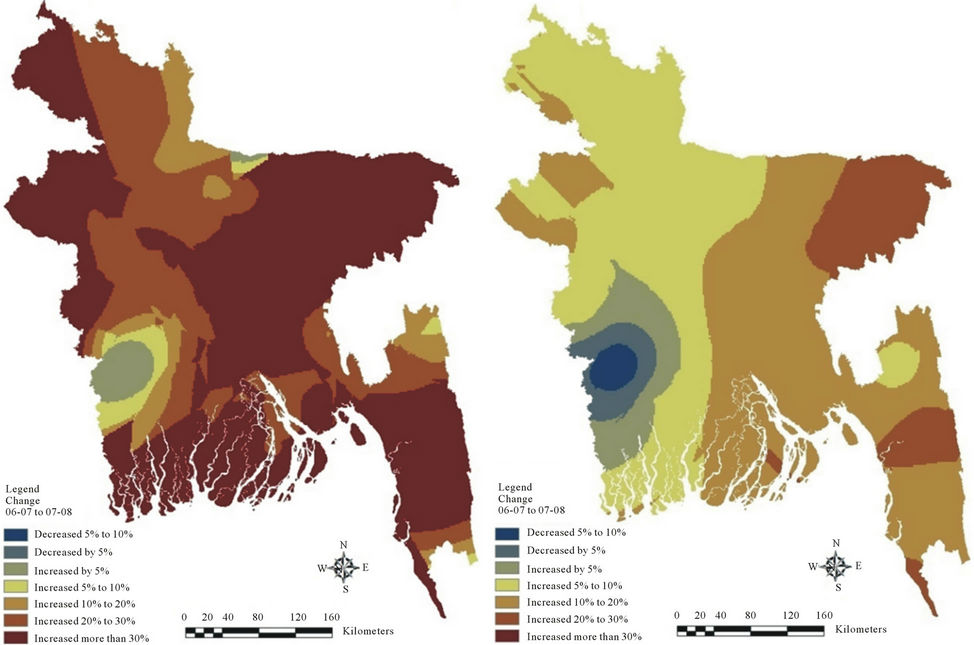 (c)
(c)
Figure 9. Changes in the (a) Monsoon; (b) Non-monsoon and (c) Total precipitation from 2006 to 2007; and changes in the (d) Local; (e) HYV; and (f) Total Boro yield from 2006-2007 to 2007-2008.
Monsoon precipitation has increased in the northern and southern periphery of the country by 27% - 57%, and in the major crop production district it has increased more than 90%. Non-monsoon precipitation, which is the most significant for Boro production, has increased in the larger crop production district of Bangladesh more than 30%, but decreased in the northern and southern corner regions. The patterns of change in total precipitation (Figure 9(c)) are similar to those of the monsoon and non-monsoon precipitation in the corresponding regions. A considerable increase in precipitation in the delta area can also been identified in the precipitation change maps.
Almost all the regions of Bangladesh have experienced a significant increase in Boro yield from 2006-2007 to 2007-2008, except some areas in some corners of the country, which is consistent with the precipitation changes over the country. This is especially evident in the major crop production district of the country, in the mid northwestern region, which has experienced a considerable increase in the precipitation and in Boro yield.
Local Boro yield has increased more than 30% in the northern and southern belt of the country, and decreased by 5% to 10% in the delta region. Local Boro has not shown a large increase in the major crop production district, because this area has focused more on HYV Boro production rather than Local Boro. In fact, the HYV Boro yield has increased more than 30% in that area. A similar increase in HYV Boro yield occurs in the eastern and southern belt of the country. The Total Boro yield shows a similar pattern of increase and decrease, though with much less variability than the Local and HYV Boro, because it does not take into account the Hybrid Boro yield in 2006-2007 crop year. The Total Boro yield has increased 5% to 10% in the major crop production district, whereas it increased 20% to 30% in the south-eastern and north-eastern region. Moreover, Total Boro yield has decreased 5% to 10% in the small area near the south-western border of the country.
Despite the fact that the Boro production has not shown a similar percentage of change to precipitation, the areas that experienced an increase in precipitation have also experienced an increased Boro production, and vice versa. This might be explained by the fact that the different varieties of Boro crop show different sensitivity to the soil condition and precipitation, and that is why different varieties are mainly produced in different regions of Bangladesh. Hence, changes in precipitation can have different impacts in the production of different varieties.
4.4. Relationship between Precipitation and Boro Crop Yield Changes
The correlation between the maps of precipitation changes and Boro production changes has been evaluated using Band Collection Statistics. The results show moderate to large correlation values between precipitation changes and Boro yield changes (Table 3).
Monsoon precipitation changes have a strong correlation (0.65) with Local Boro production changes. Local Boro is locally produced and technologically not advanced. It mostly depends on irrigation, which comes from natural storage of water from monsoon precipitation. This might explain why regions with decreased monsoon precipitation have also shown a decreased Local Boro yield. On the other hand, changes in the dry season precipitation considerably affect the HYV Boro production as the corresponding correlation coefficient is equal to 0.76. HYV Boro is typically produced during the dry seasons. This implies that the HYV Boro production classically should be independent of amount of precipitation in dry period whereas it is highly dependent. Obviously, the water supply from precipitation increases the growth rate and health of the seedlings and the moisture content of the soil in addition which is not attainable only from irrigation. Moreover, precipitation changes in both hydrological seasons are also moderately related to the Total Boro production.
The strong correlation between precipitation and irrigated crop production, such as Boro rice, might be explained by the fact that the source of irrigation is completely natural and this natural source should be replenished every year by precipitation. When there are irrigation resources available the production rate of Boro rice increases, apart from the sensitivity of different varieties of Boro to the amount of irrigation. Furthermore, precipitation also controls the soil moisture which is an essential factor for crop production. Some of the varieties of Boro completely depend on the moisture quantity of the soil, and thus on precipitation. Ground water provides adequate amounts of water to crops to compensate the precipitation variability from place to place and time to time, but the source of ground water is, again, precipitation [46].
That situation is highlighted by further analyzing changes in monsoon precipitation and Local Boro yield in the south-eastern region of the country. In 2007, the monsoon precipitation has increased in this region over 30% (Figure 10), and Local Boro yield has likewise increased more than 30% in this area. The northern part of this region shows a small decrease, because this is a mountainous area and completely unsuitable for Boro production. The production of the Local Boro variety mainly depends on precipitation, as it does not depend on other factors such as genetics or any other technological improvement. Therefore, the increase in the Local Boro production in this particular area is mainly ensued by the increase in the monsoon precipitation. Similar results have been observed for non-monsoon precipitation changes and changes in the other varieties of Boro rice.
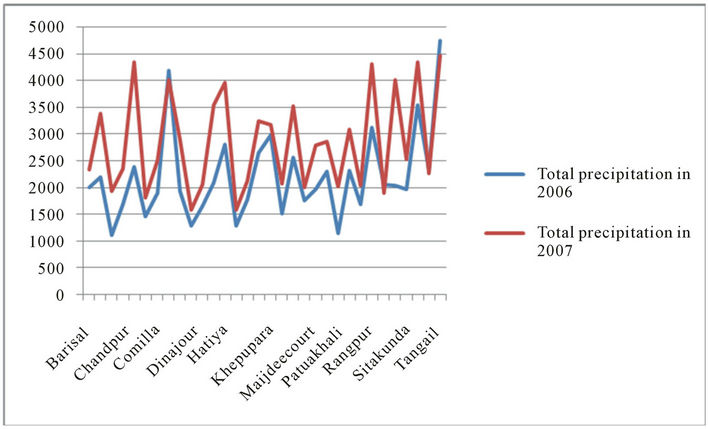
A careful look to the spatial trend of precipitation at the weather stations locations and the distribution of Boro yield in crop production regions also supports the previous arguments (Figure 11). Locations with lower total precipitation in each year have also lower Total Boro yield, and stations with higher total precipitation have higher Total Boro yield rate, likewise. Hence, this provides further evidence that total precipitation strongly affects the Total Boro production.
5. Final Remarks
This study analyzes changes in the spatiotemporal patterns of precipitation and Boro rice production over Bangladesh, based on maps produced through geostatistical techniques whose performance has been evaluated. The effect of the seasonal variation of precipitation on irrigated and high yielded crop production has been further investigated through geo-band collection statistics, particularly the correlation between precipitation changes and changes in the Boro production. Results provide strong evidence that precipitation highly affects Boro yields. This research has contributed to the knowledge of the spatiotemporal patterns of improved crop varieties and their relationship with seasonal precipitation in Bangladesh.
The study possesses some inherent limitations, though it has thoroughly analyzed the relationship between seasonal precipitation changes and irrigated Boro production. The sample size of thirty one meteorological stations and
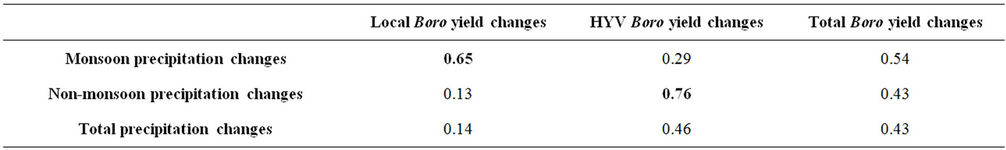
Table 3. Correlation coefficients between precipitation changes and Boro yield changes.
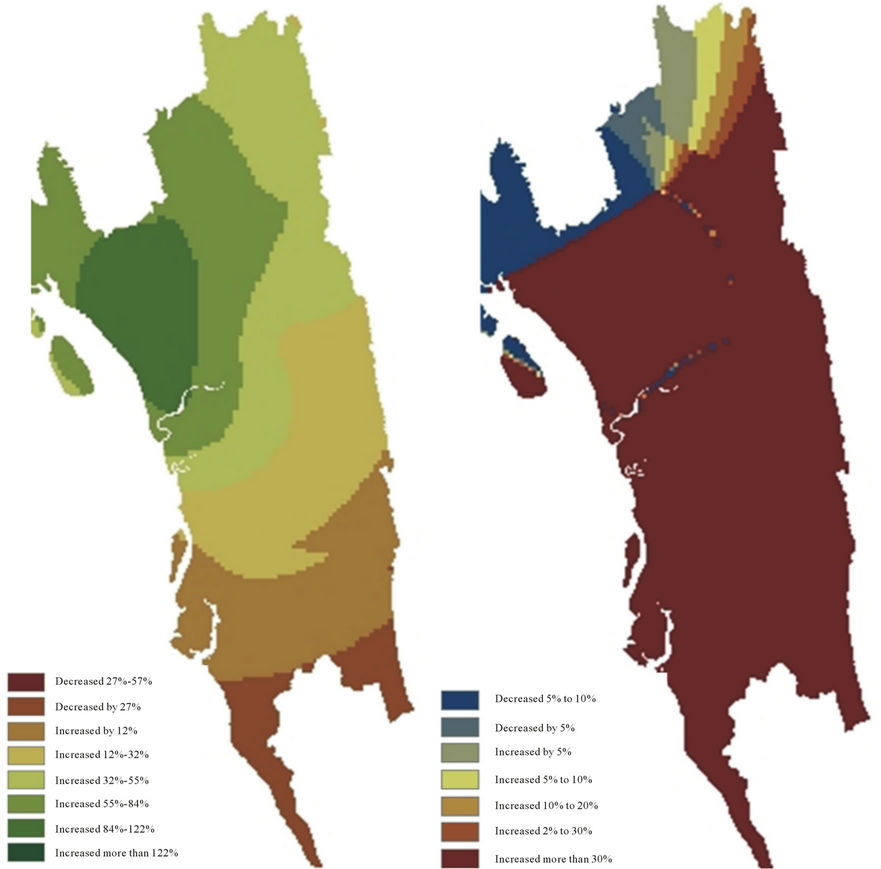 (a) (b)
Figure 10. Changes in (a) monsoon precipitation and (b) Local Boro yield in the south-eastern region of Bangladesh.
twenty three crop production districts are too small to accurately characterize an area of 147,570 km2. This is the reason why, sometimes, the interpolated surfaces show sudden pattern changes or bull’s eye effects. The assignment of point locations to the crop districts according to the location of the meteorological stations, and to the geographical center of the region, might also have adverse effects on the analysis. Nevertheless, this approach was considered the best because of the unavailability of data and allowed to serve the study purpose.
Climate change has undoubtedly introduced erratic seasonal variations in precipitation in many parts of the world. This rate is increasing abruptly. Long term unmitigated climate change will “likely” exceed the capacity of people and the natural world to adapt [47]. The technologically advanced world has modified the genetics to introduce improved crop varieties and to make them resistant to climate change effects. However, as discussed in this study, genetically improved irrigated crops, which are not likely to be affected by changes in precipitation, are in fact affected by them in a roundabout way. This study hopes to draw attention to such indirect climate variability effects, which will eventually affect the survival of human beings, and encourage further research on this subject.
6. Acknowledgements
Heartfelt thanks to Dr. A. K. M. Saiful Islam, Professor, Institute of Flood and Water Management, Bangladesh University of Engineering and Technology for providing with the daily precipitation data from the Bangladesh
 (a)
(a)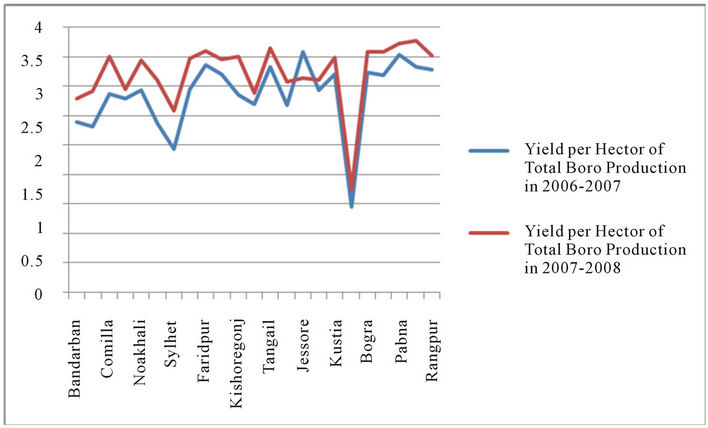 (b)
(b)
Figure 11. Spatial Trend of precipitation and Boro production: (a) Total precipitation in 2006 and 2007; and (b) Total Boro yield in 2006-2007 and 2007-2008.
Meteorological Department. The authors also acknowledge Yitea Seneshaw Getahun for his help with the production of a few maps.
REFERENCES
- A. G. Journel and C. J. Huijbregts, “Mining Geostatistics,” Academic Press, London, 1978.
- P. Goovaerts, “Geostatistics for Natural Resources Evaluation. Applied Geostatistics Series,” Oxford University Press, New York, 1997.
- P. Goovaerts, “Geostatistical Tools for Characterizing the Spatial Variability of Microbiological and Physico-Chemical Soil Properties,” Biology and Fertility of Soils, Vol. 27, No. 4, 1998, pp. 315-334. doi:10.1007/s003740050439
- D. L. Phillips, J. Dolph and D. Marks, “A Comparison of Geostatistical Procedures for Spatial Analysis of Precipitation in Mountainous Terrain,” Agricultural and Forest Meteorology, Vol. 58, No. 1-2, 1992, pp. 119-141. doi:10.1016/0168-1923(92)90114-J
- E. P. J. Boer, K. M. de Beurs and A. D. Hartkamp, “Kriging and Thin Plate Splines for Mapping Climate Variables,” International Journal of Applied Earth Observation and Geoinformation, Vol. 3, No. 2, 2001, pp. 146-154. doi:10.1016/S0303-2434(01)85006-6
- M. Perry and D. Hollis, “The Generation of Monthly Gridded Datasets for a Range of Climatic Variables over the UK,” International Journal of Climatology, Vol. 25, No. 8, 2005, pp. 1041-1054. doi:10.1002/joc.1161
- A. C. Costa, R. Durão, M. J. Pereira and A. Soares, “Using Stochastic Space-Time Models to Map Extreme Precipitation in Southern Portugal,” Natural Hazards and Earth System Sciences, Vol. 8, No. 4, 2008, pp. 763-773. doi:10.5194/nhess-8-763-2008
- R. Durão, M. J. Pereira, A. C. Costa, J. Delgado, G. del Barrio and A. Soares, “Spatial-Temporal Dynamics of Precipitation Extremes in Southern Portugal: A Geostatistical Assessment Study,” International Journal of Climatology, Vol. 30, No. 10, 2010, pp. 1526-1537.
- R. Khosla, D. G. Westfall, R. M. Reich, J. S. Mahal and W. J. Gangloff, “Spatial Variation and Site-Specific Management Zones,” In: M. A. Oliver, Ed., Geostatistical Applications for Precision Agriculture, Springer, Dordrecht, 2010, pp. 195-219. doi:10.1007/978-90-481-9133-8_8
- P. Postiglione, R. Benedetti and F. Piersimoni, “Spatial Prediction of Agricultural Crop Yield,” In: R. Benedetti, M. Bee, G. Espa and F. Piersimoni, Eds., Agricultural Survey Methods, John Wiley & Sons, Ltd., Chichester, 2010. doi:10.1002/9780470665480.ch22
- J. Reilly, P. H. Stone, C. E. Forest, M. D. Webster, H. D. Jacoby and R. G. Prinn, “Uncertainty and Climate Change Assessments”, Science, Vol. 293, No. 5529, 2001, pp. 430-433. doi:10.1126/science.1062001
- M. D. Webster, “Communicating Climate Change Uncertainty to Policy-Makers and the Public,” Climatic Change, Vol. 61, 2003, pp. 1-8. doi:10.1023/A:1026351131038
- S. Dessai and M. Hulme, “Does Climate Adaptation Policy Need Probabilities?” Climate Policy, Vol. 4, No. 2, 2004, pp. 107-128.
- R. Wassmann, S. V. K. Jagadish, K. Sumfleth, H. Pathak, G. Howell, A. Ismail, R. Serraj, E. Redona, R. K. Singh and S. Heuer, “Regional Vulnerability of Climate Change Impacts on Asian Rice Production and Scope for Adaptation,” In: D. L. Sparks, Ed., Advances in Agronomy, Academic Press, London, Vol. 102, 2009, pp. 91-133.
- P. G. Jones and P. K. Thornton, “The Potential Impacts of Climate Change on Maize Production in Africa and Latin America in 2055,” Global Environmental Change, Vol. 13, No. 1, 2003, pp. 51-59. doi:10.1016/S0959-3780(02)00090-0
- D. B. Lobell, M. B. Burke, C. Tebaldi, M. D. Mastrandrea, W. P. Falcon and R. L. Naylor, “Prioritizing Climate Change Adaptation Needs for Food Security in 2030,” Science, Vol. 319, No. 5863, 2008, pp. 607-610. doi:10.1126/science.1152339
- M. L. Parry, C. Rosenzweig, A. Iglesias, M. Livermore and G. Fischer, “Effects of Climate Change on Global Food Production under SRES Emissions and SocioEconomic Scenarios,” Global Environmental Change, Vol. 14, No. 1, 2004, pp. 53-67. doi:10.1016/j.gloenvcha.2003.10.008
- P. K. Thornton, P. G. Jones, G. Alagarswamy and J. Andresen, “Spatial Variation of Crop Yield Response to Climate Change in East Africa,” Global Environmental Change, Vol. 19, No. 1, 2009, pp. 54-65. doi:10.1016/j.gloenvcha.2008.08.005
- I. M. Faisal and S. Parveen, “Food Security in the Face of Climate Change, Population Growth, and Resource Constraints: Implications for Bangladesh,” Environmental Management, Vol. 34, No. 4, 2004, pp. 487-498. doi:10.1007/s00267-003-3066-7
- S. A. Ahmed, N. S. Diffenbaugh and T. W. Hertel, “Climate Volatility Deepens Poverty Vulnerability in Developing Countries,” Environmental Research Letters, Vol. 4, No. 3, 2009, Article ID: 034004. doi:10.1088/1748-9326/4/3/034004
- W. Yu, M. Alam, A. Hassan, A. S. Khan and C. Rosenzweig, “Climate Change Risks and Food Security in Bangladesh. Earthscan Climate Series,” Earthscan Publications, London, 2010, p. 144.
- S. G. Hussain, “Assessing Impacts of Climate Change on Cereal Production and Food Security in Bangladesh,” In: R. Lal, Ed., Climate Change and Food Security in South Asia, Springer, Dordrecht, 2011, pp. 459-476.
- S. Rahman, “Determinants of Crop Choices by Bangladeshi Farmers: A Bivariate Probit Analysis,” Asian Journal of Agriculture and Development, Vol. 5, No. 1, 2008, pp. 29-42.
- S. Rahman, “Six Decades of Agricultural Land Use Change in Bangladesh: Effects on Crop Diversity, Productivity, Food Availability and the Environment, 1948- 2006,” Singapore Journal of Tropical Geography, Vol. 31, No. 2, 2010, pp. 254-269. doi:10.1111/j.1467-9493.2010.00394.x
- Bangladesh Bureau of Statistics, “Area, Yield Rates and Productions of Major Crops 2007-2010, Summary Crop Statistics,” 2011. http://www.bbs.gov.bd/WebTestApplication/userfiles/Image/AgricultureCensus/All_Crops_summary_09-10.pdf
- S. A. Sattar, “Bridging the Rice Yield Gap in Bangladesh,” In: M. K. Papademetriou, F. J. Dent and E. M. Herath, Eds., Bridging the Rice Yield Gap in the Asia-Pacific Region, RAP Publication, Food and Agriculture Organization of the United Nations, Regional Office for Asia and the Pacific, Bangkok, 2000, pp. 58-68.
- H. M. Naser, N. C. Basak and M. F. Islam, “Effect of Rice Straw and Chemical Fertilizers on the Productivity and Economics of Boro Rice-Transplanted Aman Rice System,” Journal of Biological Sciences, Vol. 1, No. 9, 2001, pp. 831-834. doi:10.3923/jbs.2001.831.834
- S. Shahid, “Rainfall Variability and the Trends of Wet and Dry Periods in Bangladesh,” International Journal of Climatology, Vol. 30, No. 15, 2010, pp. 2299-2313. doi:10.1002/joc.2053
- N. M. Mia, “Variations of Temperature of Bangladesh,” Proceedings of the Seminar on Climate Variability in the South Asian Region and Its Impacts, Dhaka, 10-12 December 2002.
- S. Shahid, “Impact of Climate Change on Irrigation Water Demand of Dry Season Boro Rice in Northwest Bangladesh,” Climatic Change, Vol. 105, No. 3-4, 2011, pp. 433-453. doi:10.1007/s10584-010-9895-5
- Bangladesh Bureau of Statistics, “Statistical Pocket Book- 2009,” 2009. http://www.bbs.gov.bd/WebTestApplication/userfiles/Image/SubjectMatterDataIndex/pk_book_09.pdf
- M. Lal, “Implications of Climate Change in Sustained Agricultural Productivity in South Asia,” Regional Environmental Change, Vol. 11, No. 1, 2011, pp. 79-94. doi:10.1007/s10113-010-0166-9
- W. May, “Simulation of the Variability and Extremes of Daily Rainfall during the Indian Summer Monsoon for Present and Future Times in a Global Time-Slice Experiment,” Climate Dynamics, Vol. 22, No. 2-3, 2004, pp. 183-204. doi:10.1007/s00382-003-0373-x
- S. A. Wasimi, “Climate Change Trends in Bangladesh” Proceedings of the 2nd International Conference on Water and Flood Management, Institute of Water and Flood Management, BUET, Dhaka, Vol. 1, 2009, pp. 203-210.
- R. P. Allan and B. J. Soden, “Atmospheric Warming and the Amplification of Precipitation Extremes,” Science, Vol. 321, No. 5895, 2008, pp. 1481-1484. doi:10.1126/science.1160787
- S. B. Murshed, A. K. M. Islam and M. S. A. Khan, “Impact of Climate Change on Rainfall Intensity in Bangladesh,” Proceedings of the 3rd International Conference on Water & Flood Management, Dhaka, 8-10 January 2011, p. 8.
- H. S. M. Faruque and M. L. Ali, “Climate Change and Water Resources in South Asia,” In: M. M. Q. Mirza and Q. K. Ahmad, Eds., Climate Change and Water Resources in South Asia, A. A. Balkema Publishers, Leiden, 2005, pp. 231-254.
- S. Shahid, “Recent Trends in the Climate of Bangladesh,” Climate Research, Vol. 42, No. 3, 2010, pp. 185-193. doi:10.3354/cr00889
- S. Shahid, X. Chen and M. K. Hazarika, “Evaluation of Groundwater Quality for Irrigation in Bangladesh Using Geographic Information System,” Journal of Hydrology and Hydromechanics, Vol. 54, No. 1, 2006, pp. 3-14.
- P. Goovaerts, “Ordinary Cokriging Revisited,” Mathematical Geology, Vol. 30, No. 1, 1998, pp. 21-42. doi:10.1023/A:1021757104135
- K. Johnston, J. M. Ver Hoef, K. Krivoruchko and N. Lucas, “Using ArcGIS™ Geostatistical Analyst,” ESRI, Redlands, 2001.
- J. Duchon, “Splines Minimizing Rotation-Invariant SemiNorms in Sobolev Spaces,” Constructive Theory of Functions of Several Variables, Lecture Notes in Mathematics, Springer, Berlin, Vol. 571, 1977, pp. 85-100. doi:10.1007/BFb0086566
- N. Cressie, “Statistics for Spatial Data,” Revised Edition, John Wiley and Sons, New York, 1993.
- J. Chiles and P. Delfiner, “Geostatistics. Modeling Spatial Uncertainty,” John Wiley and Sons, New York, 1999. doi:10.1002/9780470316993
- D. Shepard, “A Two-Dimensional Interpolation Function for Irregularly-Spaced Data,” Proceedings of the 23rd ACM National Conference, ACM, New York, 1968, pp. 517-524.
- E. Linacre, “Climate Data and Resources: A Reference and Guide,” Routledge, London, 1992.
- IPCC, “Summary for Policymakers,” In: M. L. Parry, O. F. Canziani, J. P. Palutikof, P. J. van der Linden and C. E. Hanson, Eds., Climate Change 2007: Impacts, Adaptation and Vulnerability. Contribution of Working Group II to the 4th Assessment Report of the Intergovernmental Panel on Climate Change, Cambridge University Press, Cambridge, 2007, pp. 7-22.