Journal of Flow Control, Measurement & Visualization
Vol.03 No.01(2015), Article ID:52277,11 pages
10.4236/jfcmv.2015.31002
Improvement on Quantitative Measurement of Fly Ash Contents Using Laser-Induced Breakdown Spectroscopy
Zhenzhen Wang1,2, Yoshihiro Deguchi2, Hiroaki Watanabe3, Ryoichi Kurose4, Junjie Yan1, Jiping Liu1
1State Key Laboratory of Multiphase Flow in Power Engineering, Xi’an Jiaotong University, Xi’an, China
2Graduate School of Advanced Technology and Science, The University of Tokushima, Tokushima, Japan
3Energy Engineering Research Laboratory, The Central Research Institute of Electric Power Industry, Kanagawa, Japan
4Department of Mechanical Engineering and Science, Advanced Research Institute of Fluid Science and Engineering, Kyoto University, Kyoto, Japan
Email: zhenzhen@stu.xjtu.edu.cn
Copyright © 2015 by authors and Scientific Research Publishing Inc.
This work is licensed under the Creative Commons Attribution International License (CC BY).
http://creativecommons.org/licenses/by/4.0/


Received 26 August 2014; revised 16 October 2014; accepted 12 November 2014
ABSTRACT
Contents of fly ash are important factors for the operation of coal-fired plants. Real-time monitoring of coal and fly ash such as unburned carbon in fly ash can be an indicator of the combustion conditions. Because of the strong signal intensity and the relative simplicity of the LIBS (Laser- Induced Breakdown Spectroscopy) technique, LIBS can be applicable for real-time composition measurement of coal and fly ash. This research presented here focused on the clarification of the effects of plasma temperature and coexisting materials on quantitative measurement of fly ash contents. Quantitative capability of LIBS was improved using the proposed plasma temperature correction method. The CO2 effect was also discussed to accurately evaluate unburned carbon in fly ash in exhausts. Using the results shown in this study, quantitative measurement of fly ash contents has been improved for wider applications of LIBS to practical fields.
Keywords:
Laser-Induced Breakdown Spectroscopy, Fly Ash, Temperature Correction, CO2 Effect

1. Introduction
The coal provides the largest share of world electricity generation and the thermal power plant share is dominant in total electric power supply in the world. Operating characteristics of coal-fired boilers are heavily influenced by factors such as differences in fuel properties and the combustion conditions. Accordingly, in order to achieve optimal operation of multiple coal-fired boilers, it is necessary to accurately understand the state of combustion and to adjust the control parameters. The research presented here focused on the quantity of unburned carbon in fly ash as an indicator of the combustion state, considering the measured value as a basis for optimal and stable boiler combustion control, as well as fly ash quality control.
Recently, Laser-Induced Breakdown Spectroscopy (LIBS) technique has been applied to various industrial fields [1] - [7] because of the fast response, high sensitivity, real-time and non-contact features. For the purpose of improving the economy and security of power plant, the content measurement of unburned carbon and other materials is essential for adjusting the boiler combustion. LIBS is suitable for composition measurement in gas, liquid, and solid materials [8] - [16] . This method is also suited to the analysis of heterogeneous materials such as fly ash and coal [17] - [20] and has been widely applied to analyze the compositional characterization of coal. For example, inorganic species in coal were analyzed quantitatively under different conditions [21] [22] . The solid sample features higher homogeneity than powdered counterparts. LIBS has also been applied for detection of unburned carbon in fly ash, char and pulverized coal under high-pressure and high-temperature conditions. The calibration difficulty of aerosol sample was surpassed by the correction factors. This automated LIBS apparatus was also applied in a boiler-control system of a power plant with the objective of achieving optimal and stable combustion [23] [24] , which enabled real-time measurement of unburned carbon in fly ash. This apparatus featured a detection time capability of less than 1 minute, which showed better real-time capability compared to most of the studies with the preparation of samples and analysis procedures [18] [25] . The boiler control in the real power plant was also demonstrated to achieve an optimized operation without time consumption. The contents of size-segregated particles depending on particle diameter have been measured using LIBS. The plasma temperature correction method was introduced to the size-segregated fly ash and pulverized coal to detect their quantitative contents [26] .
In this study, improvement on quantification of LIBS has been demonstrated in terms of plasma temperature and surrounding gas effects to further applications. These factors are important for practical applications; however, they have not been fully discussed in previous studies [23] [24] . Dependence of elemental signals of LIBS on the plasma temperature attributes to a very complex process in plasma. Several studies have reported the LTE (Local Thermodynamic Equilibrium) condition of plasma in several types of plasmas [27] . The plasma temperature is a very important factor for the quantification of the LIBS measurement [1] [24] . The correction factor depends on the experimental parameters such as the optical setups, pressure, buffer gas composition, and so on. Because the plasma induced by the LIBS process is not uniform and complex, LTE can be assumed in the limited range of these conditions. The effects of non-equilibrium were discussed using the intensity ratio of the emission pair of magnesium atom as a plasma temperature indicator and the appropriate range of the plasma temperature indicator was shown for quantification. The CO2 effects were also shown and the requirement for quantification was discussed for the real-time measurement of unburned carbon in fly ash for the application of coal-fired power plants.
2. Theory
A calibration of the LIBS signal is necessary for quantitative analysis. Despite the fact that the LIBS processes involved are complex, the emission intensity from the atomized species can be described by the following equation with the assumption of uniform plasma temperature [1] [23] [24] [28] :
 (1)
(1)
In the above expression, Ii is the emission intensity of species i, ni is the concentration of species i, Ki,j is a variable that includes the Einstein A coefficient from the upper energy level j, gi,j is the statistical weight of species i at the upper energy level j, Ei.j is the upper level energy of species i, k is the Boltzmann constant and T is the plasma temperature. In Equation (1), there are several factors that affect the emission intensity Ii, including plasma temperature, plasma non-uniformity, and matrix effects, etc. The appropriate correction factors must be contained in Ki,j to obtain quantitative results.
The main components of fly ash are Si, Al, Fe, Ca and C (carbon). The carbon content in fly ash can be calculated using the emission intensity ratios of Al, Fe, Ca and C to Si that is the main element in fly ash, from the following relation:
 (2)
(2)
αi is a variable factor related to species i, which contains the plasma temperature correction factor. These parameters have to be determined in the experimental operating conditions. Other species contents besides carbon, such as Al, Fe and Ca, can also be calculated using the similar relation.
In Equation (1), a uniform plasma temperature is assumed. Actually, emission intensity Ii is a function of concentration of species i and plasma temperature. The emission intensity for each element also fluctuates with plasma temperature, which introduces error into quantitative measurements. There are several methods of plasma temperature correction. The following equation is used in this study. αi is defined by use of the intensity ratio of Im,j1/Im,j2:
 (3)
(3)
Di,j is the emission intensity correction factor from the upper energy level j of species i. Im,j1 is the emission intensity from the upper energy level j1 of species m, Im,j2 is the emission intensity from the upper energy level j2 of species m, and bi,m is the temperature correction factor of the emission pair of Im,j1 and Im,j2 for species i.
 is dependent on plasma temperature and is used for plasma temperature correction. Different
spectral lines from the same species are selected to correct the plasma temperature dependence of the emission intensity, and the intensity ratio of the emission pair is determined from Equation (1):
 (4)
(4)
Applying the intensity ratio to Equation (3), αi becomes:
![]() (5)
(5)
Taking C (carbon) from the upper energy level jC for example, the concentration ratio is as follows:
![]() (6)
(6)
This ratio becomes a function of species concentration and does not depend on the plasma temperature on condition that bC,m is given as follows:
![]() (7)
(7)
From this analytical result, the correction factor can be calculated using the above equation. However, the correction factor depends on the experimental parameters such as the optical setups, pressure, buffer gas composition, and so on. The plasma induced by the LIBS process is not uniform and complex and LTE can be assumed in the limited range of these experimental conditions. In the case of ion emission intensities it is also necessary to consider the degree of ionization which can be calculated by the Saha equation as a function of plasma temperature and electron number density in a LTE condition. Therefore the correction factor cannot be determined by the theory and should be evaluated under actual experimental conditions. In this study the ranges of LTE conditions were categorized using the intensity ratio of the emission pair of magnesium atom as a plasma temperature indicator and Equation (3) was used for the plasma temperature correction.
3. Experimental Apparatus
Figure 1 shows the experimental apparatus used in this study. A Q-switched Nd:YAG laser (LOTIS TII, LS-2137U, 6 - 8 ns, energy stability: 2.5%, beam diameter: 8 mm, 10 Hz) was operated at 1064 nm with pulse energy of 30 - 90 mJ/p and laser beam was focused into the measurement area to make a plasma using a f = 200 mm lens. The samples were introduced to the measurement area by the 1.8 mm (inner diameter) stainless steel pipe and the breakdown of the particles was occurred along the laser path around the focusing point. The emission signals were separated from the laser path using a splitter and focused into abundled optical fiber with 24 fibers. The spectra were dispersed using a spectrometer (JASCOCT-10S) and detected by an ICCD camera (iStar 334T Series, Andor) with the wavelength resolution of 0.072 nm/pixel, FWHM of 0.5 nm and spectral bandwidth of 65 nm. The ICCD camera consisted of 1024 × 1024 active pixels with an effective active area of 13.3 mm × 13.3 mm and was cooled to −30˚C. The effective CCD pixel size was 13 μm × 13 μm. The frame rate was 4 image/sec. The row of the ICCD camera was used as wavelength axis and the column as the position axis of 24 fibers. Each spectrum was evaluated by summing the signal intensity of each column. The temperature correction factors were detected using laser power of 30 mJ/p and different delay time from 800 ns to 3000 ns by the measurement of a fly ash sample. Temperature correction factors and LTE conditions were determined using a fly ash sample by the intensity ratio of the emission pair of magnesium atom as a plasma temperature indicator. The data was acquired by setting the accumulation of 10 s each time. Pulverized coal (Newlands Coal) was added to combustion-supporting gas of methane and air using a feeder (Nisshin Engineering Inc. Feedcon-μ Mtype) and then introduced to the Bunsen-type burner. The flow rates of methane, air and coal were 3.9 l/min, 15.6 l/min and 0.41 g/min, respectively. A sampling pipe above the burner was employed to connect with the vacuum chamber of LIBS analyzer. The compositions of coal and fly ash used in this study are summarized in Table 1.
![]()
Figure 1. Schematic diagram of the experimental apparatus.

Table 1. Compositions of coal and fly ash samples.
4. Results and Discussion
4.1. Temperature Correction Factors
In LIBS applications the plasma generation process contains several physical phenomena such as electron impact ionization and ion recombination, and its plasma temperature intrinsically fluctuates causing the fluctuation of evaluated concentrations from the LIBS signal intensities. Therefore the plasma temperature correction becomes important to assure the quantitative measurement, especially for the particle measurement in gases. The fly ash sample was used to determine the plasma temperature correction factors under different experimental conditions. Figure 2 shows LIBS spectra of fly ash in delay time of 800 ns, 1500 ns and 3000 ns with the laser power of 30 mJ/p. The intensity concerning species concentration varied with different delay time, which means the alteration of plasma temperature. The emission lines listed in Table 2 were used for the analysis of species concentration [29] . The ratio of IMg1/IMg2 was used for the plasma temperature correction factor as shown in Equation (3). IMg1/IMg2 was altered between 4 - 24 by changing the delay time between 800 ns - 3000 ns. IMg1/IMg2
Table 2. Upper level energy of detection species in fly ash.
![]() (a)
(a)![]()
![]() (b) (c)
(b) (c)
Figure 2. LIBS spectra of fly ash in different delay time (laser power: 30 mJ/p, gate width: 300 ns). (a) Delay time: 800 ns; (b) Delay time: 1500 ns; (c) Delay time: 3000 ns.
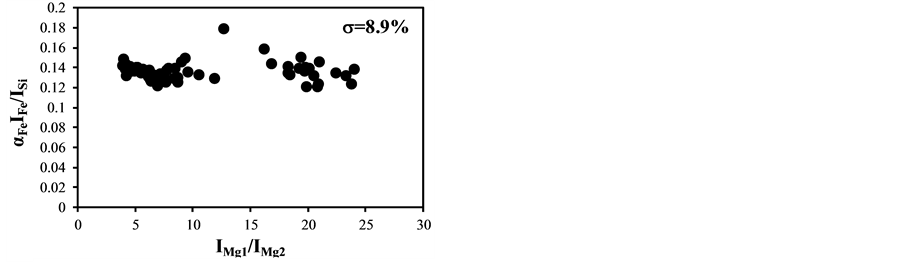
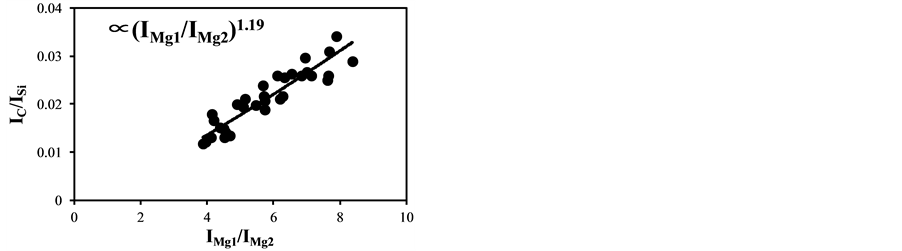
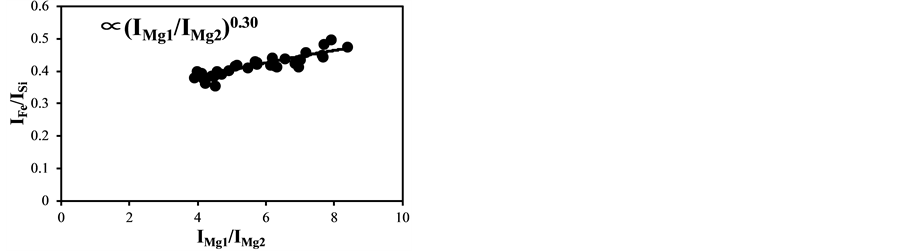
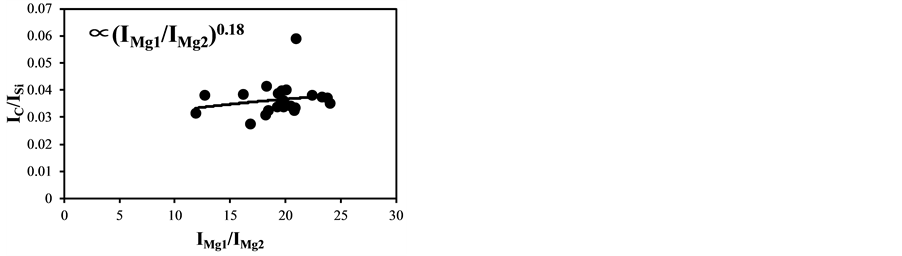
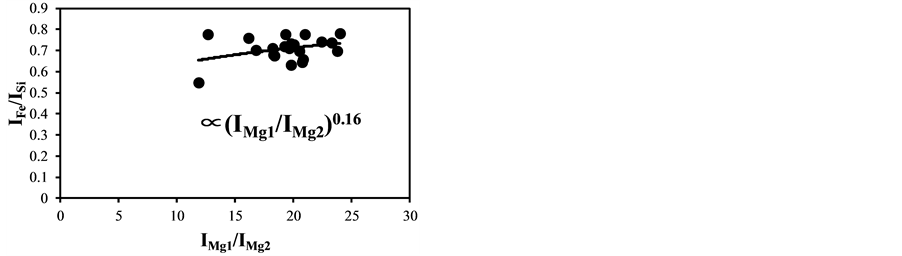
became bigger according to the decrease of the delay time. The typical temperature correction curves between IMg1/IMg2: 4 - 24 and temperature corrected results of IC/ISi and IFe/ISi are shown in Figure 3. It is clear from Figure 3(a) and Figure 3(b) that the ratios are influenced by the plasma temperature, which is directly related to the ratio of IMg1/IMg2. By applying the temperature correction scheme described in Equations (2)-(7), the fluctuation of IC/ISi and IFe/ISi became smaller at different plasma temperatures, i.e. IMg1/IMg2. However, the plasma temperature dependencies of IMg1/IMg2 are apparently different between IMg1/IMg2: 4 - 8, which means the low plasma temperature condition, and IMg1/IMg2: 12 - 24, i.e. high plasma temperature condition. The high temperature condition corresponds to the initial process of the plasma generation from the fly ash particles and its expansion process to the surrounding air. While the low temperature condition is formed after the plasma expansion to the surrounding air. This result means that the plasma induced by the LIBS process is not uniform and complex and LTE can be assumed in the limited range of plasma temperature, i.e. IMg1/IMg2. The limitation of LTE assumption has been also discussed in the glow discharge plasma [27] , and the understanding of the phenomena is important for the quantitative measurement, which requires the accurate plasma correction.
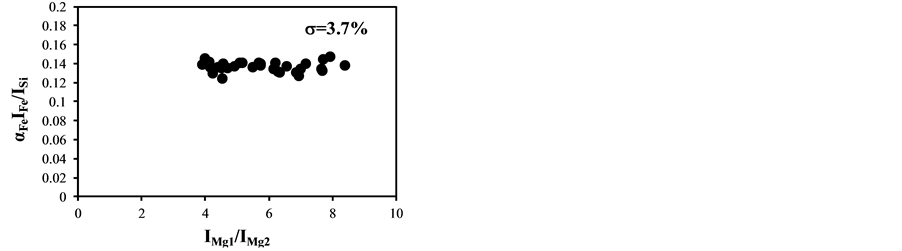
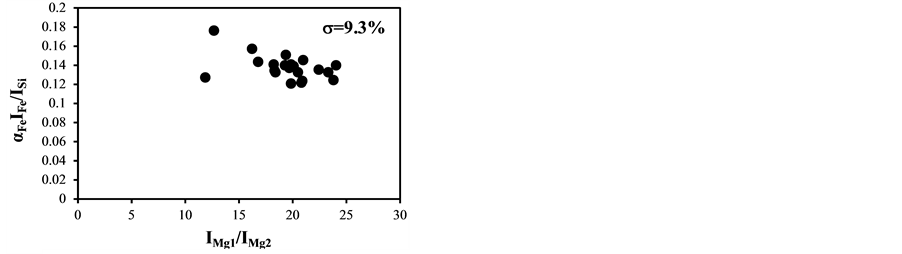
The temperature correction curves between IMg1/IMg2: 4 - 8 and temperature corrected results of IC/ISi and IFe/ISi are shown in Figure 4. Figure 5 shows those between IMg1/IMg2: 12 - 24. It is clear from Figure 4(a) and Figure 4(b) that the correction curves are much more accurate than those in Figure 3(a) and Figure 3(b) and Figure 5(a) and Figure 5(b), and bi,m in Equation (3) takes the different values depending on the range of IMg1/IMg2, which means the limitation of LTE assumption. In the high temperature plasma, i.e. IMg1/IMg2: 12 - 24, the plasma is not uniform due to the initial process of the plasma generation from the fly ash particles and its expansion process to the surrounding air. With the increase of delay time, the plasma becomes uniform compared to the initial process of the plasma generation and tends to follow the LTE condition. The fluctuations of the concentration ratios of C/SiO2 and Fe2O3/SiO2 corrected by the correction factor bi,m in the range of IMg1/IMg2: 4 - 24 are 17% and 8.9%, respectively. The fluctuations of the concentration ratios do not improve by limiting the range of IMg1/IMg2: 12 - 24. On the other hand the fluctuations of these ratios corrected by the correction factor bi,m in the range of IMg1/IMg2: 4 - 8 reduce to be 11% and 3.7%. This phenomenon also appears in other species
![]()
![]() (a) (b)
(a) (b)![]()
 (c) (d)
Figure 3. Correction curves and results of plasma temperature between IMg1/IMg2: 4 - 24. (a) Correction factor for the IC/ISi ratio; (b) Correction factor for the IFe/ISi ratio; (c) Correction result for the IC/ISi ratio; (d) Correction result for the IFe/ISi ratio.
 (a) (b)
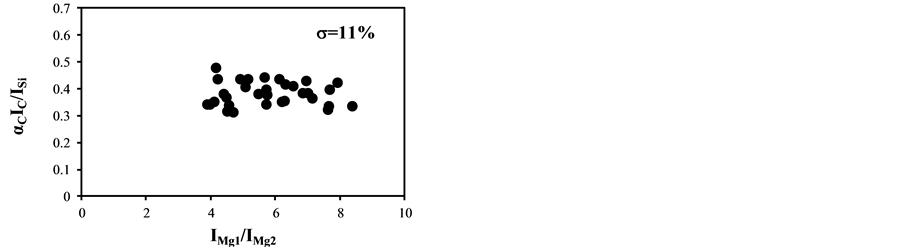
 (c) (d)
Figure 4. Correction curves and results of plasma temperature between IMg1/IMg2: 4 - 8. (a) Correction factor for the IC/ISi ratio; (b) Correction factor for the IFe/ISi ratio; (c) Correction result for the IC/ISi ratio; (d) Correction result for the IFe/ISi ratio.
 (a) (b)
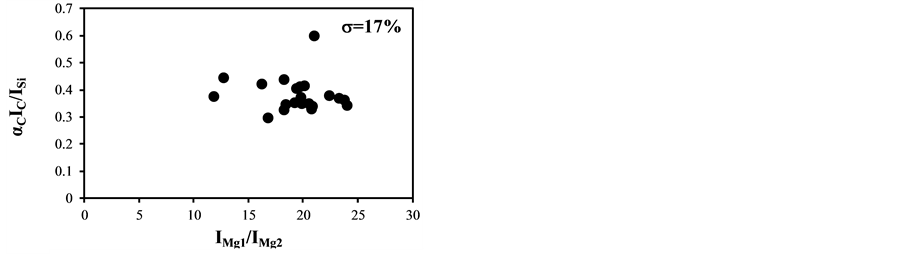
 (c) (d)
Figure 5. Correction curves and results of plasma temperature between IMg1/IMg2: 12 - 24. (a) Correction factor for the IC/ISi ratio; (b) Correction factor for the IFe/ISi ratio; (c) Correction result for the IC/ISi ratio; (d) Correction result for the IFe/ISi ratio.
such as IAl/ISi and ICa/ISi. The results for C/SiO2, Al2O3/SiO2, Fe2O3/SiO2 and CaO/SiO2 are summarized in Table 3. The correction characteristics for these concentration ratios show the same tendency as described above and it is important to set measurement condition within an appropriate IMg1/IMg2 range. The cause of fluctuation in the temperature corrected results is also attributed to the sample uniformity. Because the fly ash contents are not uniform in the microscopic sense. Using this set of experimentally determined correction factors by choosing the appropriate IMg1/IMg2 range, the fluctuations of the concentration ratios such as Fe2O3/SiO2, Al2O3/SiO2, CaO/SiO2, C/SiO2, were greatly reduced.
There are several plasma temperature correction methods such as employing the Boltzmann plot method which uses several emission lines from the same atom from the wide-wavelength LIBS spectra. The calibration method using the Boltzmann, which often called “CF (calibration free) LIBS”, is a systematic approach for the temperature correction. However it requires wide-wavelength LIBS spectra and causes the loss of the signal intensity and the complication of the systems [30] [31] . The method employed in this paper can be applied using the LIBS spectra with the wavelength range of 240 - 320 nm and keeps the sufficient signal intensity with sufficient plasma temperature correction capability for fly ash measurements. Considering the system simplicity and real-time measurement capability, the temperature correction method employing emission pair of IMg1 and IMg2 is preferable compared to others, which demonstrated that the method is workable and satisfactory for practical applications by choosing the appropriate plasma temperature correction range.
4.2. Influence of Coexisting Gases
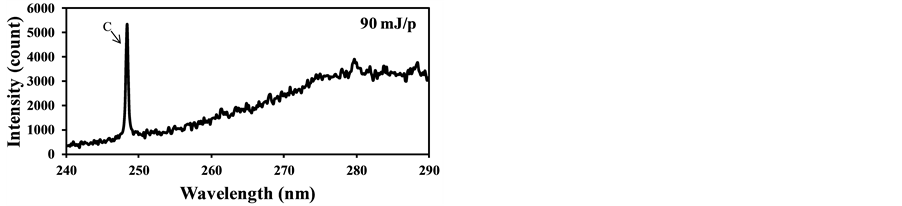
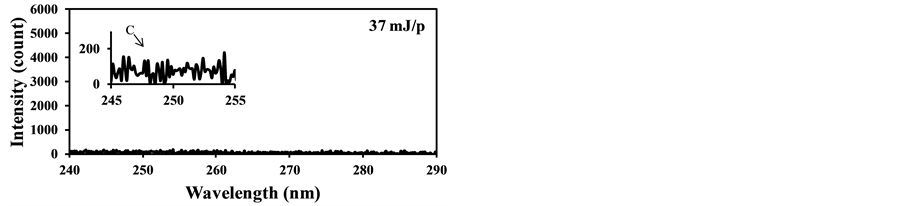
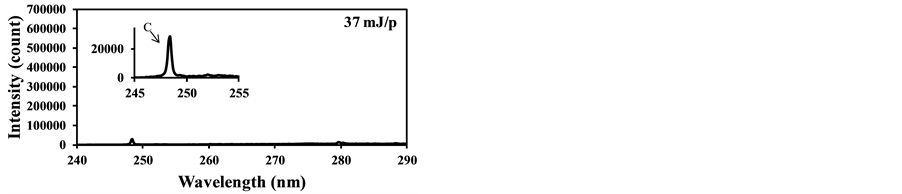
In the case of fly ash measurement at actual conditions such as the real-time measurement of fly ash contents in exhausts of coal-fired boilers, influence of coexisting gases such as CO2 must be considered to maintain the quantitative measurement of this method. In the case of particle contents measurement in gases using LIBS, the effects of coexisting gases become important because the gas phase materials also produce plasma caused by the particle breakdowns. Figure 6 shows the LIBS signals from the burned gas of the burner without coal addition using different laser power. It is clear from Figure 6(a), the burned gas was broken by the laser input of 90 mJ/p and the strong C signal caused by the CO2 breakdown was detected at 247.9 nm. When reducing the laser power, the C signal became small and the C signal disappeared at 37 mJ/p as shown in Figure 6(b). On the other hand, when the pulverized coal was added in the fuel and the fly ash in the burned gas was measured. The signals of
 (a) (b)
Figure 6. LIBS spectra of burned gas without pulverized coal addition (delay time: 1000 ns, gate width: 300 ns). (a) Laser power: 90 mJ/p; (b) Laser power: 37 mJ/p.
Table 3. Standard deviation of LIBS measurement depending on IMg1/IMg2 correction range.
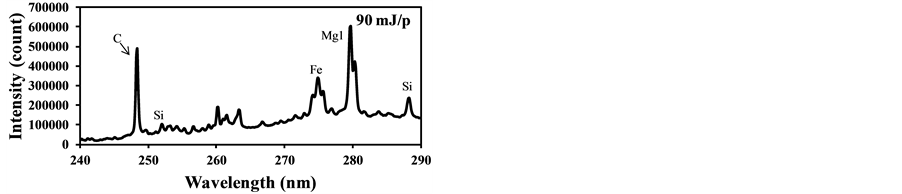
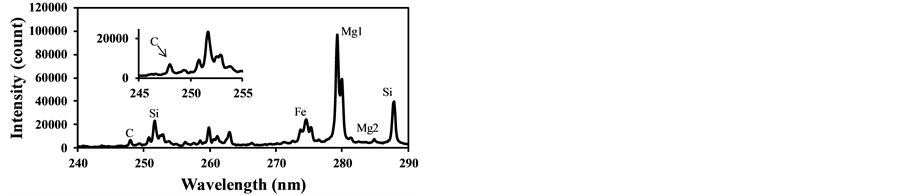
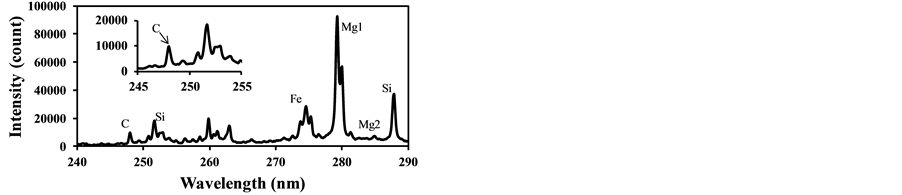
fly ash contents such as Si and Fe were measured along with the strong C signal as Figure 7(a) shows. This C signal is mainly produced by CO2 in burned gas and it interferes with the measurement of carbon content in fly ash. Figure 7(b) shows that the C signal was also detected using the laser power of 37 mJ/p in the case of the fuel with pulverized coal, though it was not detected without pulverized coal as shown in Figure 6(b). This is because the particles such as fly ash became the core of the plasma and the plasma expanded to the surrounding gases. The influence of coexisting gases in LIBS depends on the measurement conditions, especially the particle conditions in gases, and its effects must be evaluated in the actual measurement applications.
Figure 8 shows the LIBS spectra of fly ash with different CO2 concentration. In this experiment the fly ash was introduced into the measurement area with the addition of CO2 in air. As CO2 concentration increases, the C signal increases compared to other signals while other signal ratios such as Fe and Si remain the same. This is because the breakdown of CO2 added in air was induced by the fly ash plasma. As shown in Figure 6(b) the C signal does not appear without pulverized coal addition. Figure 9 shows the dependence of IC/ISi on CO2 concentration that was measured two times at each CO2 concentration. The CO2 effect is rather sensitive to the concentration in surrounding gas and less than 1% CO2 causes the spurious C signal in LIBS spectra of fly ash. The measured results also fluctuated under the conditions with the same CO2 concentration because of the unstable breakdown phenomena of CO2 induced by fly ash. Therefore it is important to reduce the CO2 content in burned gas when applying LIBS for unburned carbon content in fly ash under burned gas conditions. The threshold
 (a) (b)
Figure 7. LIBS spectra of burned gas with pulverized coal addition (delay time: 1000 ns, gate width: 300 ns). (a) Laser power: 90 mJ/p; (b) Laser power: 37 mJ/p.
 (a) (b)
Figure 8. LIBS spectra of fly ash with different CO2 concentration(laser power: 37 mJ/p, delay time: 1000 ns, gate width: 300 ns). (a) CO2: 0.84%; (b) CO2: 2.5%.
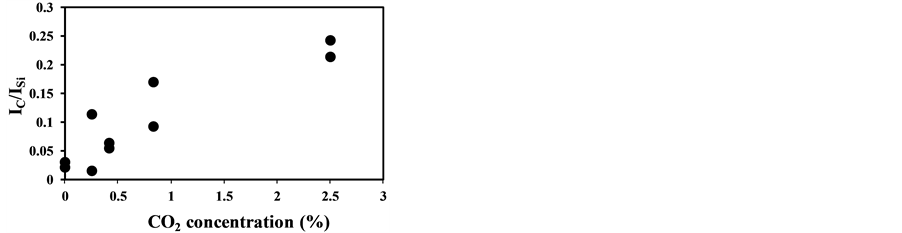
Figure 9. CO2 concentration dependence of IC/ISi (laser power: 37 mJ/p, delay time: 1000 ns, gate width: 300 ns).
level of CO2 depends on the measurement conditions such as the range of carbon contents and particle density. CO2 effect is highly laser power-dependent. An appropriate laser power setting is essential to minimize this spurious carbon signal. Increased pressure aggravates the problem due to the breakdown of CO2 molecules. Careful attention is needed under high-pressure conditions [23] . The experimental parameters must be determined for the actual operation conditions. The sampling of fly ash using a cyclone employed in the coal-fired power plant is one of the effective methods to reduce this CO2 effect [24] .
5. Conclusions
Contents of fly ash are important factors for the operation of coal-fired plants. This research has specified the effects of plasma temperature and coexisting materials to the quantitative measurement of contents of fly ash. Quantitative capability of LIBS was improved using the plasma temperature correction method by choosing the appropriate temperature correction range. The CO2 effect was also clarified to accurately evaluate unburned carbon in fly ash in exhausts.
1) LTE was assumed in a limited range of plasma temperature in laser-induced plasma and the quantitative measurement was improved by choosing the appropriate plasma temperature range. In the case of fly ash measurement, the emission intensity ratio of Mg: IMg1/IMg2 became a plasma temperature indicator and the range of IMg1/IMg2: 4 - 8 showed better LTE condition resulting in the accurate plasma correction compared to the range of IMg1/IMg2: 12 - 24.
2) In the measurement of fly ash contents, CO2 caused the spurious C signal in LIBS spectra of fly ash. The CO2 effect was rather sensitive to the concentration in surrounding gas and less than 1% CO2 caused the spurious C signal. It became important to reduce the CO2 content in burned gas when applying LIBS for the measurement of unburned carbon content in fly ash under the burned gas conditions.
References
- Deguchi, Y. (2011) Industrial Applications of Laser Diagnostics. CRC Press, New York. http://dx.doi.org/10.1201/b11497
- Noll, R., Mönch, I., Klein, O. and Lamott, A. (2005) Concept and Operating Performance of Inspection Machines for Industrial Use Based on Laser Induced Breakdown Spectroscopy. Spectrochimica Acta Part B, 60, 1070-1075. http://dx.doi.org/10.1016/j.sab.2005.05.025
- Gaft, M., Sapir-Sofer, I., Modiano, H. and Stana, R. (2007) Laser Induced Breakdown Spectroscopy for Bulk Minerals Online Analyses. Spectrochimica Acta Part B, 62, 1496-1503. http://dx.doi.org/10.1016/j.sab.2007.10.041
- Boué-Bigne, F. (2008) Laser-Induced Breakdown Spectroscopy Applications in the Steel Industry: Rapid Analysis of Segregation and Decarburization. Spectrochimica Acta Part B, 63, 1122-1129. http://dx.doi.org/10.1016/j.sab.2008.08.014
- St-Onge, L., Kwong, E., Sabsabi, M. and Vadas, E.B. (2002) Quantitative Analysis of Pharmaceutical Products by Laser-Induced Breakdown Spectroscopy. Spectrochimica Acta Part B, 57, 1131-1140. http://dx.doi.org/10.1016/S0584-8547(02)00062-9
- Juvé, V., Portelli, R., Boueri, M., Baudelet, M. and Yu, J. (2008) Space-Resolved Analysis of Trace Elements in Fresh Vegetables Using Ultraviolet Nanosecond Laser-Induced Breakdown Spectroscopy. Spectrochimica Acta Part B, 63, 1047-1053. http://dx.doi.org/10.1016/j.sab.2008.08.009
- Ma, Q.L., Motto-Ros, V., Lei, W.Q., Boueri, M., Zheng, L.J., Zeng, H.P., Bar-Matthews, M., Ayalon, A., Panczer, G. and Yu, J. (2010) Multi-Elemental Mapping of a Speleothem Using Laser-Induced Breakdown Spectroscopy. Spectrochimica Acta Part B, 65, 707-714. http://dx.doi.org/10.1016/j.sab.2010.03.004
- Peter, L., Sturm, V. and Noll, R. (2003) Liquid Steel Analysis with Laser-Induced Breakdown Spectrometry in the Vacuum Ultraviolet. Applied Optics, 42, 6199-6204. http://dx.doi.org/10.1364/AO.42.006199
- Wang, Z.Z., Deguchi, Y., Kuwahara, M., Yan, J.J. and Liu, J.P. (2013) Enhancement of Laser-Induced Breakdown Spectroscopy (LIBS) Detection Limit Using a Low-Pressure and Short-Pulse Laser-Induced Plasma Process. Applied Spectroscopy, 67, 1242-1251. http://dx.doi.org/10.1366/13-07131
- Wang, Z.Z., Deguchi, Y., Kuwahara, M., Zhang, X.B., Yan, J.J. and Liu, J.P. (2013) Sensitive Measurement of Trace Mercury Using Low Pressure Laser-Induced Plasma. Japanese Journal of Applied Physics Part 2, 52, Article ID: 11NC05.
- Yaroshchyk, P., Morrison, R.J.S., Body, D. and Chadwick, B.L. (2005) Quantitative Determination of Wear Metals in Engine Oils Using LIBS: The Use of Paper Substrates and a Comparison between Single- and Double-Pulse LIBS. Spectrochimica Acta Part B, 60, 1482-1485. http://dx.doi.org/10.1016/j.sab.2005.09.002
- Yueh, F.Y., Sharma, R.C., Singh, J.P., Zhang, H.S. and Spencer, W.A. (2002) Evaluation of the Potential of Laser- Induced Breakdown Spectroscopy for Detection of Trace Element in Liquid. Journal of the Air & Waste Management Association, 52, 1307-1315. http://dx.doi.org/10.1080/10473289.2002.10470860
- Hubmer, G., Kitzberger, R. and Mörwald, K. (2006) Application of LIBS to the In-Line Process Control of Liquid High-Alloy Steel under Pressure. Analytical and Bioanalytical Chemistry, 385, 219-224. http://dx.doi.org/10.1007/s00216-006-0321-9
- Laville, S., Sabsabi, M. and Doucet, F.R. (2007) Multi-Elemental Analysis of Solidified Mineral Melt Samples by Laser-Induced Breakdown Spectroscopy Coupled with a Linear Multivariate Calibration. Spectrochimica Acta Part B, 62, 1557-1566.
- Goueguel, C., Laville, S., Vidal, F., Sabsabi, M. and Chaker, M. (2010) Investigation of Resonance-Enhanced Laser- Induced Breakdown Spectroscopy for Analysis of Aluminium Alloys. Journal of Analytical Atomic Spectrometry, 25, 635-644. http://dx.doi.org/10.1039/b927013b
- Diwakar, P.K., Loper, K.H., Matiaske, A.M. and Hahn, D.W. (2012) Laser-Induced Breakdown Spectroscopy for Analysis of Micro and Nanoparticles. Journal of Analytical Atomic Spectrometry, 27, 1110-1119. http://dx.doi.org/10.1039/c2ja30012e
- Panne, U., Haisch, C., Clara, M. and Niessner, R. (1998) Analysis of Glass and Glass Melts during the Vitrification Process of Fly and Bottom Ashes by Laser-Induced Plasma Spectroscopy. Part I: Normalization and Plasma Diagnostics. Spectrochimica Acta Part B, 53, 1957-1968. http://dx.doi.org/10.1016/S0584-8547(98)00238-9
- Ctvrtnickova, T., Mateo, M.P., Yañez, A. and Nicolas, G. (2009) Characterization of Coal Fly Ash Components by Laser-Induced Breakdown Spectroscopy. Spectrochimica Acta Part B, 64, 1093-1097. http://dx.doi.org/10.1016/j.sab.2009.07.032
- Gaft, M., Dvir, E., Modiano, H. and Schone, U. (2008) Laser Induced Breakdown Spectroscopy Machine for Online Ash Analyses in Coal. Spectrochimica Acta Part B, 63, 1177-1182. http://dx.doi.org/10.1016/j.sab.2008.06.007
- Yuan, T.B., Wang, Z., Lui, S.L., Fu, Y.T., Li, Z., Liu, J.M. and Ni, W.D. (2013) Coal Property Analysis Using Laser- Induced Breakdown Spectroscopy. Journal of Analytical Atomic Spectrometry, 28, 1045-1053.
- Mateo, M.P., Nicolas, G. and Yañez, A. (2007) Characterization of Inorganic Species in Coal by Laser-Induced Break- down Spectroscopy Using UV and IR Radiations. Applied Surface Science, 254, 868-872. http://dx.doi.org/10.1016/j.apsusc.2007.08.043
- Yuan, T.B., Wang, Z., Li, L.Z., Hou, Z.Y., Li, Z. and Ni, W.D. (2012) Quantitative Carbon Measurement in Anthracite Using Laser-Induced Breakdown Spectroscopy with Binder. Applied Optics, 51, B22-B29.
- Noda, M., Deguchi, Y., Iwasaki, S. and Yoshikawa, N. (2002) Detection of Carbon Content in a High-Temperature and High Pressure Environment Using Laser-Induced Breakdown Spectroscopy. Spectrochimica Acta Part B, 57, 701-709. http://dx.doi.org/10.1016/S0584-8547(01)00403-7
- Kurihara, M., Ikeda, K., Izawa, Y., Deguchi, Y. and Tarui, H. (2003) Optimal Boiler Control through Real-Time Monitoring of Unburned Carbon in Fly Ash by Laser-Induced Breakdown Spectroscopy. Applied Optics, 42, 6159-6165. http://dx.doi.org/10.1364/AO.42.006159
- Ctvrtnickova, T., Mateo, M.P., Yañez, A. and Nicolas, G. (2010) Laser Induced Breakdown Spectroscopy Application for Ash Characterisation for a Coal Fired Power Plant. Spectrochimica Acta Part B, 65, 734-737. http://dx.doi.org/10.1016/j.sab.2010.04.020
- Wang, Z.Z., Deguchi, Y., Kuwahara, M., Taira, T., Zhang, X.B., Yan, J.J., Liu, J.P., Watanabe, H. and Kurose, R. (2013) Quantitative Elemental Detection of Size-Segregated Particles Using Laser-Induced Breakdown Spectroscopy. Spectrochimica Acta Part B, 87, 130-138. http://dx.doi.org/10.1016/j.sab.2013.05.034
- Zhao, Y.H. and Horlick, G. (2006) A Spectral Study of Charge Transfer and Penning Processes for Cu, Zn, Ag, and Cd in a Glow Discharge. Spectrochimica Acta Part B, 61, 660-673. http://dx.doi.org/10.1016/j.sab.2006.05.010
- Goddard, B.J. (1991) Materials Analysis Using Laser-Based Spectroscopic Techniques. Transactions of the Institute of Measurement and Control, 13, 128-139. http://dx.doi.org/10.1177/014233129101300304
- Payling, R. and Larkins, P. (2000) Optical Emission Lines of the Elements. John Wiley & Sons, New York.
- Unnikrishnan, V.K., Mridul, K., Nayak, R., Alti, K., Kartha, V.B., Santhosh, C., Gupta, G.P. and Suri, B.M. (2012) Calibration-Free Laser-Induced Breakdown Spectroscopy for Quantitative Elemental Analysis of Materials. Pramana- Journal of Physics, 79, 299-310. http://dx.doi.org/10.1007/s12043-012-0298-1
- Cavalcanti, G.H., Teixeira, D.V., Legnaioli, S., Lorenzetti, G., Pardini, L. and Palleschi, V. (2013) One-Point Calibration for Calibration-Free Laser-Induced Breakdown Spectroscopy Quantitative Analysis. Spectrochimica Acta Part B, 87, 51-56. http://dx.doi.org/10.1016/j.sab.2013.05.016
Nomenclatures
Di,j: emission intensity correction factor from the upper energy level j of species i;
Ei,j: upper level energy of species i/J;
Ii: emission intensity of species i/J∙s−1;
Im,j1: emission intensity from the upper energy level j1 of species m;
Im,j2: emission intensity from the upper energy level j2 of species m;
Ki,j: a variable that includes the Einstein A coefficient from the upper energy level j/J∙m3∙s−1;
T: plasma temperature/K;
bi,m: temperature correction factor of the emission pair of Im,j1 and Im,j2 for species i;
gi,j: statistical weight of species i at the upper energy level j;
k: the Boltzmann constant/1.38 × 10−23 J∙K−1;
ni: concentration of species i/m−3;
αi: a variable factor related to species i, which contains the plasma temperature correction factor.