Journal of Flow Control, Measurement & Visualization
Vol.2 No.2(2014), Article ID:44767,10 pages DOI:10.4236/jfcmv.2014.22006
Microjet-Based Active Flow Control on a Fixed Wing UAV*
Phil Kreth, Farrukh Alvi
Florida Center for Advanced Aero-Propulsion, Florida A & M University and Florida State University, Tallahassee, FL, USA
Email: philkreth@gmail.com
Copyright © 2014 by authors and Scientific Research Publishing Inc.
This work is licensed under the Creative Commons Attribution International License (CC BY).
http://creativecommons.org/licenses/by/4.0/


Received 5 December 2013; revised 17 January 2014; accepted 6 February 2014
ABSTRACT
A fixed wing, remote controlled, unmanned aerial vehicle (UAV), has been retrofitted with a system of microjet-based actuators to test microjet efficacy for flow control during flight. This allows one to evaluate the flow control system in a more complex and uncontrolled environment relative to the “clean” laboratory flowfield. The system is composed of off-the-shelf components and provides some appreciation of the challenges associated with implementing such an active control scheme in more “practical” configurations. A wing section with actuators was first tested in a low-speed wind tunnel to characterize microjet control efficacy in the laboratory using surface flow visualizations and particle image velocimetry (PIV). The laboratory results show that the microjet actuators are an effective means of controlling separation with fairly low supply pressures and flow rates. Only relatively robust and straightforward diagnostics can be used to determine the flow conditions on the UAV during flight. As such, tufts are installed on the aircraft’s wing to serve as a qualitative way of measuring control efficacy. Results from the flight tests confirm that this flow control system is capable of delaying flow separation in the complex flows occurring during flight.
Keywords:Separation Control, Unmanned Aerial Vehicle, Flight Testing

1. Introduction
The demand for improved aerodynamic performance of modern-day aircraft has given rise to the need for active flow control devices that are capable of preventing or minimizing adverse effects that allow one to improve efficiency and/or expand the operational envelopes. These adverse effects can lead to substantial reductions in the performance of aircraft such as lift loss, increased drag, and unsteady loading. Boundary layer separation over the suction surface of wings/airfoils leads to aerodynamic stall at moderately high angles of attack (AOA), which could potentially lead to a loss of control. Therefore, delaying or eliminating flow separation on an aircraft wing is important, especially with the risk of non-recoverable control loss that is associated with stall.
Many flow control techniques have been explored for delaying boundary layer separation. These techniques are typically characterized as either active or passive methods, but the mechanisms behind the prevention of flow separation are fundamentally similar. Passive devices such as vortex generators (VGs) have been proven effective at delaying separation for certain conditions, but the parasitic drag associated with these devices when they are not in use make them less than ideal [1] . Active methods including the use of vibrating surfaces [2] , acoustic generators [3] [4] , synthetic jets [5] -[7] , and steady or unsteady blowing [8] -[16] are also effective without parasitic drag penalties, but the necessary hardware associated with such devices may add complexity and weight to an unmanned aerial vehicle.
Steady momentum injection through microjet-based actuators has been shown to be effective at eliminating or delaying separation over a wide range of flow conditions [10] -[16] . These actuators are relatively simple to integrate and produce high momentum injection with low mass flow requirements [15] [16] , making them desirable actuators for implementation to a UAV platform. Extensive studies optimizing microjet actuators for separation control have been performed by Kumar [15] [16] , who showed that steady microjet injection reattaches the separated flow in the presence of significant adverse pressure gradients over a backward-facing Stratford ramp. Issuing normal to the surface slightly upstream of the separation location, the microjets form a jet in cross-flow pattern within the boundary layer and freestream fluid. This flowfield leads to the production of streamwise vortices that entrain higher momentum freestream fluid to the low momentum regions in the separation-susceptible boundary layer [17] . This enhanced, cross-stream mixing reenergizes the boundary layer and delays flow separation. The wind tunnel studies of Kumar [15] [16] led to the implementation of microjet actuators on a remotecontrolled (RC) aircraft to test their effectiveness for flow control during realistic and complex flight conditions.
In contrast to wind tunnel experiments where there is a relatively high level of control over flow parameters and the flow is much “cleaner”, flow over aircraft is complicated by effects such as propeller downwash, flow three-dimensionalities, and changes in both wind speed and direction. In addition to minimal control over flow conditions, the implementation of a self-contained flow control system on a small-scale aircraft presents significant design and engineering challenges in both the weight addition and distribution. In this study, a self-contained, remotely operated, microjet-based active control system was implemented in an RC aircraft with the aim of delaying stall through control of flow separation on the aircraft wings. Wind tunnel studies performed on a section of the aircraft’s wing included qualitative flow visualizations and quantitative velocity field measurements using particle image velocimetry (PIV). During flight tests, control effectiveness is evaluated through flow visualizations using tufts and a miniature video camera mounted on the RC aircraft. The flight results discussed collectively demonstrate the effectiveness of this scheme, and given that the system was built using off-the-shelf hardware, this study also shows the potential feasibility of using such a scheme on certain types of aircraft.
2. Experimental Methods
2.1. Wind Tunnel Tests
The wind tunnel experiments were performed at the subsonic wind tunnel facility at the Florida Center for Advanced Aero-Propulsion Laboratory at Florida State University. This facility is a closed-loop, recirculating tunnel with a 0.61 m × 0.61 m test section that allows for optical access from all directions. The tunnel is capable of test section velocities between 1 - 90 m/s. Further details on the specifications of this facility can be found in Fernandez et al. [12] .
The model used in the wind tunnel tests was taken from the wing section of Hobby-Lobby International’s Senior Telemaster. The airfoil has the USA-35b profile that is very similar to the NACA-4412 airfoil. A section of the wing with a span of 0.61 m and chord length of 0.36 m was modified to fit in the wind tunnel facility. The microjet actuators used in this study are linear arrays of 400 µm-diameter (Dmj) micro-orifices that are machined into a section of rectangular tubing mounted inside the airfoil. The typical spacing between each orifice is 5 mm (12.5 × Dmj). The microjets, which inject normal to the airfoil surface, are supplied by compressed nitrogen. The actuators are flush-mounted in the airfoil at , just upstream of the separation location for high angles of attack. The actuators span the entire width of the model. A variety of microjet flow rates can be achieved by varying the stagnation pressure inside the actuator chambers.
Initial surface flow visualizations were obtained using an oil-based paint mixture to determine the separation location, the extent of separation, and the critical angle of attack at which stall occurs. The mixture consists of kerosene, oleic acid, and lamp black pigment in the ratio 60:4:1 by volume. Tufts were later installed on the model to compare the results from the wind tunnel studies to those obtained during the flight tests since, as subsequently discussed, flow visualization during flight tests was obtained using wing-mounted tufts. The tufts are black wool strands approximately 1 mm in diameter that protrude from the surface by about 3 cm. Finally, velocity field data was obtained using two-component particle image velocimetry (2D-PIV) to provide quantitative measurements of the flowfield over the airfoil. Measurements were obtained on a centered, chordwise plane using a Kodak ES1.0 CCD camera with a resolution of 1008 × 1012 pixels. A Rosco theatrical fog generator seeds the flow with smoke particles (approximately 2 - 5 µm in diameter [15] [16] [18] ) that are illuminated by a New Wave Nd:YAG laser with an energy output of 200 mJ/pulse and a firing rate of 15 Hz. The camera acquires double-pulsed images at 15 image pairs/second, and it is arranged such that it captures the movement of the particles over the airfoil from approximately 25% - 75% chord. Sets of 1000 images pairs were used in the calculation of all ensemble-averaged quantities.
Designed to mimic actual flight conditions for this aircraft, these experiments were conducted at freestream velocities U∞ = 10 and 20 m/s (Reynolds numbers based on chord ReC ≈ 225,000 and 450,000, respectively), and angles of attack varying from α = 0˚ - 20˚. Previous results [13] show that the stall angle for this airfoil is αcr = 13˚. For the wind tunnel tests, the primary test case discussed here corresponds with U∞ = 20 m/s and α = 16˚. This freestream velocity corresponds to typical air speeds for this aircraft. This angle of attack corresponds to the angle at which control is most effective. With control, αcr* = 16˚ becomes the new stall angle for this airfoil [13] . The non-dimensional parameter used to evaluate the microjet performance is the steady momentum coefficient, which is based on the planform area for this study. The steady momentum coefficient is the ratio of the total momentum injected into the flow relative to the freestream dynamic pressure multiplied by the planform area,  , that is,
![]() , (1)
, (1)
where ![]() is the number of microjet arrays,
is the number of microjet arrays,  is the mass flow through one array of microjets,
  is the microjet exit velocity,
  is the freestream density,
  is the freestream velocity, b is the span of the model, and
  is the chord of the model. The pressure inside of the microjet stagnation chamber was varied up to 156.5 kPa. The primary control case discussed here corresponds to 135.8 kPa, or a momentum coefficient of
 .
.
2.2. Flight Tests
The aircraft chosen as a test bed for the flight experiments is the Hobby-Lobby International’s Senior Telemaster that has an overall wingspan of 2.39 m, a chord length of 0.36 m (aspect ratio 6.6), and a wing area of 0.86 m2. The aircraft is retrofitted with an array of microjet actuators at  that spans the entire wing and an air supply system for those actuators. A miniature, high-pressure (20.7 MPa) cylinder supplies gas to the microjet arrays; a set of solenoid valves and associated electronics allows the pilot or spotter to remotely activate the control system when needed, using channels from the aircraft controller (Futaba® Model T7CAP). The microjet arrays installed on the aircraft have the same dimensions as those installed in the test section for the wind tunnel experiments. All tubing inside the aircraft has the same length to ensure uniform pressure drop across the entire set of arrays. A schematic of the modified RC aircraft is shown in Figure 1. Only one wing has been cut away to show detail in this schematic, but the microjets cover the entire wingspan of the actual aircraft. Additionally, the microjet orifices are not drawn to scale here. A standard aircraft without modifications weighs approximately 4.8 kg, whereas the total weight of the retrofitted aircraft after implementing the control system was 11.3 kg.
The aircraft is also outfitted with a small video camera and a set of tufts to visualize the flow over one of the aircraft’s wings. A photograph of the retrofitted model can be seen in Figure 2. The video camera has a resolution of 640 × 480 pixels and records at a frame rate of 25 fps. The video camera is mounted to the aircraft using a set of floating bolt assemblies that are designed to reduce vibrations through the mount. The mounting mechanism does alleviate some of the adverse vibration-induced effects, although it is necessary to post-process the images to further remove some of the distortion that occurs as the mount does not remove all of the in-flight
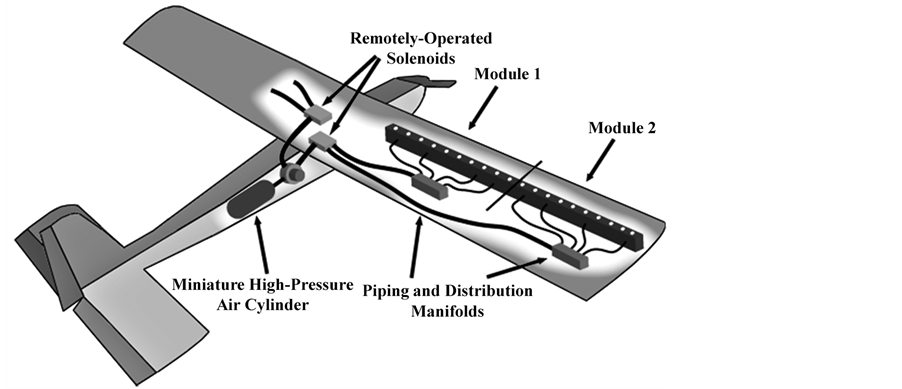
Figure 1. Schematic of the model aircraft used in the flight tests. Details of half of the air supply system used to operate the microjet actuators are shown in the right wing.
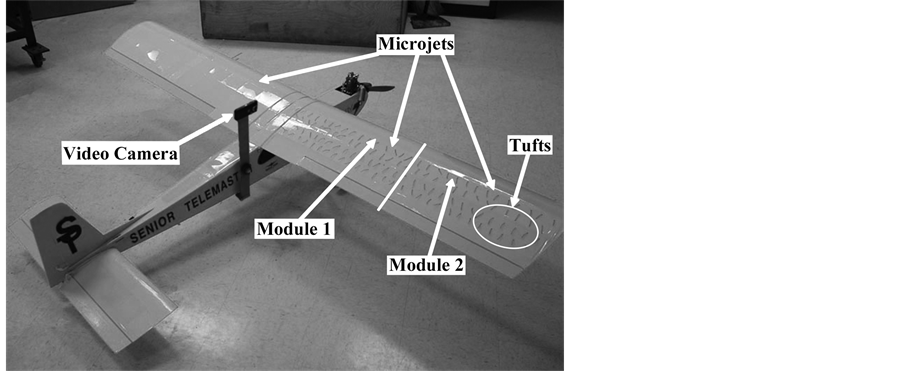
Figure 2. Photograph of the retrofitted model aircraft. The onboard video camera and the tufts it monitors can be seen. Microjet actuators are implemented inside both wings.
vibrations, especially those during stall maneuvers. An extension arm is used to elevate the camera to an advantageous location above the wing, enabling a clearer view of the tufts on the right wing. Rapid and unsteady fluctuations of the tufts denote that the boundary layer is separated and the wing is near stall or stalled. Conversely, when the tufts are aligned with the freestream flow and are relatively stable, flow is attached and the wing is capable of producing lift.
To most clearly see the effect of microjet control, the integrated system is separated into two modules, which can be controlled independently. Each module covers half of each wings’ span, such that control may be applied over wing tips and wing roots separately. Module 1 is the set of microjet arrays from each wing’s root to midspan, while Module 2 is from mid-span to wing tip (control is symmetric about the fuselage). These features have been indicated in Figure 1 and Figure 2. The camera is positioned such that it records the motion of the tufts over one of the aircraft’s wings during the entire flight. Additionally, the camera records the control state through small light emitting diodes (LEDs) that are triggered by the solenoid valve controllers. When the aircraft is in a stalled condition and only one of these modules is activated, the camera should capture the uncontrolled flow and the flow with microjet control simultaneously. As described in §3.1, observing a difference between the flow patterns over these two portions of the wing will visually demonstrate the efficacy of the microjets for controlling flow separation.
Since the modified aircraft is not implemented with an autopilot or first-person view system, all maneuvers are conducted with the conventional view from the ground only. A professional RC aircraft pilot controlled the airplane for the entire duration of each flight, where each is separated into a number of different maneuvers that are designed to test various aspects of the microjet control system. The high-pressure cylinder is filled with nitrogen prior to each flight. The spotter controls the microjet actuators from a separate control box during the flight. Typical maneuvers consist of stalling the airplane in one of several different manners, activating one of the microjet modules intermittently, and then recovering to normal flight. For the results shown here, the airplane is stalled by first reducing its airspeed and subsequently rapidly pitching up the aircraft. Since the operator observes the aircraft from the ground only, the actuators must be activated intermittently, and the maneuvers must be repeated a number of times to attempt to have flow conditions mimicking the wind tunnel tests. Obtaining repeatable data for the flight tests is extremely difficult without sophisticated hardware in the aircraft since the flow is highly three-dimensional and influenced by propeller downwash, weather, and other parameters that are not well-controlled. Therefore, multiple flight tests were conducted to increase the number of maneuvers that were performed under the desired flow conditions.
3. Experimental Results
3.1. Wind Tunnel Tests
To test and implement microjet control over a wing, it is necessary to identify the optimal location(s) for the microjet arrays. Results from previous research [15] [16] indicate that microjet injection should occur slightly upstream of the separation location. As such, surface flow visualizations using the oil-based paint mixture were obtained on the aircraft’s wing in wind tunnel tests to identify the separation location as well as the optimal actuator flow conditions. A sample result for the primary test case where U∞ = 20 m/s (ReC ≈ 450,000) and α = 16˚ is presented in Figure 3. In this photograph, the leading edge of the airfoil is at the top of the image (flow from top to bottom). The photograph was taken after the paint has dried, showing clear streaklines. The photograph is taken from above the airfoil model and shows the paint streaks on the suction surface. The separated region is identified in the center region of the wing, beginning at approximately 30% of the chord length. For clarity, superimposed black arrows indicate the local flow direction, and white arrows indicate the reverse flow region. The region outlined by a white dashed line is lacking paint streaks due to very low velocities (and wall shear) that are typical of such separation regions. Based on these results, the proper location of the microjet array was
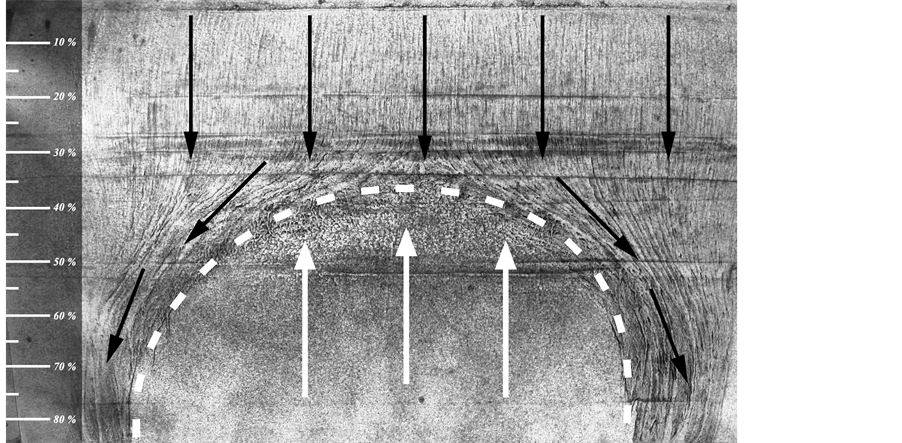
Figure 3. Surface oil-flow visualization over a section of the aircraft’s wing, U∞ = 20 m/s; α = 16˚; no control. The leading edge is at the top of the image, streaklines are superimposed, and a white dashed line indicates the separated region.
determined to be at approximately 25% of the chord length, just upstream of the separation location.
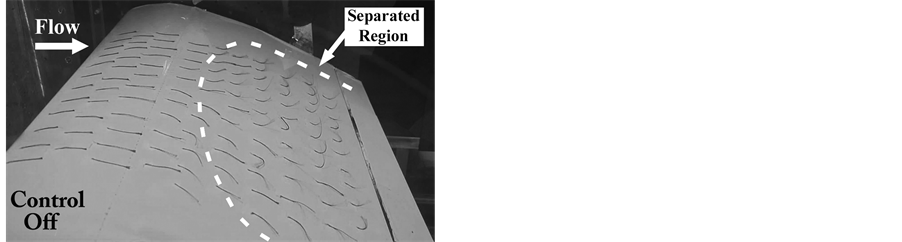
After integrating the microjet actuators into the wing, tufts were installed on the suction surface of the wing to visualize the effect of control on the separated region. Tufts were also used because these visualizations can easily be performed during flight. The central portion of the wing was covered with tufts for the wind tunnel tests. Unsteady, erratic motion of the tufts indicates regions of reverse flow, while a uniform, quasi-stationary pattern in the tufts indicates attached flow. Photographs illustrating these two conditions are shown in Figure 4. Here, the flow direction is from left to right and the flow conditions are U∞ = 20 m/s (ReC ≈ 450,000) and α = 16˚. The location of the microjet array is indicated in Figure 4(b). Without microjet control (Figure 4(a)), the separated region in the rear half of the wing is clearly evident because of the indications of reversed/unsteady flow. The reverse flow region begins just behind the separation location, which is indicated by the first section where the tufts are misaligned from the incoming flow direction. A white dashed line overlaying the image indicates the size and shape of the separated flow region. With the application of microjet control at a steady momentum coefficient of Cµ = 0.017, the microjet arrays reattach the flow and eliminate the majority of the reverse flow, as seen in Figure 4(b). In this image, one can see that the tufts no longer diverge around a large separation zone as in the uncontrolled case. These flow visualizations provide valuable information that will be used in the analysis of the video recorded during the flight tests. However, to further quantify the effect that microjet-based flow control has on the flow around this airfoil, particle image velocimetry was used to obtain velocity field measurements.
Quantitative flowfield measurements were performed using two-component particle image velocimetry as described earlier. These measurements were acquired on a centered, chordwise plane spanning from approximately 25% - 75% of the chord; based on the preceding surface flow visualizations, this should adequately cover the separated flow regime. The ensemble-averaged velocity fields obtained from these experiments are shown in the plots in Figure 5, with the airfoil’s suction surface located on the bottom of the plot, seen as a thick black line; the flow direction is from left to right; and the microjets issue from the bottom, perpendicular to the airfoil surface. Insets in the figures indicate the coordinate system, flow direction, the PIV region, angle of attack, and microjet injection location. The y-axis is the vertical distance from the leading edge. The x-axis represents the streamwise distance from the leading edge of the airfoil. Both of these distances are non-dimensionalized by the airfoil chord.
These plots show the ensemble-averaged streamwise velocity distributions for the primary test case: U∞ = 20 m/s, α = 16˚, with and without control. These contours show the behavior of the flow above the aft section of the airfoil. The uncontrolled case in Figure 5(a) clearly shows that the flow over the airfoil is separated and that the airfoil is stalled with reverse flow. Flow separates from the surface of the airfoil around , corresponding to the results of the surface flow visualizations. After this point, the separated region is indicated by reversed flow as shown by the dark blue contours. For clarity, velocity profiles have been overlaid in this region at two locations. In the uncontrolled case in Figure 5(a), one can clearly see reversed flow at both positions. In contrast, Figure 5(b) shows that the activation of the microjets at Cµ = 0.017 eliminates the reversed flow region. The influence of the microjets can be seen most clearly behind the injection location, which is indicated by the arrow and text overlaid in Figure 5(b). The flow divergence and deceleration due to the adverse pressure gradient has been pushed back to
 . At this location, the light blue contour levels indicate low velocities;
 (a)
(a)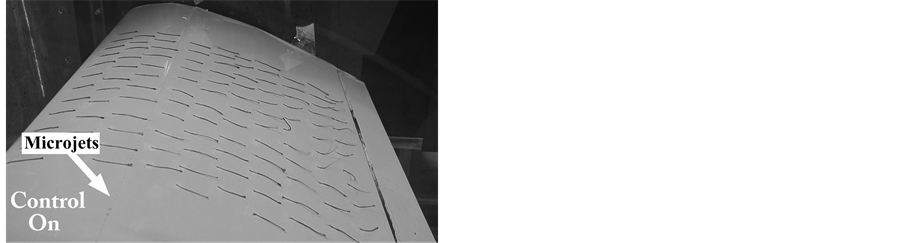 (b)
(b)
Figure 4. Flow visualization using tufts, U∞ = 20 m/s; α = 16˚. (a) No control, separated flow clearly seen over a majority of the wing; (b) Microjets activated, completely reattached flow, Cµ = 0.017.
 (a)
(a)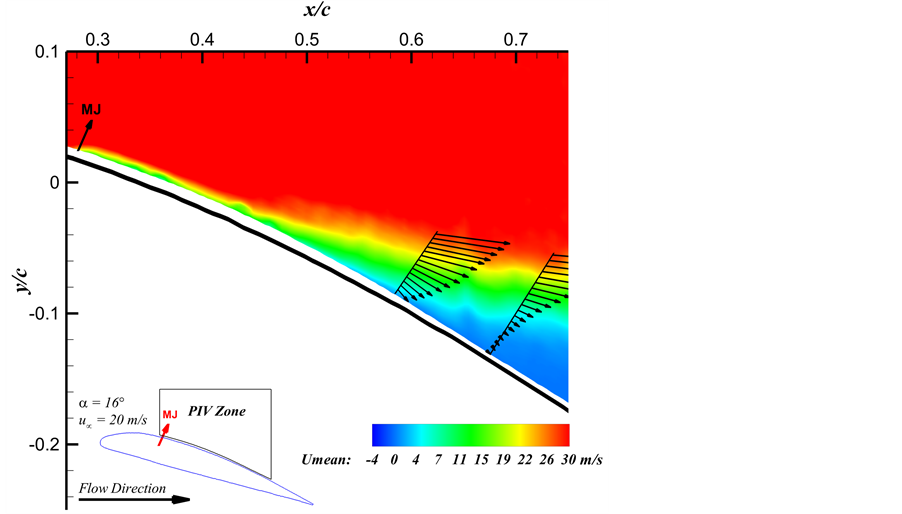 (b)
(b)
Figure 5. Ensemble-averaged streamwise velocity, Umean, at center plane, U∞ = 20 m/s; α = 16˚. (a) No control, separated flow; (b) Microjets activated, Cµ = 0.017, reattached flow. Microjet injection location indicated in (b).
however, there is no flow reversal. This is further illustrated by the velocity profiles shown at the same locations as the uncontrolled case—with control, there is no reverse flow at these locations. Beyond this region, the flow may separate from the airfoil, but this would occur only in the vicinity of the trailing edge and cannot be clearly identified for the present case. The effect of microjet control can be seen as far downstream as , or about 400 microjet diameters from the injection location.
3.2. Flight Tests
Having demonstrated the effectiveness of microjet control in wind tunnel tests for the airfoil used on the RC aircraft, these actuators were integrated in the aircraft’s wings. The modified RC airplane was flown to test microjet control efficacy during more realistic and challenging flight conditions, where one has to deal with effects such as wind gusts, airframe vibration, highly three-dimensional flow, and propeller downwash, among others. The data presented here are images extracted from the video collected from the onboard camera as it captures the motion of the tufts throughout each maneuver. These images have been post-processed to remove some of the camera vibration that is present even with the floating-bolt assemblies used in the camera mount. Results from two maneuvers are shown here: 1) the airplane is stalled without microjet control; and 2) the airplane is stalled with control applied over the wing tips. The images shown here were selected because they best illustrate the flow properties for the associated flight test condition. In these images, the right wing of the aircraft is viewed from the camera mount that is attached to the fuselage behind the wing-fuselage junction (see Figure 2).
3.2.1. Stall without Microjet Control
For this flight test, stalling the airplane was accomplished by reducing its airspeed and subsequently pitching up the aircraft rapidly. This causes the flow over the wings of the aircraft to separate as seen in the movement of the tufts. Figure 6 shows a frame extracted from the onboard video camera during this maneuver. Here, all microjet actuators are inactive; hence, neither of the LEDs on the outer portion of the wing (top-center of the image) is visible. The orientation of tufts in the mid-span region indicates that the flow over the airfoil is clearly separated from the wing root to approximately 75% - 85% of the wing’s span. The extent of the separated region is outlined by a white dashed line, and the interface location between the two microjet modules is indicated by a solid white line. When comparing the tuft patterns from this maneuver to the maneuver with control, discussed next, it is important to recall that the separated region encompasses portions behind both microjet modules for this maneuver. Next, the effect of activating only one of the two microjet modules is examined during a similar maneuver.
3.2.2. Stall with Microjet Control from Mid-Span to Wing Tips
To illustrate the effect of microjet control during a stall, the airplane was forced into a stall while one of the two microjet modules was activated (Module 2: from mid-span to wing tips). The wing tip microjet modules were chosen since a significant portion of the aileron is located behind them and because this entire region is in the video camera’s field of view. During this maneuver, the wing tip microjet module was activated while the aircraft was in level flight. Stall was subsequently induced by reducing the airspeed and then rapidly pitching up the aircraft, as before. A short time after the airplane is pitched up, microjet control is deactivated in order to subject the entire wing to the uncontrolled flow.
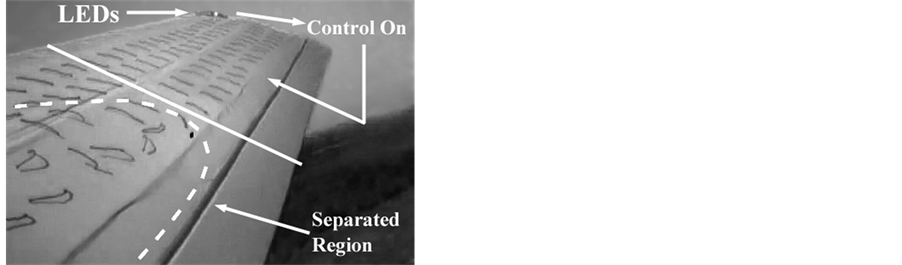
The images in Figure 7 are representative of the flow conditions during the various stages of this maneuver. The bright LED at the outer edge of the wing (top-center of the image) indicates that only the wing tip microjet actuators are activated. The span of the wing tip microjet modules is from the solid white line to the wing tip; hence, the flow over this portion of the wing is subjected to microjet control. In the first frame, Figure 7(a), one can see that the flow is separated over the wing root to mid-span section of the wing—where control is not applied. The flow over the remainder of the wing is clearly attached, due to the application of microjet control in this area. Shortly thereafter, microjet control is deactivated to determine the flow behavior after control has ceased. The flow response under these conditions is shown in Figure 7(b), where the separated region has extended towards the wing tip, well past the interface location between the two microjet modules. Comparing these two frames reveals that the extent of separation has indeed grown due to the deactivation of the wing tip microjet modules.
4. Conclusion
A series of wind tunnel experiments has shown that microjet-based actuation is very effective at reducing or eliminating separation over the airfoil of a remote-controlled aircraft. Microjet injection enhances mixing above the airfoil’s surface, entraining higher momentum fluid into the boundary layer [14] [15] . This increase in
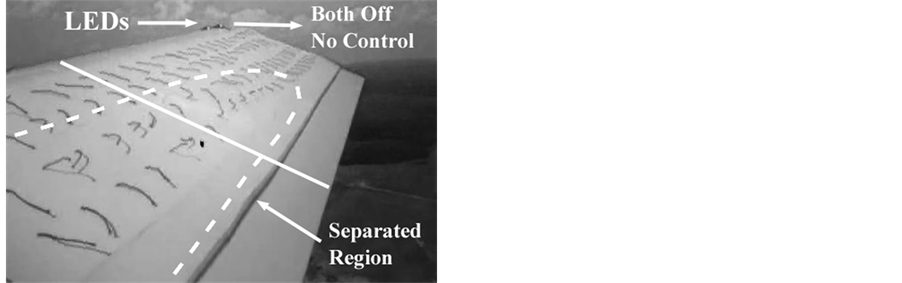
Figure 6. Frame extracted from the onboard video camera during a stall maneuver without control. Flow is separated over 80% of the wing.
 (a)
(a)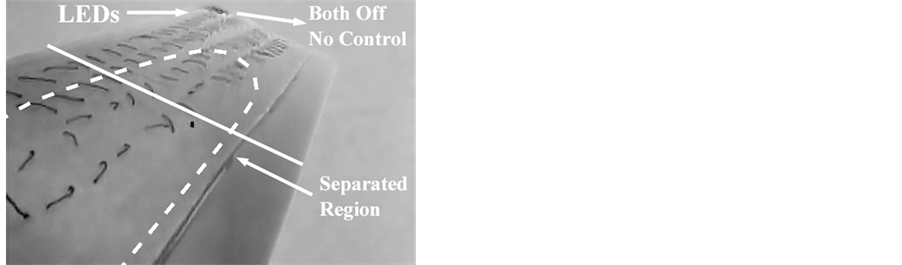 (b)
(b)
Figure 7. Frames extracted from the onboard video camera during a stall maneuver with control. (a) Control applied over the wing tips, separated flow over the wing roots; (b) Control deactivated a short time later, separation extends toward the wing tips.
momentum in the boundary layer delays flow separation until more adverse conditions are present at higher angles of attack. In the wind tunnel studies, qualitative experiments including tuft and surface oil flow visualizations indicate that microjet control is capable of reducing or eliminating separation at moderate angles of attack. Additionally, quantitative velocity field measurements clearly illustrate that microjet actuation delays separation to higher angles of attack. Subsequently, a remote-controlled aircraft was retrofitted with microjets and the requisite hardware to study microjet efficacy during realistic and unpredictable flight conditions. A miniature video camera mounted at the base of the wings on the fuselage of the aircraft recorded the movement of tufts that were placed on the right wing of the aircraft. The aircraft was put through a series of maneuvers to examine the relative effect of microjet control. Obtaining reliable data was challenging, however in one such maneuver, while in a stalled condition, the microjets were activated on one-half of each wing such that the tufts would be subjected to both uncontrolled and controlled flow simultaneously. The onboard videos from the flights show results similar to the wind tunnel tests in that the microjet actuators are capable of delaying flow separation to higher angles of attack. These results are noteworthy for a couple of reasons: 1) they demonstrate the efficacy of microjet control in a complex and realistic flow, and 2) they show the robustness and relative simplicity of this approach, which was implemented using off-the-shelf hardware.
Acknowledgements
This work was supported by the Florida Center for Advanced Aero-Propulsion (FCAAP). The authors would also like to thank Robert Avant, the master machinist at the Advanced Aero Propulsion Lab (AAPL) at Florida State University (FSU). We also appreciate the help of Erik Fernandez and Christopher Freeborn-Scott, fellow graduate students in our laboratory for their assistance with the flight tests. We are grateful for the facilities at the Seminole RC Club Airfield in Tallahassee, FL where the flight tests were conducted. Finally, a special thanks is given to Tristan Seeley, an expert remote-controlled aircraft operator, for flying the modified airplane.
References
- Lin, J.C. (2002) Review of Research on Low-Profile Vortex Generators to Control Boundary-Layer Separation. Progress in Aerospace Sciences, 38, 389-420. http://dx.doi.org/10.1016/S0376-0421(02)00010-6
- Sinha, S.K. (2001) Flow Separation Control with Microflexural Wall Vibrations. Journal of Aircraft, 38, 496-503. http://dx.doi.org/10.2514/2.2789
- Hsiao, F.-B., Shyu, J.-Y. and Liu, C.-F. (1990) Control of Wall-Separated Flow by Internal Acoustic Excitation. AIAA Journal, 28, 1440-1446. http://dx.doi.org/10.2514/3.25236
- Fujisawa, N. and Takeda, G. (2003) Flow Control around a Circular Cylinder by Internal Acoustic Excitation. Journal of Fluids and Structures, 17, 903-913. http://dx.doi.org/10.1016/S0889-9746(03)00043-4
- Lorber, P.F., McCormick, D.C., Anderson, T.J., Wake, B.E., MacMartin, D.G., Pollack, M.J., Corke, T.C. and Breuer, K. (2000) Rotorcraft Retreating Blade Stall Control. Fluids 2000 Conference and Exhibit, Denver, 19-22 June 2000, AIAA 2000-2475. http://dx.doi.org/10.2514/6.2000-2475
- Pinier, J.T., Ausseur, J.M., Glauser, M.N. and Higuchi, H. (2007) Proportional Closed-Loop Feedback Control of Flow Separation. AIAA Journal, 45, 181-190. http://dx.doi.org/10.2514/1.23465
- Ciuryla, M., Liu, Y., Farnsworth, J., Kwan, C. and Amitay, M. (2007) Flight Control Using Synthetic Jets on a Cessna 182 Model. Journal of Aircraft, 44, 642-653. http://dx.doi.org/10.2514/1.24961
- Seifert, A., Darabi, A. and Wygnanski, I. (1996) Delay of Airfoil Stall by Periodic Excitation. Journal of Aircraft, 33, 691-698. http://dx.doi.org/10.2514/3.47003
- Allan, B.G., Juang, J.-N., Raney, D.L., Seifert, A., Pack, L.G. and Brown, D.E. (2000) Closed-Loop Separation Control using Oscillatory Flow Excitation. NASA/CR-2000-210324, National Aeronautics and Space Administration, Pasadena.
- Beahn, J. (2003) Compressible Dynamic Stall Control Using Microjets. M.S. Dissertation, Florida State University, Tallahassee.
- Bourgois, S., Alvi, F.S., Tensi, J. and Bonnet, J.-P. (2004) Control of Flow Separation Using Microjets. Proceedings of the First European Forum on Flow Control, Poitiers, 11-14 October 2004.
- Fernandez, E., Kumar, R. and Alvi, F. (2013) Separation Control on a Low-Pressure Turbine Blade Using Microjets. Journal of Propulsion and Power, 29, 867-881. http://dx.doi.org/10.2514/1.B34413
- Kreth, P., Alvi, F.S., Kumar, V. and Kumar, R. (2010) Microjet Based Active Flow Control on a Fixed Wing UAV. Proceedings of the 48th AIAA Aerospace Sciences Meeting Including the New Horizons Forum and Aerospace Exposition, Orlando, 4-7 January 2010, AIAA 2010-1260. http://dx.doi.org/10.2514/6.2010-1260
- Kumar, V. and Alvi, F.S. (2006) Use of High-Speed Microjets for Active Separation Control in Diffusers. AIAA Journal, 44, 273-281. http://dx.doi.org/10.2514/1.8552
- Kumar, V. (2008) Separation Control in Adverse Pressure Gradients using High-Speed Microjets,. Ph.D. Thesis, Florida State University, Tallahassee.
- Kumar, V. and Alvi, F.S. (2009) Toward Understanding and Optimizing Separation Control using Microjets. AIAA Journal, 47, 2544-2557. http://dx.doi.org/10.2514/1.38868
- Muppidi, S. and Mahesh, K. (2007) Direct Numerical Simulation of Round Turbulent Jets in Crossflow. Journal of Fluid Mechanics, 574, 59-84. http://dx.doi.org/10.1017/S0022112006004034
NOTES

*This is a short paper.