Food and Nutrition Sciences
Vol.5 No.10(2014), Article ID:45556,10 pages DOI:10.4236/fns.2014.510096
Aqueous Components of Tomato Accelerate Alcohol Metabolism by Increasing Pyruvate Level
Yusuke Ushida1, Shunji Oshima2, Koichi Aizawa1, Hiroyuki Suganuma1, Akihiro Nemoto2, Hiroko Ishikiriyama2, Yasushi Kitagawa2
1Research & Development Division, Kagome Co. Ltd., Tochigi, Japan
2Research Laboratories for Fundamental Technology of Food, Asahi Group Holdings, Ltd., Ibaraki, Japan
Email: Yusuke_Ushida@kagome.co.jp
Copyright © 2014 by authors and Scientific Research Publishing Inc.
This work is licensed under the Creative Commons Attribution International License (CC BY).
http://creativecommons.org/licenses/by/4.0/


Received 25 February 2014; revised 25 March 2014; accepted 1 April 2014
ABSTRACT
Consumption of food while drinking alcohol has been suggested to play important roles in alleviating the physiological and pharmacological influences of alcohol. Vegetables are believed to provide health benefits, but there is little evidence for their influence on the effects of alcohol consumption. The present study aimed to investigate the effect of a common vegetable, tomato, on alcohol metabolism. In a randomized, controlled, crossover study with12 Japanese healthy men aged between 24 and 56 years, drinking tomato juice containing 5% (v/v) alcohol (TJAlc) significantly attenuated the elevation of blood ethanol level and subsequently increased the level of acetate compared with a water-based alcoholic beverage with an equal dose of alcohol (0.4 g/kg body weight). Significantly higher levels of blood pyruvate and lactate were also observed in subjects who had consumed TJAlc compared with those consuming the water-based beverage. Additionally, a biphasic alcohol effects scale method showed that subjective feelings for alcohol-induced stimulant effects were significantly enhanced by drinking TJAlc. Animal experiments using male Sprague Dawleyrats suggested that the effect on blood biomarkers was attributable to the serum fraction of tomato (TS), which largely consisted of aqueous compounds, but not lipophilic compounds such as the carotenoid lycopene. Furthermore, it was suggested the TS possibly included potent compound(s) in addition to alanine, glutamine, and citric acid, all of which have previously been reported to affect alcohol metabolism. Administration of TS clearly increased the activity of NAD (H)-dependent enzymes such as lactate-(LDH), alcohol-, and aldehyde-dehydrogenase in rat liver cytosols. These findings suggest that aqueous compound(s) in tomato promote alcohol metabolism, probably through increasing pyruvate level, enhancing LDH activity, and improving the ratio of NAD to NADH.
Keywords:Tomato, Blood Ethanol Level, Pyruvate, Lactate Dehydrogenase, Alcohol Metabolism

1. Introduction
Moderate consumption of ethanol is widely believed to have beneficial effects for human health, whereas high consumption causes many serious medical problems [1] [2] . In addition to its physiological effects, ethanol can influence psychological factors such as mental health and social behaviors. It is therefore important to regulate the levels of ethanol itself, and of its metabolites, to reduce the risks and achieve the benefits brought by ethanol. To date, a large body of fundamental and clinical knowledge on the regulation of alcohol metabolism has been accumulated [3] . However, it is still difficult to regulate alcohol metabolism, because it is governed by a broad array of environmental factors including genetic and physiological differences in individuals [4] [5] , and drinking conditions such as the type of alcoholic beverage, the amount of alcohol consumed, and foods taken with alcohol [6] .
As reported in 1925 [7] , food intake while drinking alcohol has been suggested to alleviate the increase of blood ethanol, a phenomenon that is possibly mediated by distinct mechanisms such as promotion of first-pass metabolism (FPM) in digestive organs and up-regulation of alcohol metabolism in the liver. For the former, a human study recently demonstrated that FPM was up-regulated by taking foods with alcohol [8] . For the latter, various food materials and their components have been reported to regulate the hepatic enzymes responsible for alcohol metabolism [9] -[11] . Despite of a lack of scientific evidence on the beneficial effects of food consumption with alcohol, certain foods have traditionally been consumed while drinking alcohol, a practice that can be observed in many cultures throughout the world.
Tomato (Solanum lycopersicum), one of the most commonly consumed vegetables in the world, is cooked or processed in many different ways. Particularly in Western countries, tomato has long been used for alcoholic beverages such as the beer-based “Red Eye” and the vodka-based “Bloody Mary”. Tomato is believed to contribute to human health because of its various nutrients and phytochemicals such as vitamins, minerals, fibers, and the carotenoid lycopene [12] -[15] , but the reason why tomato has been preferably consumed while drinking alcohol remains unclear. The aim of our study was to investigate the effect of tomato on alcohol metabolism in vivo in humans, and to clarify the active compounds in tomato and their potential mechanisms of action using experimental animal models.
2. Materials and Methods
2.1. Materials
Tomato paste with Brix 20 (Kagome USA, Inc., CA) was used in the present study. For the human study, the tomato paste was diluted with distilled water and mixed with clear liquor containing 25% (v/v) alcohol (AsahiGroup Holdings, Ltd., Tokyo, Japan) to produce the test beverage, tomato juice containing 5% (v/v) alcohol (TJAlc). The final Degrees Brix 5.5 was much the same as common tomato juice commercially available in Japan. The counterpart control beverage containing 5% (v/v) alcohol was prepared by replacing the diluted tomato paste with distilled water. The nutrient compositions of these beverages are shown in Table 1. For the animal experiments, the tomato paste was centrifuged at 12,000 × g for 15 min, and the resulting supernatant was concentrated with a rotary evaporator to yield a tomato serum (TS) that consisted primarily of the aqueous components (Table 2).
2.2. Human Study
This study was approved by the Asahi Group Holdings, Ltd. Ethics Committee and the Ethics Committee of Kagome Co. Ltd., and was carried out in accordance with the International Ethical Guidelines and Declaration of Helsinki. Written informed consent was obtained from each subject. Twelve apparently healthy male Japanese subjects, aged 24 - 56 years, non-smokers, not currently taking medication, who currently consumed alcohol at least once a week, were recruited for this study.

Table 1. Nutritional composition of experimental beverages for the human study.
All values are per 100 g of beverage. Control: 5% alcohol, TJAlc: tomato juice containing 5% alcohol. †: Corresponding to 5 mL alcohol per 100 mL (i.e. 5% (v/v) alcohol) of each beverage. -: not measured.
Table 2. Components of aqueous fraction of tomato (TS).
n.d.: not detected.
A randomized, controlled, crossover study was conducted on the control alcohol beverage and the test beverage, TJAlc. Subjects who had refrained from drinking alcohol for 1 day were given either of the above beverages at a dose of 0.4 g alcohol per kg body weight on an empty stomach. Just before (0), and 30, 60, 120, and 180 min after drinking the beverage, blood samples (approximately 1.5 mL) were collected from the arm for determination of blood ethanol, acetate, pyruvate, and lactate levels. Additionally, alcohol-induced stimulant and sedative effects were investigated based on a Biphasic Alcohol Effects Scale (BAES) method that was established by Martine et al. [16] , and has been used in many studies with various human populations, including Caucasians and Asians [17] [18] . Briefly, 0, 30, 45, 60, 90, 120, and 180 min after drinking the alcoholic beverage, subjects scored their feelings between 0 and 10 for a total of 14 items representing alcohol-induced effects, including seven stimulant (elated, energized, excited, stimulant, talkative, up, and vigorous) and seven sedative (difficulty concentrating, down, heavy head, inactive, sedated, slow thoughts, and sluggish) effects. Following a period of at least 1 week of washout, which was set according to the previous study [19] , subjects were tested on the counterpart beverage in a similar manner.
2.3. Animal Experiments
All animal experiments were approved by the Animal Care and Use Committee of Kagome Co., Ltd. in accordance with the guidelines established by the Japanese Society of Nutrition and Food Science (Law and Notification 6 of the Japanese Government). Male Sprague Dawley (SD) rats were acclimatized on a laboratory diet (MF diet; Oriental Yeast Co., Ltd., Tokyo, Japan) in individual stainless steel cages for at least 1 week prior to the experiments.
For the first experiment, nine SD rats were randomly divided into three groups and then subjected to a Latinsquare-based three-treatments, three-periods (3 × 3) crossover experiment to evaluate the effects of water (control), TS, or a mixed solution of TS components (alanine, glutamine, and citric acid (AGC), which have been reported to promote alcohol metabolism [20] [21] ) on blood ethanol, acetate, pyruvate, and lactate levels. At each period, rats were gavaged with water, TS, or AGC at a dose of 10 mL/kg-body weight. The AGC contained concentrations of alanine, glutamine, and citric acid equal to those found in TS (Table 2). Fifteen minutes after the gavage, rats were orally challenged with a 20% (v/v) aqueous ethanol solution at a dose of 2.0 g/kg body weight. Before and 60, 120, 180, and 240 min after the ethanol challenge, blood was collected by nicking the tail vein, and was used for determinations of the biomarkers mentioned above. An interval of at least 1 week was set between the different test periods.
For the second experiment, the effect of TS on the activity of hepatic enzymes responsible for alcohol metabolism was investigated. SD rats were divided into two groups: control (n = 4) and TS (n = 5), then gavaged with either water or TS, respectively (10 mL/kg body weight). Both groups of rats were orally injected with 20% (v/v) aqueous ethanol solution at a dose of 2.0 g/kg body weight 15 min after the gavage. One hour later, rats were euthanized and their livers were harvested, frozen in liquid N2, and stored at −80˚C until analyzed.
2.4. Analyses of Biomarkers in Blood
Blood ethanol levels were determined according to a previous report [22] . Briefly, collected blood (50 µL) was immediately treated with 2.5 mL of ice-cold 4% (w/v) perchloric acid (PCA) in a capped tube. After centrifugation at 3000 × g for 15 min at 4˚C, 2.0 mL of supernatant was transferred to a glass vial containing 0.50 g of solid NaCl. The PCA-treated samples were applied to a headspace gas chromatograph equipped with a flame ionization detector (6890N GC System; Agilent Technologies, CA). Separation of ethanol was performed using a DB-WAX column (60 m × 0.25 mm, Agilent J & W GC Columns) under the following conditions: flow rate, 20 mL/min; temperature, 240˚C.
For analysis of blood acetate, pyruvate, and lactate levels, 100 µL of blood was mixed with 200 µL of icecold 4% PCA and centrifuged (3000 × g for 15 min at 4˚C). The supernatant (200 µL) was subjected to simultaneous analysis of organic acids using high-performance liquid chromatography (Prominence, Shimadzu, Kyoto, Japan) on the basis of a post-column pH buffered electric conductivity detection method [23] . Briefly, the organic acids were separated on two tandemly arranged columns (Shim-pack SPR-H, 250 × 7.8 mm, Shimadzu) in an isocratic mobile phase of 5 mM p-toluenesulfonic acid solution and detected by an electric conductivity detector (CDD-6A, Shimadzu) in post-column pH buffering solution of 5 mM p-toluenesulfonic acid solution containing 20 mM bis-tris and 0.1 mM EDTA. Both the mobile phase and the pH buffering solution were set at a flow rate of 0.8 mL/min.
2.5. Measurements of Hepatic Enzyme Activity
Subcellular fractionation of rat livers was done according to the method of Kishimoto et al. [24] . In brief, 0.5 g of liver was homogenized in 2 mL of 10 mMtris-HCl (pH 7.4) containing 0.25 M sucrose and 1 mM 2-mercaptoethnaol on ice. After removing the nucleus and debris by centrifugation at 750 × g for 10 min at 4˚C, the supernatant was further centrifuged at 10,000 × g for 15 min at 4˚C to obtain the mitochondrial pellet. The remaining supernatant was centrifuged at 100,000 × g for 60 min at 4˚C to separate the sedimentedmicrosome from the cytosolic fraction. All fractions were stored at −80˚C until analyzed.
Enzyme activity of alcohol dehydrogenase (ADH) was measured in 96-well clear plates. The cytosolic fraction was applied to each well containing 0.1 mM glycine-NaOH buffer (pH 10.6) and then incubated at 25˚C for 5 min. The enzyme reaction was started by addition of 10 µL of 2.0% (v/v) ethanol to the well, bringing the total volume to 200 µL. The initial velocity of NADH generation was measured at 340 nm for 10 min at 25˚C. Blank reaction rates without ethanol were also determined. ADH velocity was normalized to the protein concentration and expressed as nanomole of NADH per minute per milligram of protein based on the molar absorbance coefficient of NADH, 6.22 × 10³ l∙mol−1∙cm−1.
For measurement of enzyme activity of aldehyde dehydrogenase (ALDH), each fraction was added to an assay mixture containing 50 mM sodium pyrophosphate buffer (pH 8.0), 1 mM NAD, and 0.1 mM pyrazole in the well of the 96-wellplate. Following addition of 10 µL of 80 mM propionaldehyde, generation of NADH was monitored at 340 nm for 10 min at 25˚C. ALDH activity (nanomole of NADH per minute per milligram) was calculated in the same manner as the ADH assay mentioned above. In addition, microsomal and mitochondrial fractions were suspended in 0.25 M sucrose and then solubilized by treatment with 1% (w/v) sodium deoxycholate before being used for the ALDH assay.
Enzyme activity of lactate dehydrogenase (LDH) was measured in the cytosolic fraction in a 10-mm quartz cuvette. The fraction was mixed with 100 µM phosphate buffer (pH 7.4) containing 2 mM NADH in the cuvette. The reaction was started by the addition of 100 µL of sodium pyruvate, bringing the volume to 2.4 mL. The decreasing velocity of NADH was measured at 340 nm for 10 min at 25˚C. LDH activity (nanomole of NADH per minute per milligram) was expressed as previously mentioned.
2.6. Statistics
Subjective feelings on the effects of alcohol were scored based on the BAES method. The scores are shown as boxplots consisting of the minimum, 25th percentile, median, 75th percentile, and the maximum observations. Differences between groups were determined by the Wilcoxon single rank test. Other values are shown as mean ± standard deviation. Differences between groups were determined using the Student’s t-test or the Tukey Kramer’s post hoc test after a one-way analysis of variance. Results were considered statistically significant at p < 0.05.
3. Results
3.1. Blood Biomarkers Representing Alcohol Metabolism in Humans
After drinking the control beverage at an alcohol dose of 0.4 g/kg body, blood ethanol level reached a maximum level of 0.42 ± 0.08 mg/mL at 60 min, and thereafter it fell, reaching half the maximum level at 180 min. In contrast, the elevation of the blood ethanol level was attenuated, and it subsequently remained at a significantly lower level through 180 min of the test period, in the subjects who consumed the TJAlc (Figure 1(A)). The calculation of elimination time of blood ethanol by extrapolating the descending part of the blood ethanol curve revealed that the TJAlc shortened the elimination time by approximately 1 h compared with that after drinking the control beverage (Figure 1(B)). Associated with the lower blood ethanol level, the increase in blood acetate level was significantly enhanced in subjects who had consumed the TJAlc (Figure 2(A)). Blood pyruvate level was decreased by consuming alcohol; this effect was partially but significantly suppressed at 60 and 180 min after drinking TJAlc (Figure 2(B)). Conversely, a rising trend of the blood lactate level was observed after consumption of alcohol, as is well known. This effect was significantly enhanced over 60 min after drinking TJAlc (Figure 2(C)).
3.2. Alcohol-Induced Stimulant and Sedative Effects
Subjective feelings on alcohol-induced stimulant and sedative effects were investigated after drinking the control alcoholic beverage or TJAlc. Changes in total scores for seven stimulant items and seven sedative items are shown in Figure 3. The Wilcoxon’s single rank test determined that the total score for stimulant effects was significantly enhanced at 45 min and 90 min after drinking TJAlc compared with the control beverage. Three items in particular contributed to the higher total score: “up” (median: control, 2.6; TJAlc, 5.5; p < 0.05, at 45 min), “vigorous” (median: control, 1.8; TJAlc, 4.7; p < 0.05, at 45 min), and “energized” (median: control, 2.2; TJAlc, 2.9; p < 0.05, at 90 min). In contrast, there were no significant differences in either total score or individual scores for sedative effects of alcohol between the two groups.
3.3. Tomato-Derived Compounds Contributing to the Acceleration of Alcohol Metabolism
Results of a preliminary study showed that the effect of tomato juice on alcohol metabolism was primary attributable to TS, containing mainly aqueous components of tomato, but not to lipophilic compounds such as the
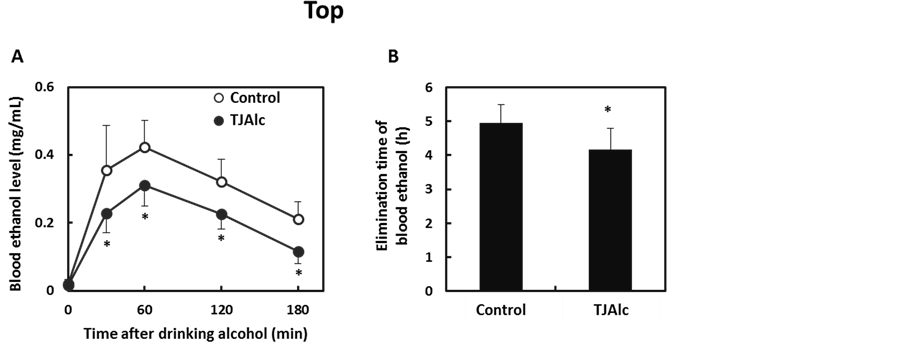
Figure 1. Changes in blood ethanol levels (A) and elimination time of blood ethanol (B) in men after drinking a water—(control; n = 12) or tomato juice—(TJAlc; n = 12) based alcoholic beverage. Data are shown as mean ± SD. *: p < 0.05 vs. control (Paired t-test).
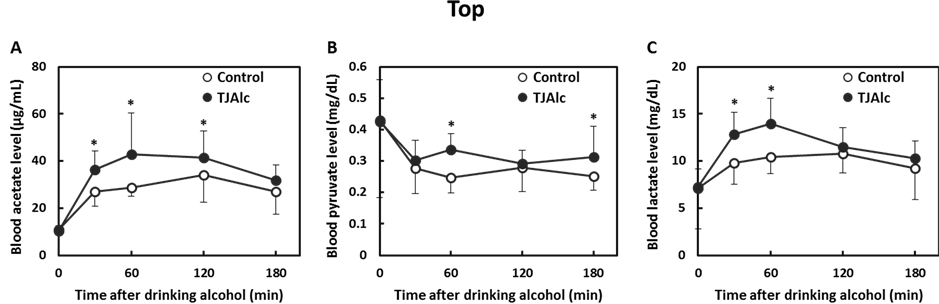
Figure 2. Changes in blood acetate (A), pyruvate (B), and lactate (C) levels in men after drinking a water—(control; n = 12) or tomato juice—(TJAlc; n = 12) based alcoholic beverage. Data are shown as mean ± SD (n = 12). *: p < 0.05 vs. control (Paired t-test).
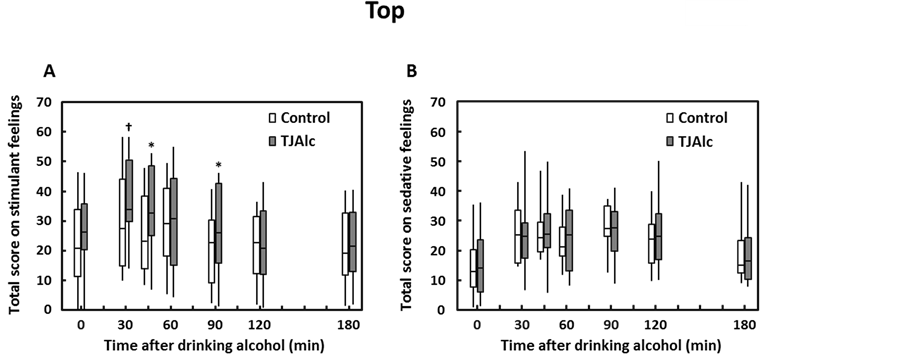
Figure 3. Changes in total scores of alcohol-induced stimulant (A) and sedative (B) effects in men after drinking a water—(control) or tomato juice—(TJAlc) based alcohol beverage. Data are shown as a boxplot for each group (n = 12). The boxplot represents the minimum (bottom of the bar), 25th percentile (bottom of the box), median (horizontal line), 75th percentile (top of the box), and the maximum observations (top of the bar). †: p < 0.1, *: p < 0.05 vs. control (Wilcoxon single rank test).
carotenoid lycopene (data not shown). Analyses of typical compounds including saccharides, amino acids, and organic acids showed that the TS contained alanine, glutamine, and citric acid, all of which have been reported to influence alcohol metabolism (Table 2). Therefore, TS and the mixture of these compounds (AGC) were assessed for their effects on alcohol metabolism in SD rats. Oral administration of TS noticeably inhibited the elevation of the blood ethanol level after the dose of alcohol (Figure 4(A)). A significantly lower blood ethanol level was also observed in rats gavaged with AGC, which contained equal concentrations of alanine, glutamine, and citric acid as were present in TS. However, the effect was not compared with that of TS. Blood levels of pyruvate and lactate were significantly increased by administration of TS in rats, whereas those were not influenced by AGC (Figure 4(B), Figure 4(C)). Notably, TS-induced increases in the levels of pyruvate and lactate were consistent with the observations in the human study, in which TJAlc was given to male subjects. In contrast, other major aqueous compounds in tomato such as glucose and fructose did not show any effect on alcohol metabolism in rats (data not shown).
3.4. Enzyme Activities Involved in Alcohol Metabolism
To determine the effect of tomato or its aqueous components on alcohol metabolism, activities of ADH, ALDH, LDH, and alanine aminotransferase (ALT) enzymes were measured in rat livers that were harvested 60 min after alcohol gavage. Figure 5 summarizes the activity levels of these NAD(H)-dependent enzymes in liver from rats with or without TS administration 15 min prior to alcohol gavage. The administration of TS increased ADH and ALDH enzyme activity in the cytosolic fraction from rat liver (p = 0.082, Figure 5(A), Figure 5(B)). LDH catalyzes the reduction reaction from pyruvate to lactate; TS significantly increased the activity of LDH in liver cytosol (Figure 5(C)). Enzyme activity of ALT was not influenced by the administration of TS (Figure 5(D)). ALDH enzyme activity was also measured in microsomal and mitochondrial fractions, but did not show any changes (data not shown).
4. Discussion
Concomitant intake of alcohol with tomato juice significantly slowed the elevation of blood ethanol levels and thereafter shortened the elimination time from blood in healthy adult male subjects. This was clearly confirmed by two related results; 1) markedly increased levels of blood acetate were observed, and 2) significantly enhanced stimulant effects of alcohol were observed when subjects consumed the test beverage, TJAlc. In the present study, the blood pharmacokinetics of the metabolic intermediate acetaldehyde were not analyzed, because the subjects may have had either the normal (ALDH2*1/1), or the partly deficient (ALDH2*1/2), variant of ALDH2, the enzyme that plays the most pivotal role in the oxidation of acetaldehyde to acetate [25] . However, the increased levels of blood acetate were highly likely to result from the acceleration of ethanol metabolism by concomitant intake with tomato juice. Alcohol induced stimulant effects are generally higher at a relatively low blood ethanol level [16] ; the BAES method showed the stimulant effects were enhanced in subjects who had consumed TJAlc. This supports our observation that concomitant intake of alcohol with tomato juice accelerated alcohol metabolism in male subjects.
The effect of tomato on alcohol metabolism was completely attributable to aqueous components of tomato, not to the carotenoid lycopene, for which various physiological effects have been reported (primarily owing to a high scavenging ability for singlet oxygen). On the basis of a recent metabolomics analysis [26] that reported tomato fruit has at least 869 compounds, there are likely to be several hundred aqueous compounds including sugars, amino acids, organic acids, and polyphenols. Of these compounds, alanine, glutamine, and citric acid have been suggested to promote alcohol metabolism [20] [21] . However, these known compounds showed only minor effects on alcohol metabolism compared with TS. This indicates that other aqueous compounds with higher potencies must be present in tomato. The isolation and identification of these compounds is currently in progress.
A number of mechanisms have been proposed to explain how intake of foods could lower the blood ethanol levels; the pyruvate that occurs in the metabolic processing of some nutrients such as saccharides and glycogenic amino acids has been suggested to play an important role in some of these. Several studies have demonstrated that pyruvate serves to promote the re-oxidation of NADH that has been converted from NAD and accumulated in response to alcohol consumption, improving the ratio of NAD to NADH, and clearly increasing the metabolic turnover of NAD(H)-dependent enzymes involved in alcohol metabolism [27] -[30] . Our studies also showed a higher blood pyruvate level, both in male subjects who had consumed alcohol with tomato juice, and in SD rats
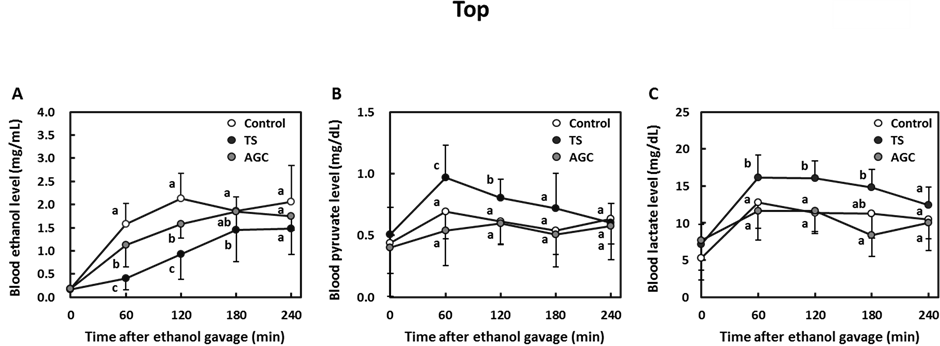
Figure 4. Changes in blood ethanol (A), pyruvate (B), and lactate (C) levels in male SD rats, which were gavaged with either water (control; n = 9), the aqueous fraction of tomato (TS; n = 9) or a solution containing alanine, glutamine and citric acid (AGC; n = 9), followed by an ethanol challenge (2.0 g/kg body weight). Data are shown as mean ± SD. Different letters indicate significant differences, p < 0.05 (Tukey-Kramer).

Figure 5. Alcohol dehydrogenase (ADH) (A), aldehyde dehydrogenase (ALDH) (B), lactate dehydrogenase (LDH) (C), and alanine aminotransferase (ALT) (D) enzyme activity in liver cytosol obtained from male SD rats, which were gavaged with either water (control; n = 4) or the aqueous fraction of tomato (TS; n = 5), followed by an ethanol challenge (2.0 g/kg body weight). Data are shown as mean ± SD. P-values are indicated on the graphs (Student’s t-test).
that had been gavaged with the TS, aqueous fraction of tomato. Furthermore, significant increases in blood lactate level and hepatic LDH enzyme activity were observed in response to consumption of aqueous compounds of tomato in the present study. These related findings provide a possible explanation on the effect of tomato as follows. First, active compound(s) in tomato increase the pyruvate level either by being a direct source of pyruvate, or by up-regulating the pathway involved in pyruvate synthesis. Second, the increased pyruvate level enhances hepatic LDH activity and subsequently the level of the metabolite lactate is increased. Third, LDH concurrently acts to improve the ratio of NAD to NADH by re-oxidation of NADH. Fourth, alcohol metabolism is accelerated by increasing activity of NAD-dependent enzymes such as ADH and ALDH. With respect to the increased level of pyruvate which was considered as an initiation step in the effect of tomato, it was suspected that pyruvate was originally present in tomato. However, pyruvate was not detected in tomato samples used in the present study, which is in agreement with a report by Yin et al. [31] , which showed the pyruvate level in tomato fruit was extremely low compared with other organic acids such as citric acid. Hence, it seems unlikely that the pyruvate came directly from the tomato juice. In the present study, a representative glycogenic amino acid, alanine, significantly lowered blood ethanol, but did not affect pyruvate level, when administered to rats by oral gavage. In addition, hepatic ALT enzyme activity was not significantly increased by administration of TS. These results suggest that pyruvate biosynthesis from alanine might not be involved in the effect of aqueous active compounds in tomato. In parallel with searching for active compounds, the mechanism by which these compounds increase pyruvate levels should be clarified in ongoing and future experiments.
5. Conclusion
We conclude that consumption of tomato (or drinking of tomato juice) while drinking alcohol accelerates alcohol metabolism in human subjects. Tomato is therefore likely to be one of the best suited foods to moderate a range of the effects of alcohol.
References
- Guo, R. and Ren, J. (2010) Alcohol and Acetaldehyde in Public Health: From Marvel to Menace. International Journal of Environmental Research and Public Health, 7, 1285-1301. http://dx.doi.org/10.3390/ijerph7041285
- Crabb, D.W., Matsumoto, M., Chang D. and You, M. (2004) Overview of the Role of Alcohol Dehydrogenase and Aldehyde Dehydrogenase and Their Variants in the Genesis of Alcohol-Related Pathology. Proceedings of the Nutrition Society, 63, 49-63. http://dx.doi.org/10.1079/PNS2003327
- Lieber, C.S. (2005) Metabolism of Alcohol. Clinics in Liver Disease, 9, 1-35. http://dx.doi.org/10.1016/j.cld.2004.10.005
- Bennion, L.J. and Li, T.K. (1976) Alcohol Metabolism in American Indians and Whites: Lack of Racial Differences in Metabolic Rate and Liver Alcohol Dehydrogenase. New England Journal of Medicine, 294, 9-13. http://dx.doi.org/10.1056/NEJM197601012940103
- Kopun, M. and Propping, P. (1977) The Kinetics of Ethanol Absorption and Elimination in Twins and Supplementary Repetitive Experiments in Singleton Subjects. European Journal of Clinical Pharmacology, 11, 337-344. http://dx.doi.org/10.1007/BF00566530
- Abe, Y., Haseba, T., Oshima, S., Kanda, T. and Ohno, Y. (2012) Influence of Drinking Conditions on Alcohol Metabolism in Healthy Men with ALDH2*1/*1 Genotype: Comparison between Different Alcoholic Drinks with or without Meal. Food and Nutrition Sciences, 3, 997-1003. http://dx.doi.org/10.4236/fns.2012.37132
- Southgate, H.W. (1925) The Effect of Alcohol, under Varying Conditions of Diet, on Man and Animals, with Some Observations on the Fate of Alcohol in the Body. Biochemical Journal, 19, 737-745.
- Oshima, S., Haseba, T., Masuda, C., Kakimi, E., Sami, M., Kanda, T. and Ohno, Y. (2012) Individual Differences in Blood Alcohol Concentrations after Moderate Drinking Are Mainly Regulated by Gastric Emptying Rate Together with Ethanol Distribution Volume. Food and Nutrition Sciences, 3, 732-737. http://dx.doi.org/10.4236/fns.2012.36099
- Sadzuka, Y., Inoue, C., Hirooka, S., Sugiyama, T., Umegaki, K. and Sonobe, T. (2005) Effects of Theanine on Alcohol Metabolism and Hepatic Toxicity. Biological and Pharmaceutical Bulletin, 28, 1702-1706. http://dx.doi.org/10.1248/bpb.28.1702
- Haseba, T., Sugimoto, J., Sato, S. Abe, Y. and Ohno, Y. (2008) Polyphenols in Whisky Lower Blood Acetaldehyde Level by Depressing Alcohol Metabolism through Inhibition of Alcohol Dehydrogenase 1 (Class 1) in Mice. Metabolism—Clinical and Experimental, 57, 1753-1759. http://dx.doi.org/10.1016/j.metabol.2008.09.003
- Seo, H.J., Jeong, K.S., Lee, M.K., Park, Y.B., Jung, U.J., Kim, H.J. and Choi, M.S. (2003) Role of Naringin Supplement in Regulation of Lipid and Ethanol Metabolism in Rats. Life Science, 73, 933-946. http://dx.doi.org/10.1016/S0024-3205(03)00358-8
- Giovannucci, E. (2002) A Review of Epidemiologic Studies of Tomatoes, Lycopene, and Prostate Cancer. Experimental Biology and Medicine, 227, 852-859.
- Kasagi, S., Seyama, K., Mori, H., Souma, S., Sato, T., Akiyoshi, T., Suganuma, H. and Fukuchi, Y. (2006) Tomato Juice Prevents Senescence-Accelerated Mouse P1 Strain from Developing Emphysema Induced by Chronic Exposure to Tobacco Smoke. American Journal of Physiology-Lung Cellular and Molecular Physiology, 290, L396-L404. http://dx.doi.org/10.1152/ajplung.00483.2004
- Suganuma, H. and Inakuma, T. (1999) Protective Effect of Dietary Tomato against Endothelial Dysfunction in Hypercholesterolemic Mice. Bioscience, Biotechnology, and Biochemistry, 63, 78-82. http://dx.doi.org/10.1271/bbb.63.78
- Aizawa, K., Matsumoto, T., Inakuma, T., Ishijima, T., Nakai, Y., Abe, K. and Amano, F. (2009) Administration of Tomato and Paprika Beverages Modifies Hepatic Glucose and Lipid Metabolism in Mice: A DNA Microarray Analysis. Journal of Agricultural and Food Chemistry, 57, 10964-10971. http://dx.doi.org/10.1021/jf902401u
- Martin, C.S., Earleywine, M., Musty, R.E., Perrine, M.W. and Swift, R.M. (1993) Development and Validation of the Biphasic Alcohol Effect Scale. Alcoholism: Clinical and Experimental Research, 17, 140-146. http://dx.doi.org/10.1111/j.1530-0277.1993.tb00739.x
- Earleywine, M. and Erblich, J. (1996) A Confirmed Factor Structure for the Biphasic Alcohol Effects Scale. Experimental and Clinical Psychopharmacology, 4, 107-113. http://dx.doi.org/10.1037/1064-1297.4.1.107
- Ray, L.A., Bujarski, S., Chin, P.F. and Miotto, K. (2012) Pharmacogenetics of Naltrexone in Asian Americans: A Randomized Placebo-Controlled Laboratory Study. Neuropsychopharmacology, 37, 445-455. http://dx.doi.org/10.1038/npp.2011.192
- Lisandar, B., Lundvall, O., Tomner, J. and Jones, A.W. (2006) Enhanced Rate of Ethanol Elimination from Blood after Intravenous Administration of Amino Acids Compared with Equicaloric Glucose. Alcohol and Alcoholism, 41, 39-43. http://dx.doi.org/10.1093/alcalc/agh188
- Cunningham, C.C., Preedy, V.R., Paice, A.G., Hesketh, J.E., Peters, T.J., Patel, V.B., Volpi, E., Mawatari, K., Masaki, H., Mori, M. and Torii, K. (2001) Ethanol and Protein Metabolism. Alcoholism: Clinical and Experimental Research, 25, 262S-268S. http://dx.doi.org/10.1111/j.1530-0277.2001.tb02406.x
- Tanaka, T., Imano, M., Yamashita, T., Monna, T., Nishiguchi, S., Kuroki, T., Otani, S., Maezono, K. and Mawatari, K. (1994) Effect of Combined Alanine and Glutamine Administration on the Inhibition of Liver Regeneration Caused by Long-Term Administration of Alcohol. Alcohol and Alcoholism-Supplement, 29, 125-132.
- Okada, T. and Mizoi, Y. (1982) Studies on the Problem of Blood Acetaldehyde Determination in Man and Level after Alcohol Intake. Japanese Journal of Alcohol Studies & Drug Dependence, 17, 141-159.
- Hayashi, M. (1992) Determination of Organic Acids in Foods by HPLC with Post-Column pH Buffered Electroconductivity Detection. Shimadzu Reviews, 49, 59-64.
- Kishimoto, R., Ueda, M., Kawakami, M., Goda, K., Park, S.S. and Nakata, Y. (1997) Effect of Chronic Administration of Alcoholic Beverages and Seasoning Containing Alcohol on Hepatic Ethanol Metabolism in Mice. Journal of Nutritional Science and Vitaminology, 43, 613-626. http://dx.doi.org/10.3177/jnsv.43.613
- Harada, S., Agarwal, D.P. and Goedde, H.W. (1981) Aldehyde Dehydrogenase Deficiency as Cause of Facial Flushing Reaction to Alcohol in Japanese. Lancet, 2, 982. http://dx.doi.org/10.1016/S0140-6736(81)91172-7
- Iijima, Y., Nakamura, Y., Ogata, Y., Tanaka, K., Sakurai, N., Suda, K., Suzuki, T., Suzuki, H., Okazaki, K., Kitayama, M., Kanaya, S., Aoki, K. and Shibata, D. (2008) Metabolite Annotations Based on The integration of Mass Spectral Information. The Plant Journal, 54, 949-962. http://dx.doi.org/10.1111/j.1365-313X.2008.03434.x
- Westerfeld, W.W., Stotz, E. and Berg, R.L. (1942) The Role of Pyruvate in the Metabolism of Ethyl Alcohol. Journal of Biological Chemistry, 144, 652-665.
- Mangeney, M., Beaugé, F., Nordmann, J. and Nordmann, R. (1979) Effect of Natural Amino Acids on Ethanol Oxidation in Isolated Rat Hepatocytes. Archives Internationales de Physiologie, de Biochimieet de Biophysique, 87, 603-612.
- Beaugé, F., Mangeney, M., Nordmann, J. and Nordmann, R. (1980) Comparative Study of the Effect of Amino Acids on Ethanol Oxidation in Isolated Hepatocytes from Starved and Fed Rats. Advances in Experimental Medicine and Biology, 132, 393-402.
- Tanaka, M., Nishigaki, Y., Fuku, N., Ibi, T., Sahashi, K. and Koga, Y. (2007) Therapeutic Potential of Pyruvate Therapy for Mitochondrial Diseases. Mitochondrion, 7, 399-401. http://dx.doi.org/10.1016/j.mito.2007.07.002
- Yin, Y.G., Tominaga, T., Iijima, Y., Aoki, K., Shibata, D., Ashihara, H., Nishimura, S., Ezura, H. and Matsukura, C. (2010) Metabolic Alterations in Organic Acids and Gamma-Aminobutyric Acid in Developing Tomato (Solanum lycopersicum L.) fruits. Plant and Cell Physiology, 51, 1300-1314. http://dx.doi.org/10.1093/pcp/pcq090