Food and Nutrition Sciences
Vol.4 No.11(2013), Article ID:37538,10 pages DOI:10.4236/fns.2013.411141
Effect of Blended Rice Bran and Olive Oil on Cardiovascular Risk Factors in Hyperlipidemic Patients
![]()
Punjab Agricultural University, Ludhiana, India.
Email: moni0986@gmail.com
Copyright © 2013 Monika Choudhary et al. This is an open access article distributed under the Creative Commons Attribution License, which permits unrestricted use, distribution, and reproduction in any medium, provided the original work is properly cited.
Received August 6th, 2013; revised September 6th, 2013; accepted September 13th, 2013
Keywords: Blended Rice Bran and Olive Oil; Hyperlipdemia; Lipid Profile
ABSTRACT
The present study was designed to evaluate the effectiveness of blended rice bran and olive oil on hyperlipidemic subjects. A total of 60 moderately hyperlipidemic patients (Total Cholesterol (TC) >200 mg/dl and/or Triglycerides (TG) >150 mg/dl) with an age range of 45 - 60 were selected from Mediciti Hospital of Ludhiana and were divided into two groups: Group A and Group B containing 30 subjects each. The subjects of Group B were given blended rice bran and olive oil for a time period of 45 days and were asked to continue with their routine eating and physical activity pattern. The subjects of Group A were kept on their regular cooking oil. The serum lipid values were assessed before and after the study. Additional parameters assessed included anthropometry, dietary fat intake and physical activity pattern. The results showed that there was an insignificant change in the average body mass index (BMI) of the subjects of Group B before (27.0 kg/m2) and after (26.9 kg/m2) the study respectively. Also, there was an insignificant change in the lipid levels of the subjects of Group B after the study. The levels of TC and LDL cholesterol decreased by 3.7 and 9.0 percent respectively. Whereas, the levels of TG and VLDL cholesterol increased by 9.5 percent in the subjects of Group B after the feeding trials. Further, systolic and diastolic blood pressure of the subjects of Group B reduced by 2.9 and 2.3 percent respectively. An insignificant change was observed in all the parameters of selected subjects. So, the present study recommends carrying out more long duration research studies to evaluate the effectiveness of this blended oil.
1. Introduction
India is on the threshold of an epidemic of cardiovascular disease, and surveys in urban areas show that coronary risk factors are widespread [1]. Hyperlipidemia is an established major risk factor for coronary artery disease and has become a preeminent target for reducing cardiovascular risk [2]. Lifestyle risk factors, especially dietary habits, have a substantial effect on hyperlipidemia. Numerous studies in both animals and humans demonstrated that the saturated fatty acids and cholesterol in the diet are the primary determinants of diet-induced hyperlipidemia. Overtime considerable research has been directed towards dietary manipulation that can positively reduce serum lipid levels resulting in the lowering of cardiovascular risk. The American Heart Association (AHA) Guidelines, for instance, have emphasized on dietary cholesterol and fat reduction as a first step for treating hypercholesterolemia [3].
The quantity and quality of a dietary fat play a crucial role in the plasma cholesterol and lipid levels [4]. To maintain aesthetic quality of vegetable oil, blending of oils is gaining popularity worldwide due to its advantages like improved thermal stability, oxidative stability, and nutritional benefits [5]. The traditional cooking oils used in India include mustard, coconut, palm olein, groundnut, safflower and sunflower oil, while newer oils include soybean oil, rice bran oil, and olive oil. Several research studies have demonstrated the quality and properties of blended oils like sunflower and rice bran oil, sunflower and palm olein oil, soybean and palm olein oil, rice bran and mustard oil, coconut and groundnut oil, sesame and coconut oil [5,6]. But, no study has been reported to document the health benefits of blended rice bran and olive oil.
Rice bran oil (RBO) has been investigated for its chemical, nutritional and toxicological properties and has been found to be safe for human consumption. RBO, with its unsaponifiable matter, which is rich in phytosterols, gamma oryzanol and total tocopherol, has been shown to have blood cholesterol-lowering properties compared with other oils, in both animals and humans [7,8]. Olive oil (OO) contains a wide variety of valuable antioxidants and is also rich in monounsaturated fatty acids (67.0%). Studies have also proved that consumption of olive oil can provide heart health benefits such as favorable effects on cholesterol regulation and LDL cholesterol oxidation and it also exerts anti-inflammatory, antithrombotic, antihypertensive as well as vasodilatory effects both in animals and in humans [9,10].
The present investigation was undertaken, to study the effect of blended rice bran and olive oil (RBO + OO) (70:30 ratio with oryzanol and alpha tocopherol equivalent) on human subjects with hyperlipidemia when the oil was introduced into a household. Besides dietary intake of oils, since several lifestyle factors including sedentary life, lack of exercise and inappropriate diet, are also known to affect lipid profile in humans. Hence, lifestyle factors were also assessed during the study to isolate the effect of RBO + OO alone on hyperlipidemia.
2. Materials and Methods
2.1. Selection of Blended Oil (RBO + OO)
Under one parameter of our pilot study [11], we prepared six rice bran oil blends in two ratios i.e. 80:20 and 70:30 and analyzed for fatty acid composition, physicochemical properties, oxidative stability, and antioxidant activity. Consequently, RBO + OO (70:30) contained 19 percent SFA, 47.6 percent MUFA and 33.4 percent PUFA respectively. In terms of physicochemical properties RBO + OO (70:30) showed appropriate smoke point (200˚C) and frying temperature (175˚C), and had low acid value (0.19 mg KOH/g) as well as a low percentage of free fatty acids (0.09%). Also, in terms of oxidative stability and antioxidant activity, RBO + OO (70:30) showed least percent increase (30.3%) in peroxide formation after 28 days of incubation period and had the highest content of total natural antioxidants (2525.0 mg/kg) and highest radical scavenging activity (67.7%).
2.2. Selection of Subjects
A total of 60 moderately hyperlipidemic (Total Cholesterol (TC) >200 mg/dl and/or Triglycerides (TG) >150 mg/dl) with an age range of 45 - 60 years, visiting dietary department for counselling, were selected from Mediciti Hospital of Ludhiana, after they provided a medical history, underwent a physical examination, and had a clinical blood analysis performed before enrollment in the study. The subjects had no evidence of any chronic illness, including diabetes, hepatic, renal, thyroid, or cardiac dysfunction. They were neither chronic alcoholics nor smokers and were not taking medication known to affect plasma lipid levels. Frequent travelers, subjects who frequently ate out, subjects who were using rice bran oil and olive oil as regular cooking media were also excluded from participation in the study. The research was approved by the appropriate committee of the institution and an informed written consent was obtained from all the subjects who participated in the trial and they were explained in detail the study protocol and the other requirements, including number of visits to be made to the hospital during the study, strictly adhering to the cooking oil samples supplied etc.
2.3. Experimental Protocol
To evaluate the effectiveness of blended oil, selected subjects (N = 60) were divided into two groups—Group A (Control) and Group B (Experimental) containing 30 subjects each (n = 30). RBO + OO (70:30) was procured from the Tara Health Foods Limited (Sangrur, Punjab, India) in the containers (5 liters) without labelling. The subjects of Group B were given RBO + OO and sufficient quantity of oil was distributed to fulfill the requirements of the whole family as per their regular intake and were asked to continue with their routine eating and physical activity pattern. Test oil was given code and subjects were not aware of the code. The subjects of Group A were kept on their regular cooking oil. The experimental period was carried out for a duration of 45 days.
2.4. Lifestyle Assessment
Information about the subjects pertaining to age, education, occupation, family composition and socio-economic status was collected using the pretested interview schedule. Physical Activity Diary Method (PADM) was used to record the time spent on different activities. Physical Activity Ratios (PAR) given by FAO/WHO/UNU was used to assess the physical activity level of the subjects [12]. Dietary survey was carried out to get information about a type of oil consumed, adequacy of fat including visible fat and invisible fat, total quantity of visible and invisible fat consumed by subjects. The required fatty acid ratios were also calculated to know the risk ratio. The 24 hour food recall method for 3 consecutive days was used to assess the dietary intake of subjects. The average daily intake of nutrients was calculated using the Indian Nutrition Software (Diet Soft).
The fat intake was compared with the recommended dietary allowances given by Indian Council of Medical Research (ICMR) [13]. According to ICMR, dietary fat should provide a minimum of 20 percent of energy in a normal diet, which ensures <10 per cent energy from saturated fatty acids (SFAs), and 6 - 10 per cent energy from polyunsaturated fatty acids (PUFAs) and 9 - 15 per cent energy from monounsaturated fatty acids (MUFAs) with an optimum ratio of SFA, MUFA and PUFA i.e., 1:1.5:1. The quality of dietary fat should be such that it furnishes PUFA/SFA (P/S) and linoleic acid (n6)/linolenicacid(n3) (n6/n3) between 0.8 - 1.0 and 5 - 10, respectively. Various anthropometric parameters viz. height, weight, triceps skin fold thickness (TSFT), mid upper arm circumference (MUAC), waist and hip circumference were recorded using standard methods [14]. Body Mass Index (BMI) and waist-hip ratio was also calculated.
2.5. Biochemical Analysis
A minimum of 15 ml of fasting blood samples were obtained for lipid profile determinations in an EDTA vacutainer by trained personnel under aseptic conditions from all subjects before and after the experimental period and analyzed for Serum Triglycerides (TG) [15], Total cholesterol (TC) [16] and high density lipoprotein cholesterol (HDL-C) [17] by automated methods. Serum low density lipoprotein cholesterol (LDL-C) was calculated from primary measurements using the empirical formula of by Friedwald [18] equation according to which LDL cholesterol = Total cholesterol—(HDL cholesterol + VLDL cholesterol) whereas very low density lipoprotein cholesterol (VLDL-C) was estimated as triglyceride divided by 5. Systolic (SBP) and diastolic blood pressure (DBP) was also recorded using a sphygmomanometer.
2.6. Statistical Analysis
Data were statistically analyzed by CPCS1. Student’s t-test and paired t-test were used to test the significant (p < 0.05) differences between variables. Relevant coefficients of correlations were also computed.
3. Results and Discussion
Background information of the subjects is given in Table 1. The data revealed that the majority of subjects belonged to the age group of 55 to 60 years and were studied up to matric. The majority of the subjects was doing service as their major occupation. The data further revealed that most of the subjects had family incomes above Rs. 60,000 on monthly basis.
3.1. Physical Activity Pattern
Physical activity pattern of the subjects was divided into ten activities viz. sleeping, personal care, eating, sitting, general household work, driving a car to/from work, light leisure activity (Television, Chatting), low intensity aerobic exercise, non mechanized agriculture work and walking at varying places without a load (Table 2).
The time of activities is presented in minutes. Sleeping
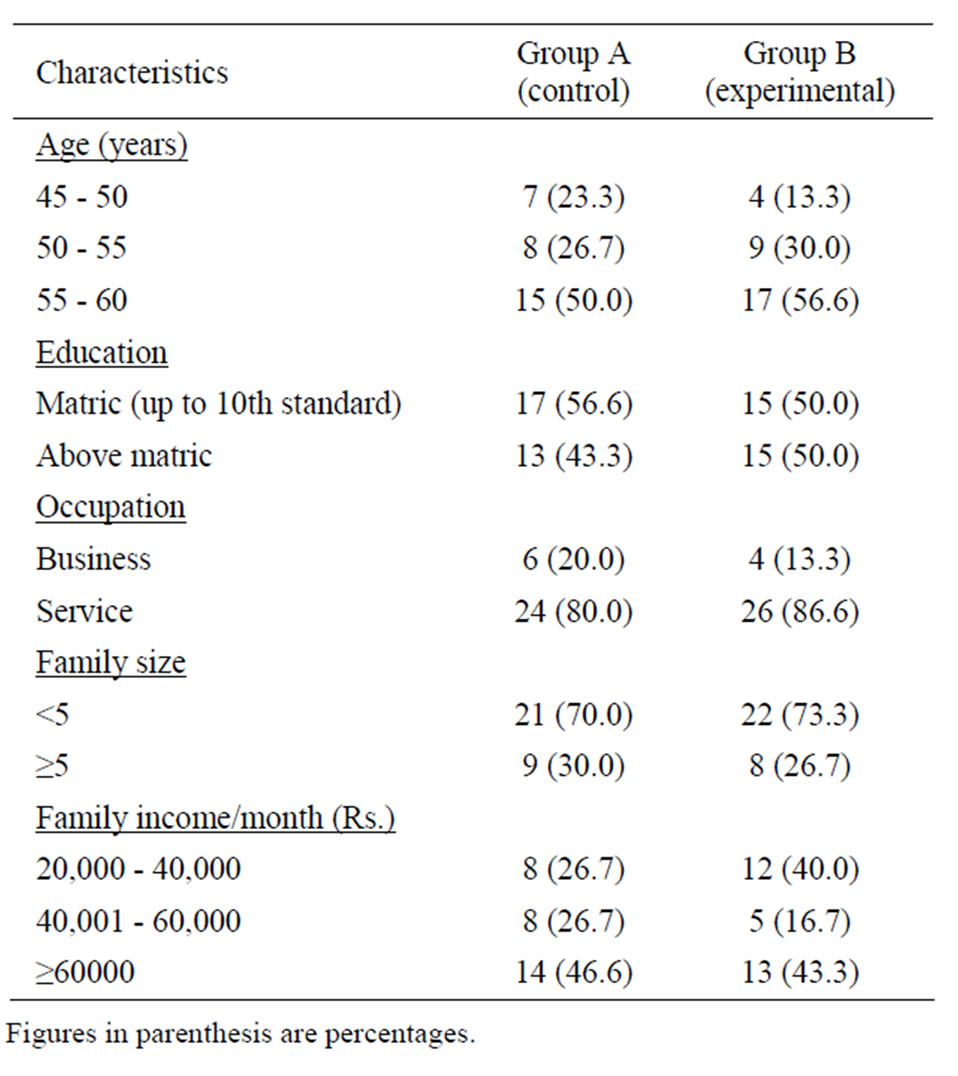
Table 1. Background information of the selected subjects (n = 30).
was reported as the major activity performed by the subjects. The average time spent on sleeping was reported as 464.0 and 496.0 minutes by the subjects in Group A and Group B respectively. Sitting was the second major activity performed by the subjects. The average time spent on sitting was reported as 362.0 and 402.0 minutes by the subjects in Group A and Group B respectively. The time spent on sleeping and sitting by the subjects of Group B was insignificantly more as compared to the subjects in Group A. The third major activity performed by the subjects was light leisure activity like watching television and chatting. Walking at varying places without a load was the fourth major activity performed by the subjects. The average time spent on this activity by subjects of Group B (176.0 minutes) was observed insignificantly more as compared to the subjects of Group A (120.0 minutes). An insignificant difference was observed in the time spent on different activities performed by the subjects in both groups. Physical activity level (PAL) is the energy requirement expressed as a multiple of 24-hour BMR. The data revealed that most of the subjects in Group A (70.0%) and Group B (66.6%) were falling in the sedentary or light activity lifestyle on the basis of their PAL i.e., 1.53 and 1.54 respectively. In contrast, previous study reported a higher value of PAL i.e. 1.6 [19].
3.2. Dietary Fat Intake
The data regarding the type and frequency of fat/oil consumed by the subjects is given in Table 3. The survey

Table 2. Physical activity pattern of the selected subjects (n = 30).
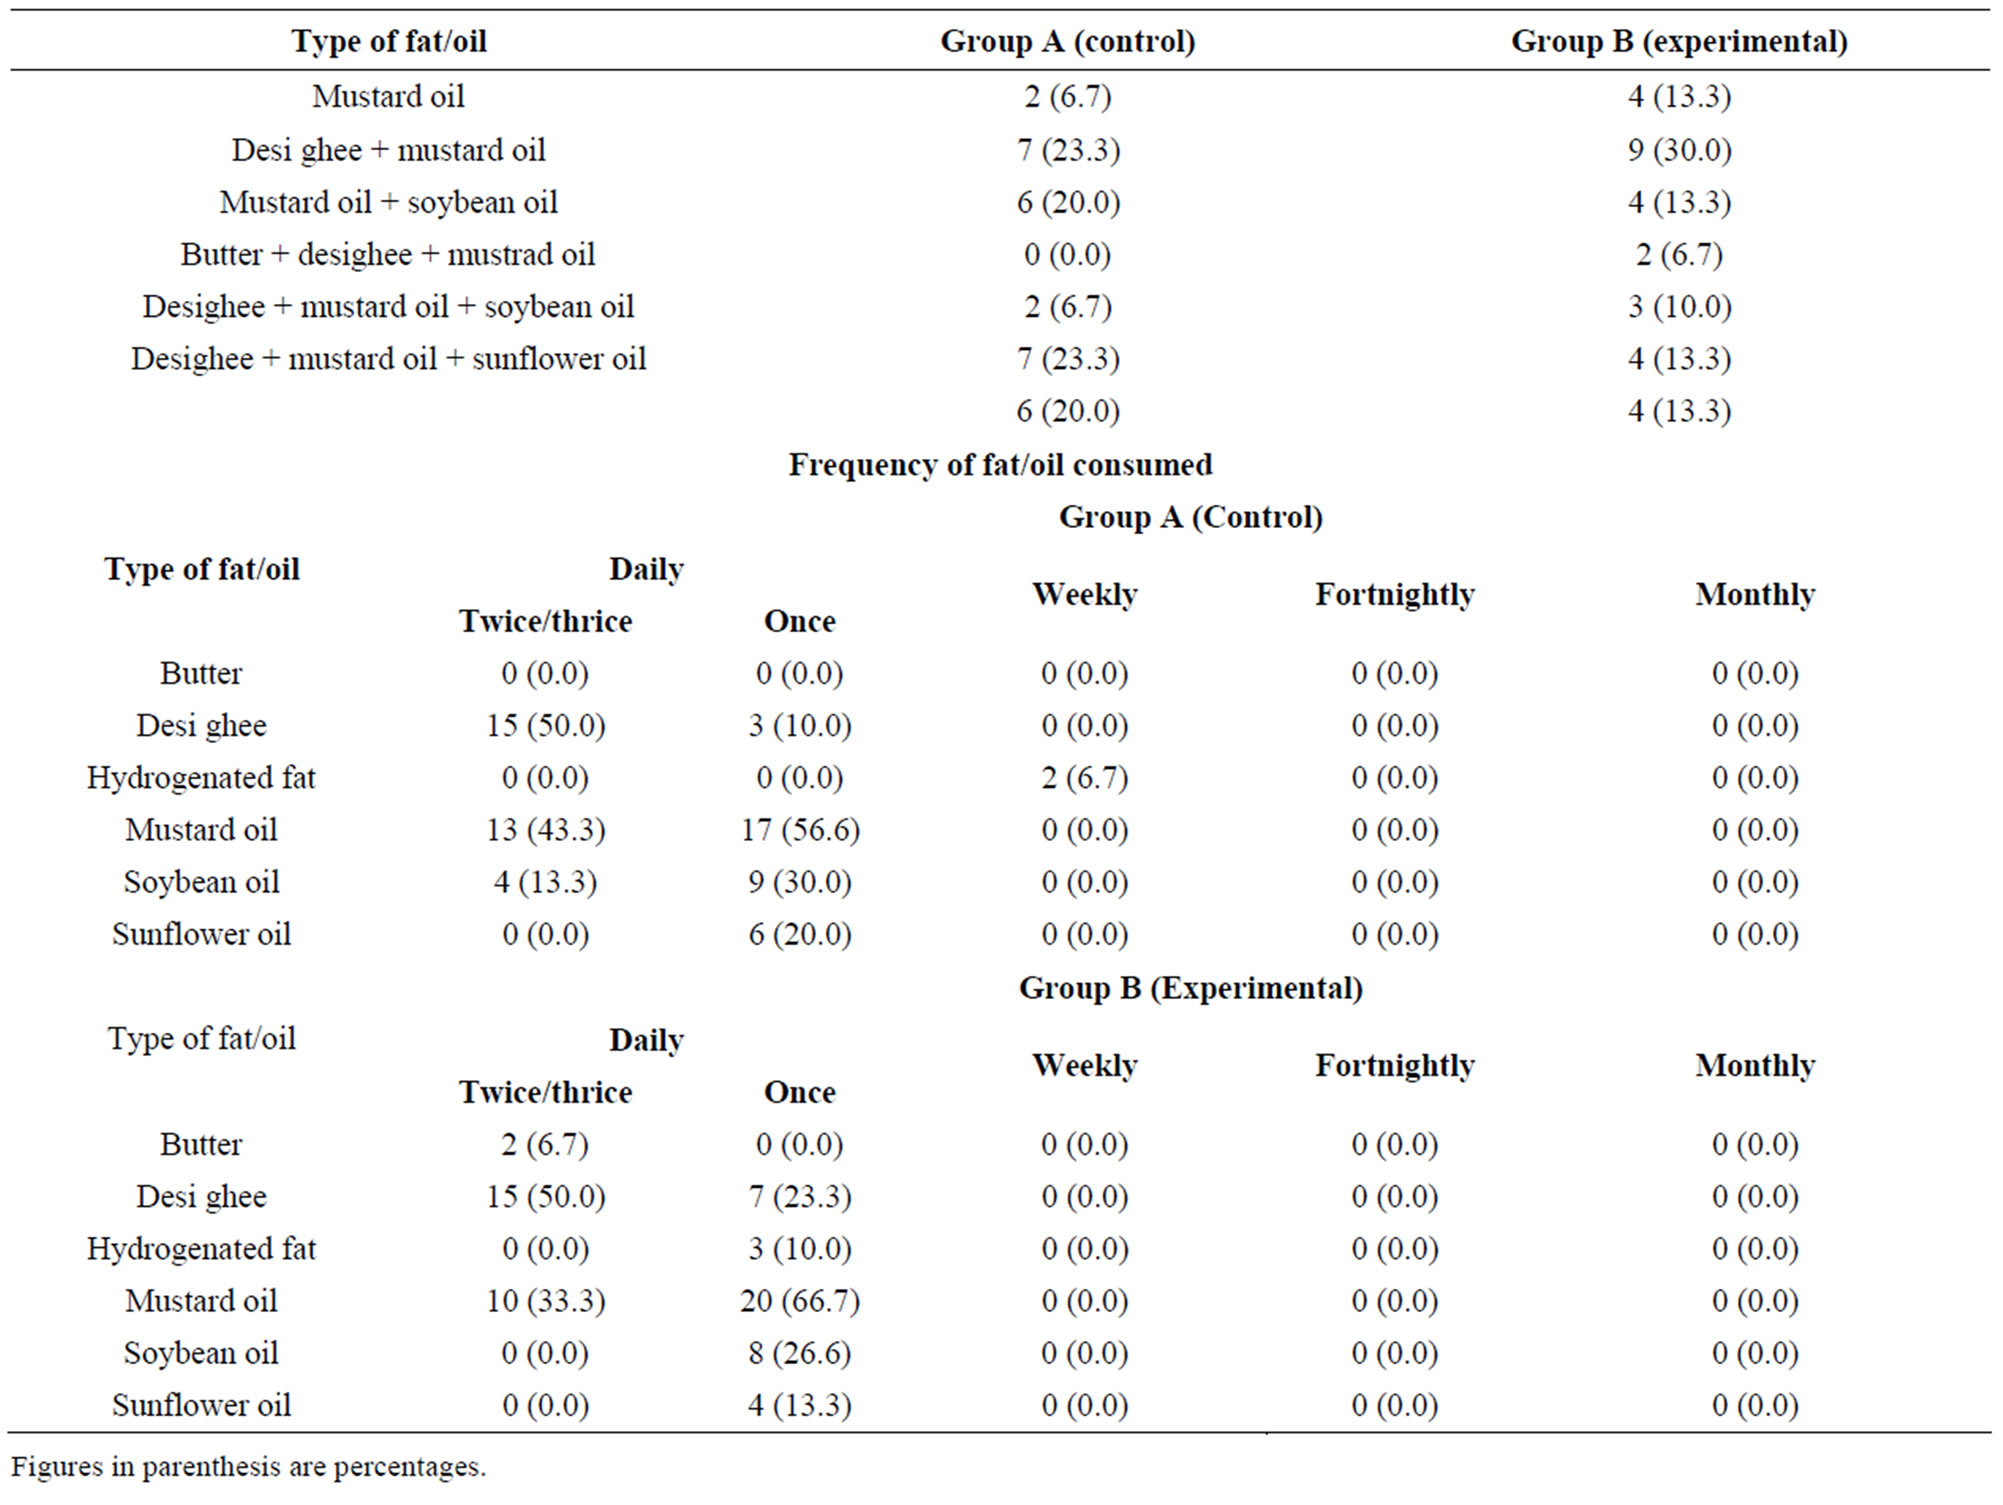
Table 3. Type and frequency of fat/oil consumed by the selected subjects (n = 30).
data revealed that desi ghee+ mustard oil was the most common combination of fat/oil consumed by the 30 percent of the subjects in Group B whereas in Group A, desi ghee + mustard oil and desighee + mustard oil+ soybean oil were the most common combinations of fat/oil consumed by the 23.3 percent of the subjects prior to the study. Desi ghee is a class of clarified butter that is rich in SFA (65%) [20]. In terms of frequency also, desi ghee and mustard oil were the most frequently consumed fat/oil by the subjects. The data depicted that 56.6 and 66.7 percent of the subjects in Group A and Group B used to consume mustard oil once a day respectively whereas 50.0 percent of the subjects in both groups used to consume desi ghee twice/thrice daily. The survey data of the previous studies also revealed that desi ghee and mustard oil were the most frequently used fat/oil in the urban and rural area of Punjab [21].
The data pertaining to average daily intake of energy, total fat, fat fractions and different ratios by the subjects is presented in Table 4. It was observed that initial average total fat intake by the subjects of Group A and Group B was 70.3 and 82.7 g/day respectively. After the study the corresponding figures were 79.3 and 79.9 g/day by the subjects of Group A and Group B with the percent contribution of 33.2 and 31.4 to the total energy intake respectively (Figure 1). The findings of the study were in line with previous studies which reported that the average total fat intake by the adult males was 61.0 g/day [22]. In contrast, an another study reported a lower value of average total fat intake (48 - 54 g/day) by the adults in Punjab. An insignificant change was observed in the total fat intake by the subjects in both groups. Though the total fat intake by the subjects in both groups was higher than the recommendations (33.3 g/day) but the SFA:MUFA: PUFA of the subjects in Group A (1:1.1:0.9) was found to be close to the recommendations given by ICMR and n6/n3 (6.7) was found to be within the suggested range (5 - 10) before the study. Whereas, the subjects of Group B had SFA:MUFA:PUFA (1:1.1:0.7) close to the recommendations after the study.
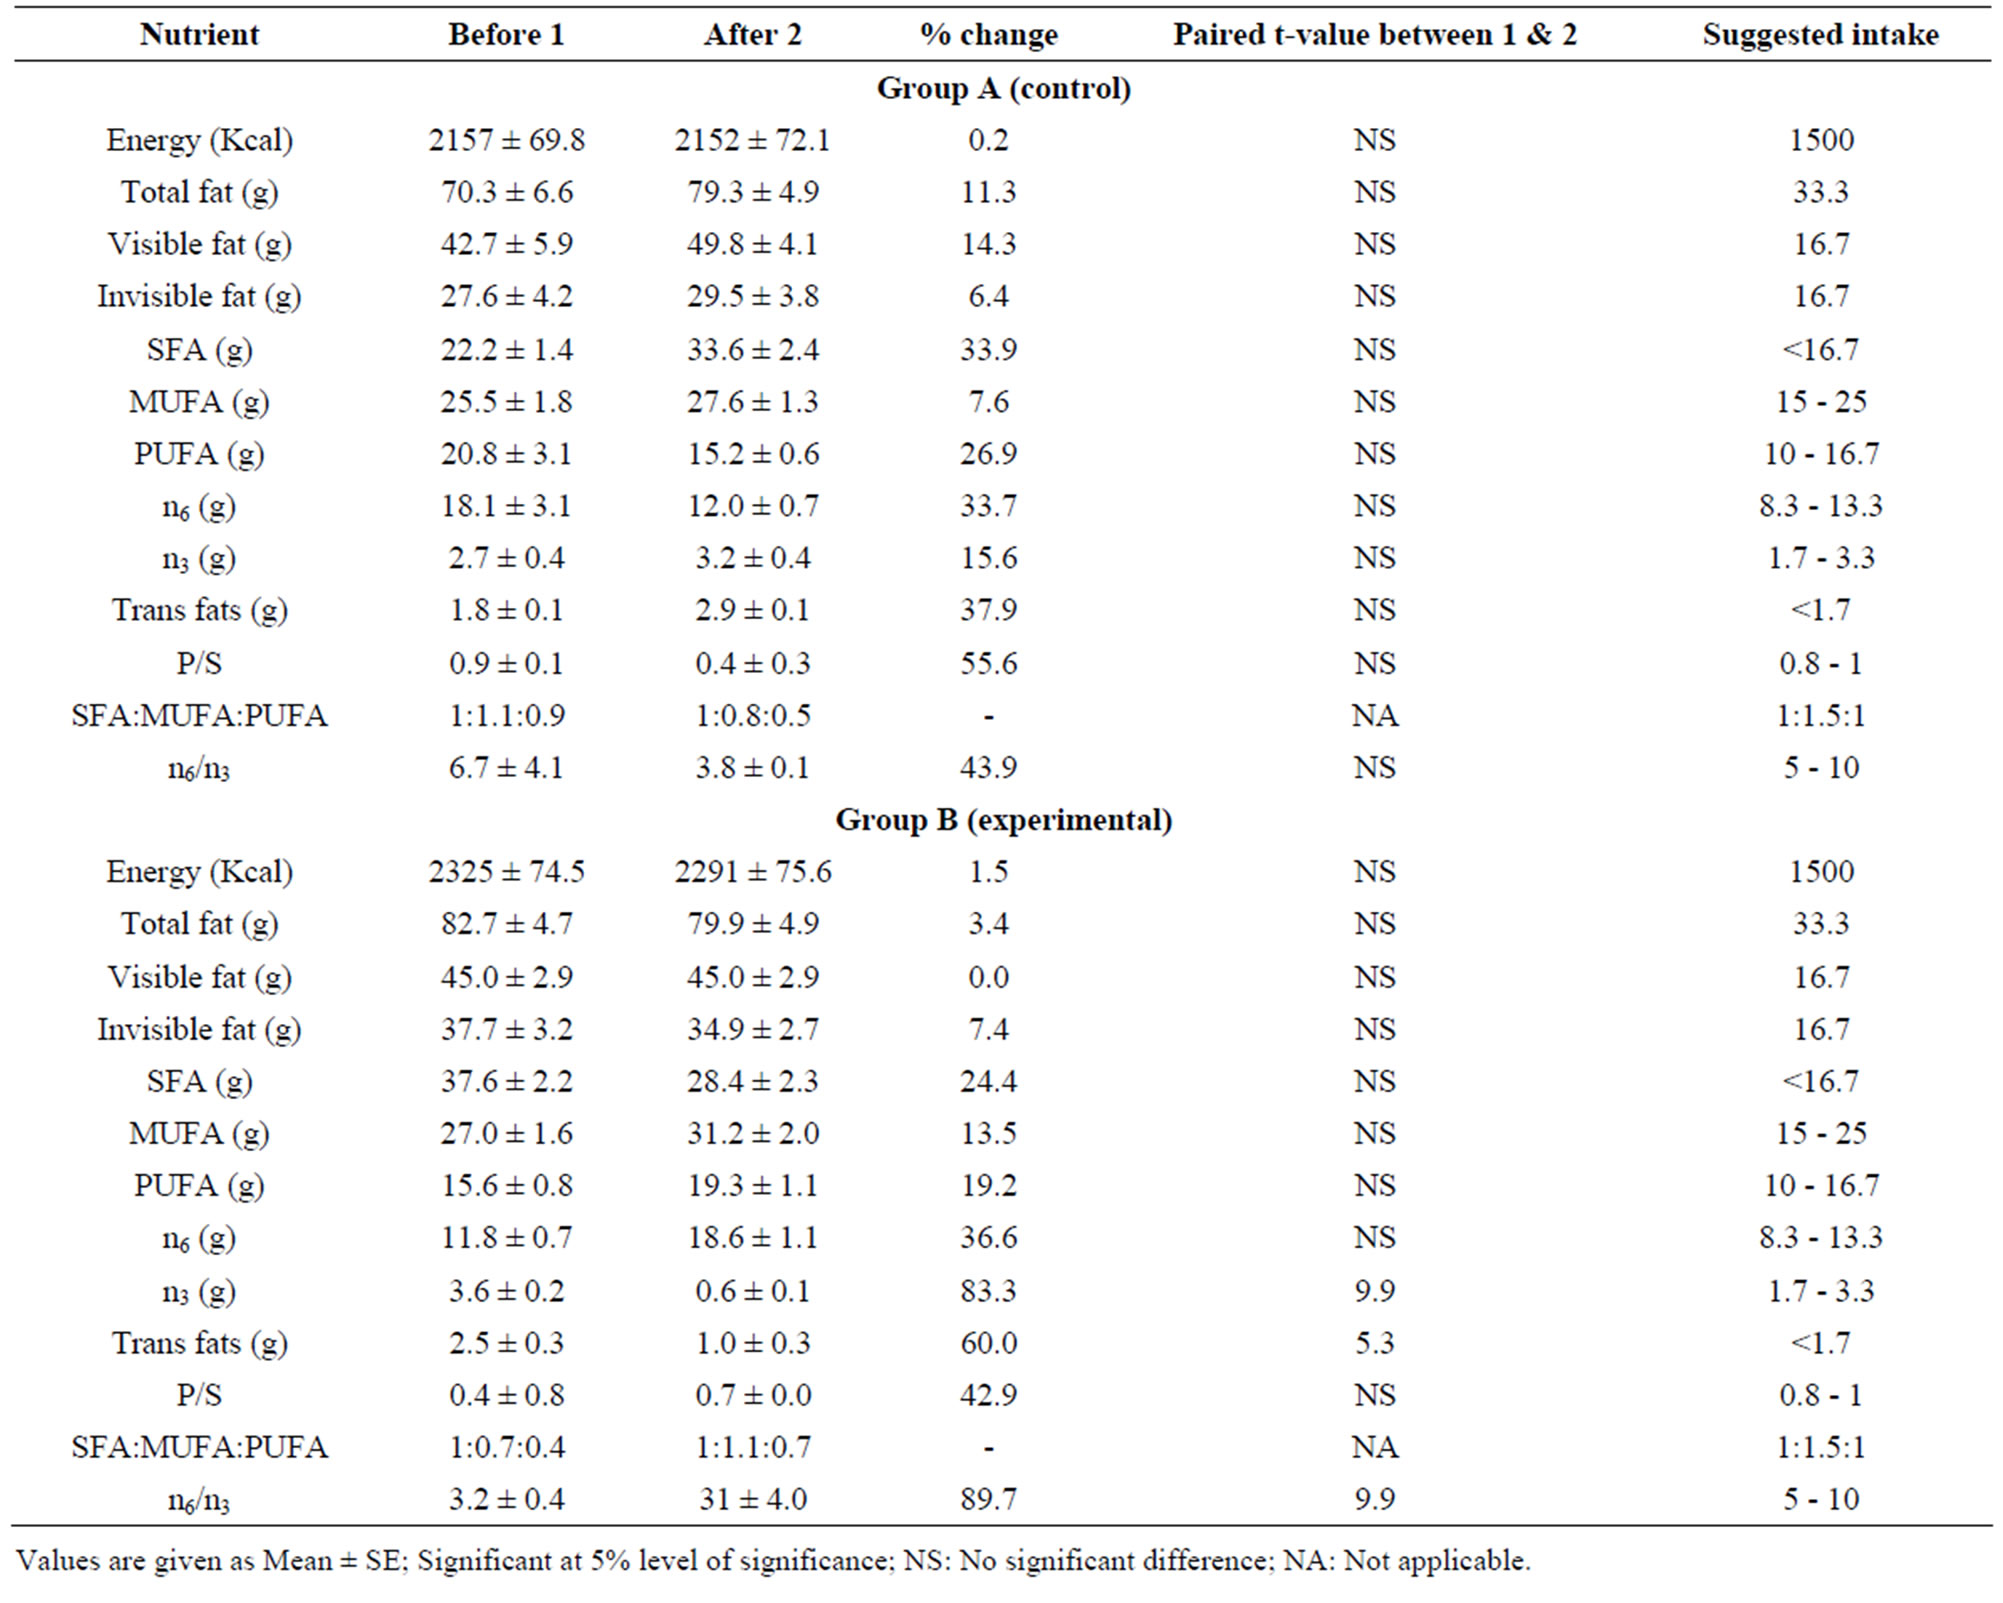
Table 4. Mean daily fat intake of the selected subjects (n = 30).
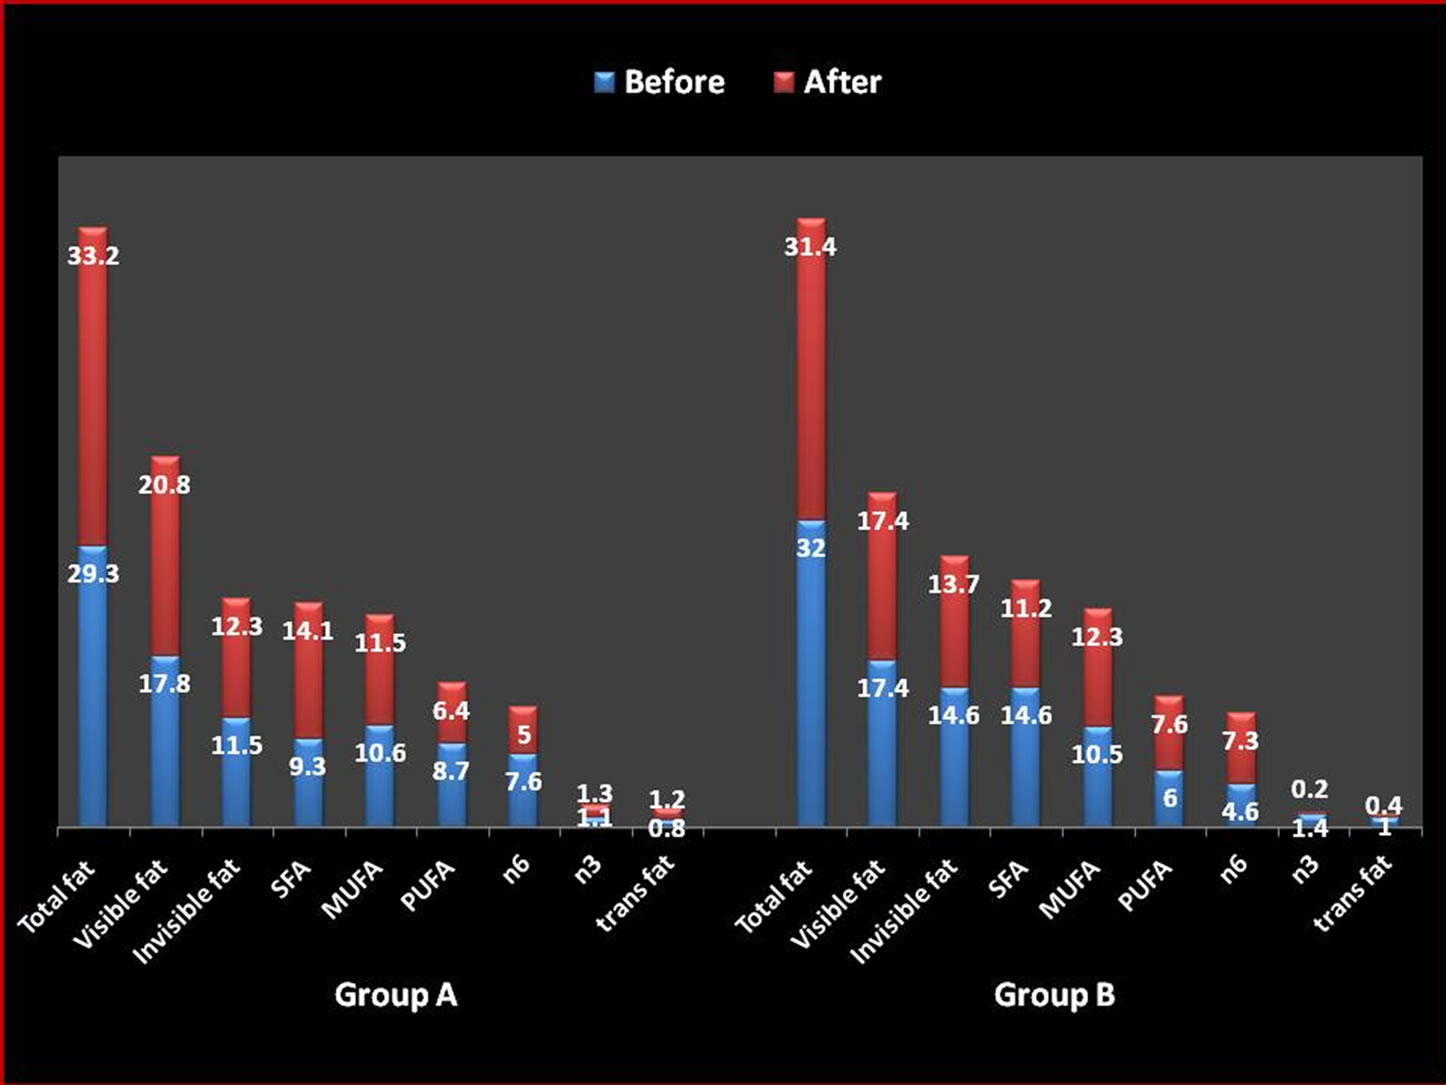
Figure 1. Percent contribution of fat fractions to the total energy intake of the selected subjects (n = 30).
The improvement in the ratio could be due the intake of blended rice bran and olive oil as after the experimental period, the intake of SFA decreased insignificantly by 24.4 percent and the intake of MUFA and PUFA increased insignificantly by 13.5 and 19.2 percent respectively. It was also observed that the intake of visible fat was same i.e. 45.0 g/day by the subjects of Group B before and after the feeding trials with the percent contribution of 17.4 to the total energy intake. The reported value of visible fat intake was in accordance with the findings of a recent study in which the corresponding figure was 47.7 g/day [22]. In contrast, Kaur et al [23] reported a lower value of visible fat intake i.e. 30 - 40 g/day by the adult males. In comparison to the subjects of Group A, the n6/n3 (31.0) of the subjects of Group B was found to be higher than the suggested range (5 - 10) after the study as the intake of n6 increased insignificantly by 36.6 percent and the intake of n3 decreased significantly (p ≤ 0.05) by 83.3 percent respectively. This could be due to the absence of n3 in the blended rice bran and olive oil. The intake of trans fats was also decreased significantly (p ≤ 0.05) by 60.0 percent after study in the subjects of Group B.
Further, it was observed that invisible fat intake by the subjects in Group A and Group B was 27.6 and 37.7 g/day with the percent contribution of 11.5 and 14.6 to the total energy, respectively before the study. The corresponding figures changed to 29.5 and 34.9 g/day with the percent contribution of 12.3 and 13.7 to the total energy, respectively after the study. Milk was the main source of invisible fat in the diets of the subjects followed by cereals and pulses. The respective contribution of milk and cereals and pulses was nearly 21.9 and 3.5 g/day by the subjects in Group A and 23.7 and 5.3 g/day by the subjects in Group B to the total invisible fat after the study. These results were in contrast to the NNMB data from other states where cereals and millets contributed more fat due to low milk intake. The contribution of invisible fat to the total fat was lesser than visible fat intake by the subjects in both groups.
The percent adequacies of all the fat fractions of the subjects in both groups (except the percent adequacy of n3 (24.0) and trans fat (58.8) of the subjects in Group B) were recorded to be higher than the 100 percent which depicted the high intake of dietary fat by the subjects in both groups before and after the study (Figure 2). The findings of the study were in line with previous study [23].
3.3. Anthropometric Profile
The anthropometric profile of the selected subjects is presented in Table 5. Body mass index (BMI) is a simple index of weight-for-height that is commonly used to classify overweight and obesity in adults [24]. An insignificant change was observed in the average BMI of the subjects in Group A and Group B before (27.8 and 27.0 kg/m2) and after (27.8 and 26.9 kg/m2) the study respectively.
The distribution of the selected subjects according to
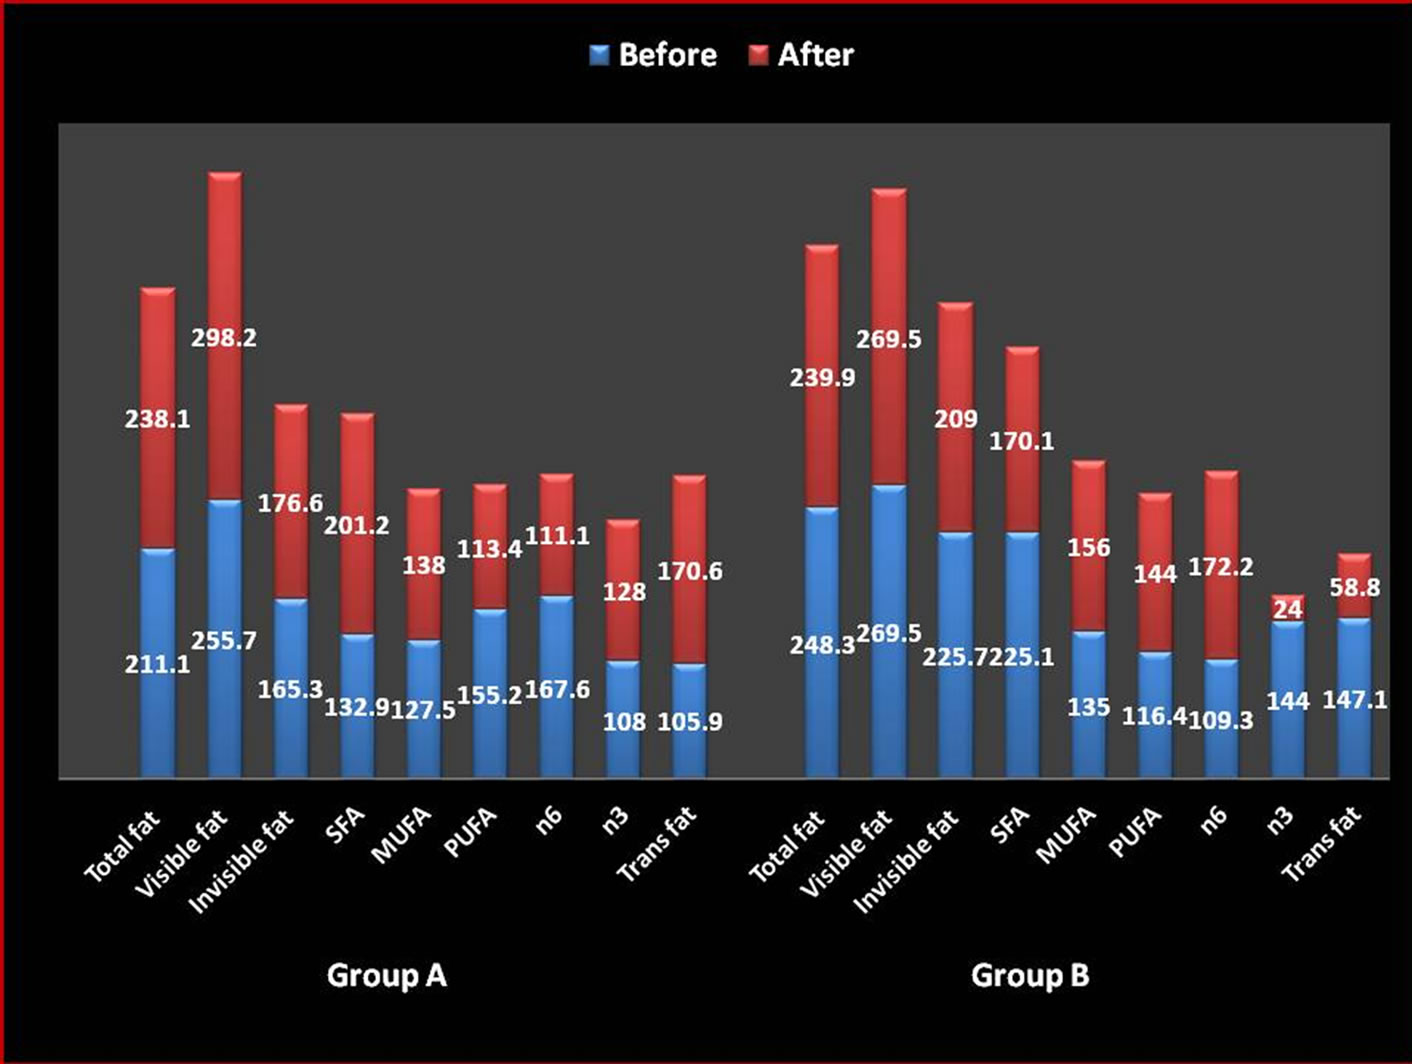
Figure 2. Percent adequacy of fat intake of the selected subjects (n = 30).
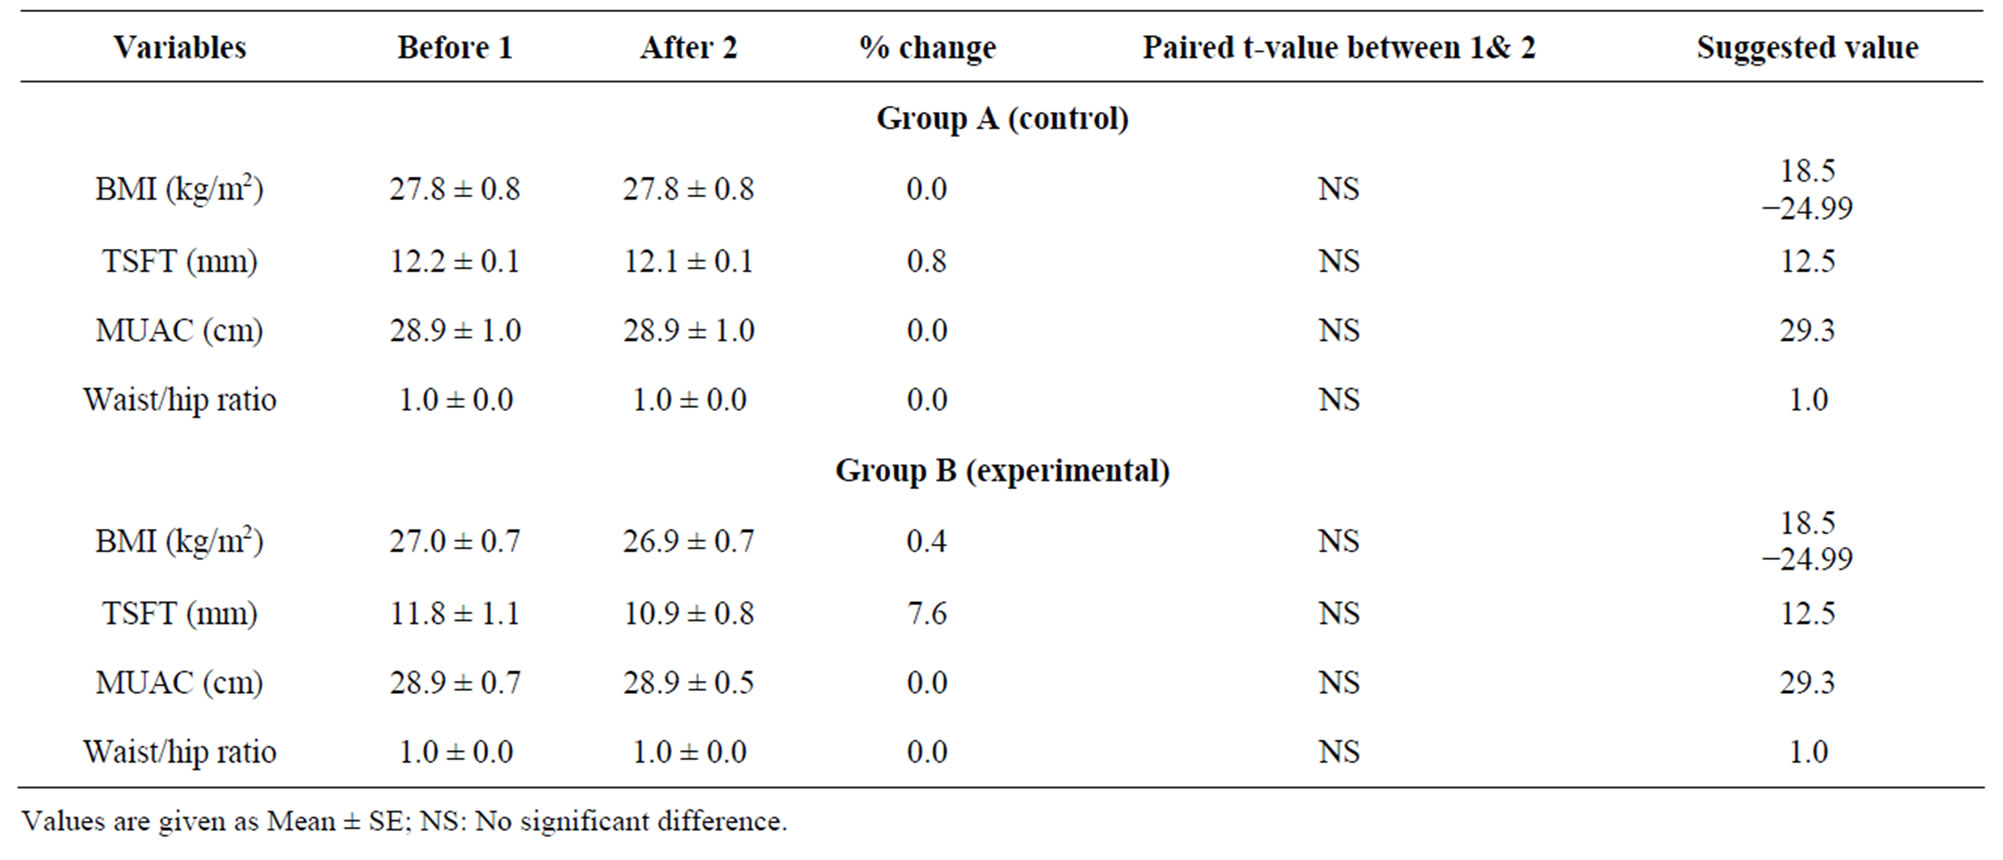
Table 5. Anthropometric profile of the selected subjects (n = 30).
their BMI as per WHO classification is illustrated in Figure 3. Most of the subjects in Group A (50.0%) and Group B (53.3%) were categorized as overweight respectively with a BMI range 25.00 - 29.99 kg/m2, more specifically pre-obese (30.0 and 36.6 percent, respectively) with a BMI range 25.00 - 27.49 kg/m2 before and after the study. In contrast, previous studies reported an average BMI of 30 kg/m2 [25]. An insignificant change was also observed in the TSFT and MUAC of the subjects in Group A and Group B but the values were lesser than the standard values in both groups. Similarly, waist/hip ratio
(1.0) of the subjects in both groups was also in line with the standard value (1.0) as suggested by Ghafoorunissa and Krishnaswamy [26]. There were no significant changes in the anthropometric profile of the subjects in both groups before and after the study.
3.4. Biochemical Analysis
The clinical parameters of the selected subjects are presented in Table 6 ([26]). There was an insignificant change in the lipid levels of the subjects of the Group B
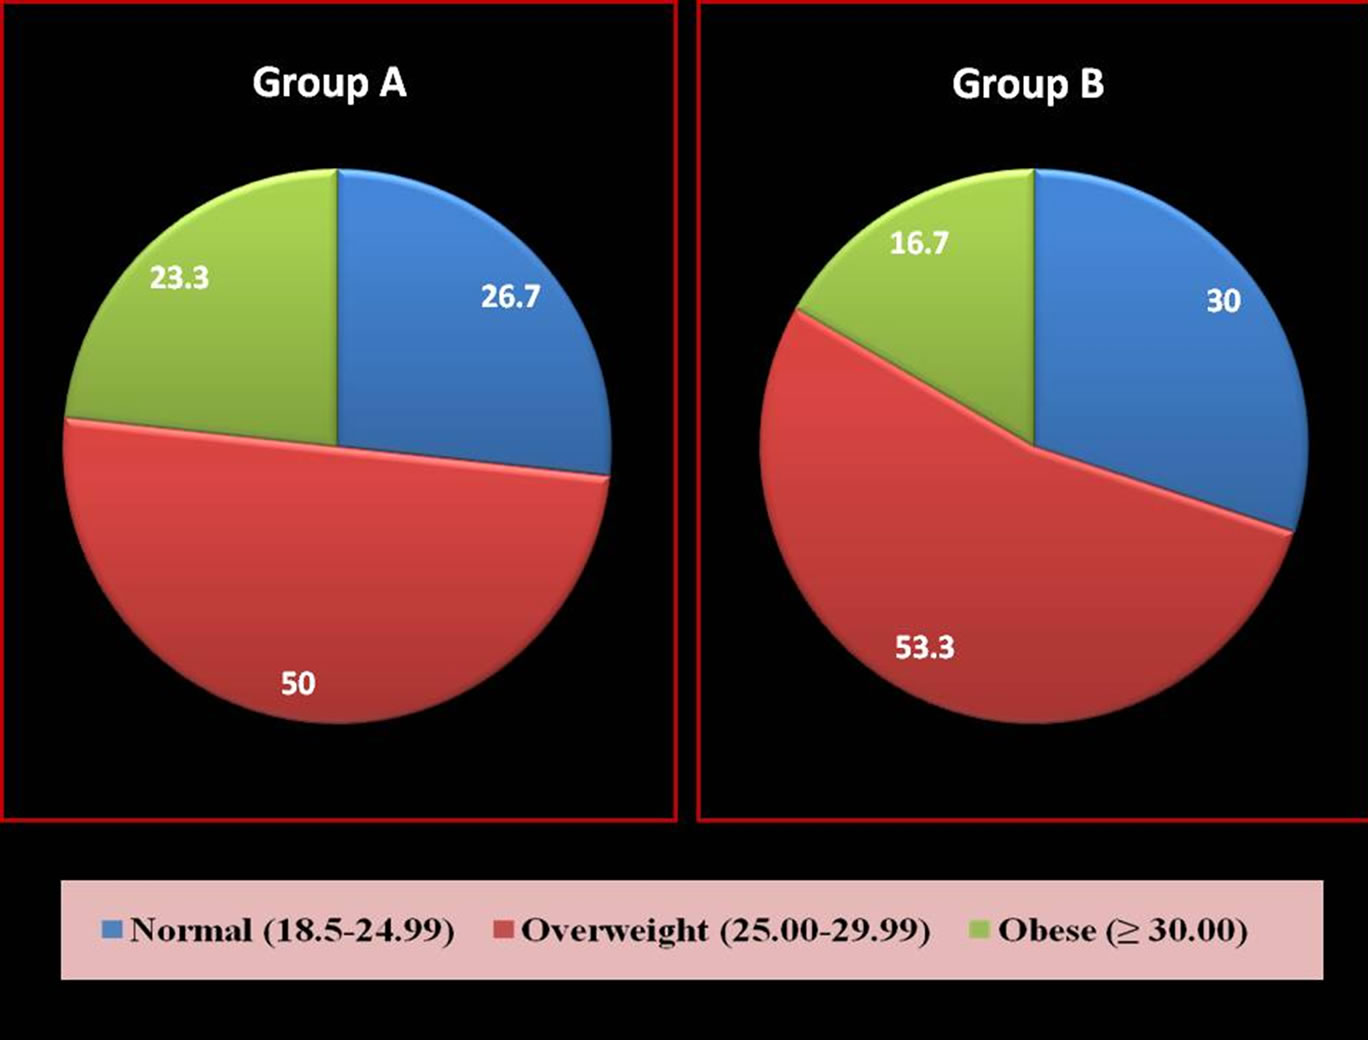
Figure 3. Distribution of subjects according to their body mass index (kg/m2).
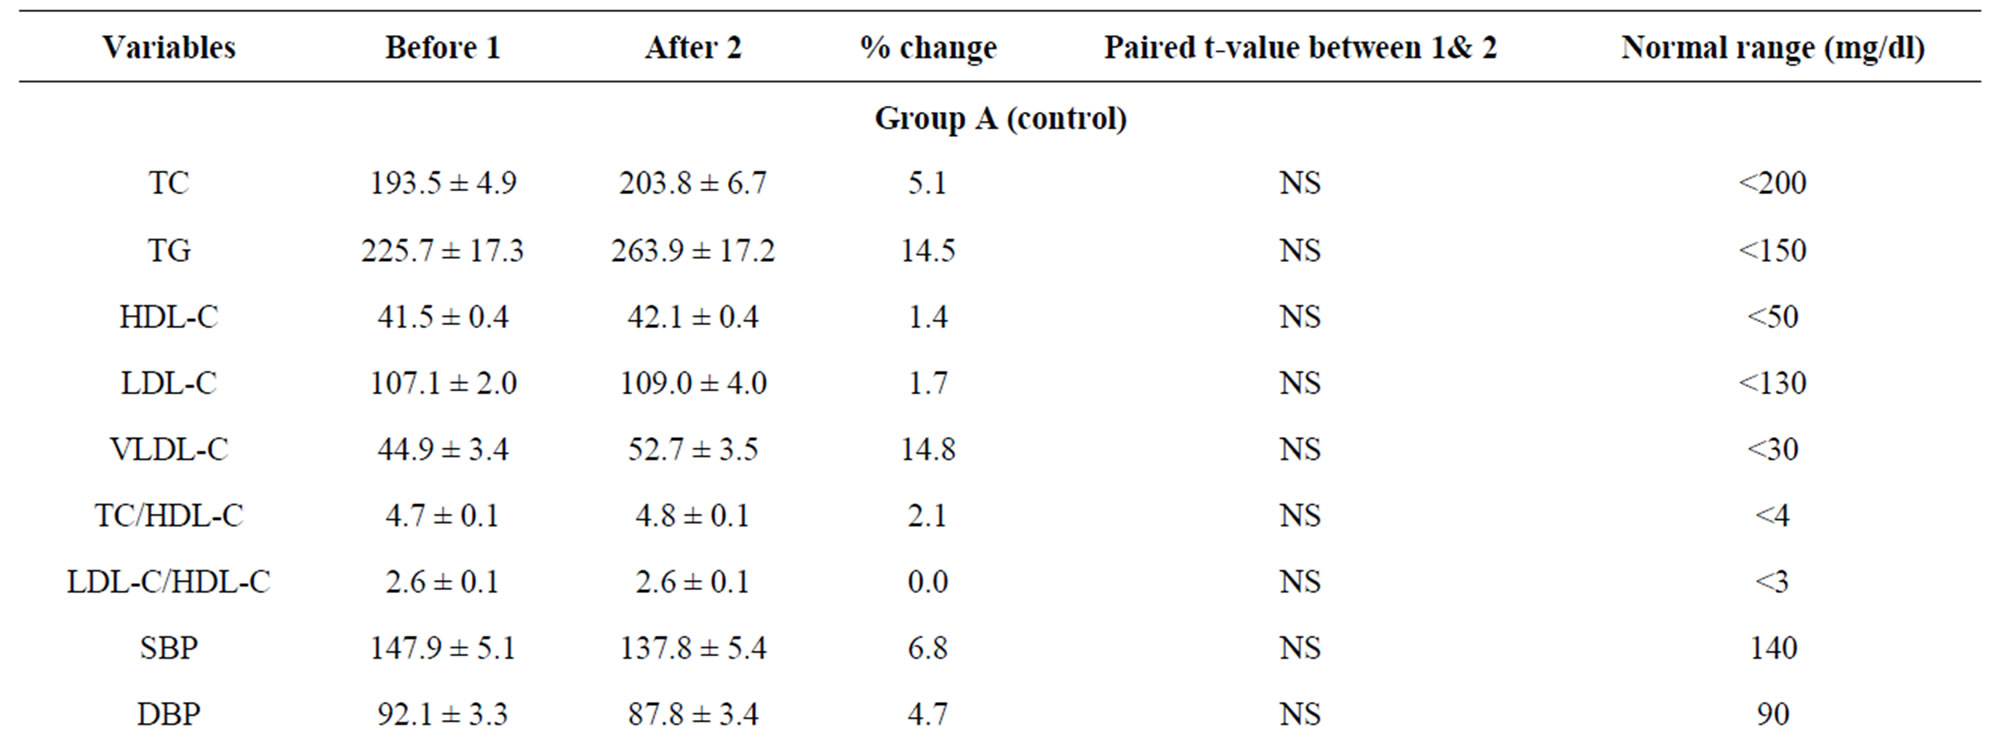
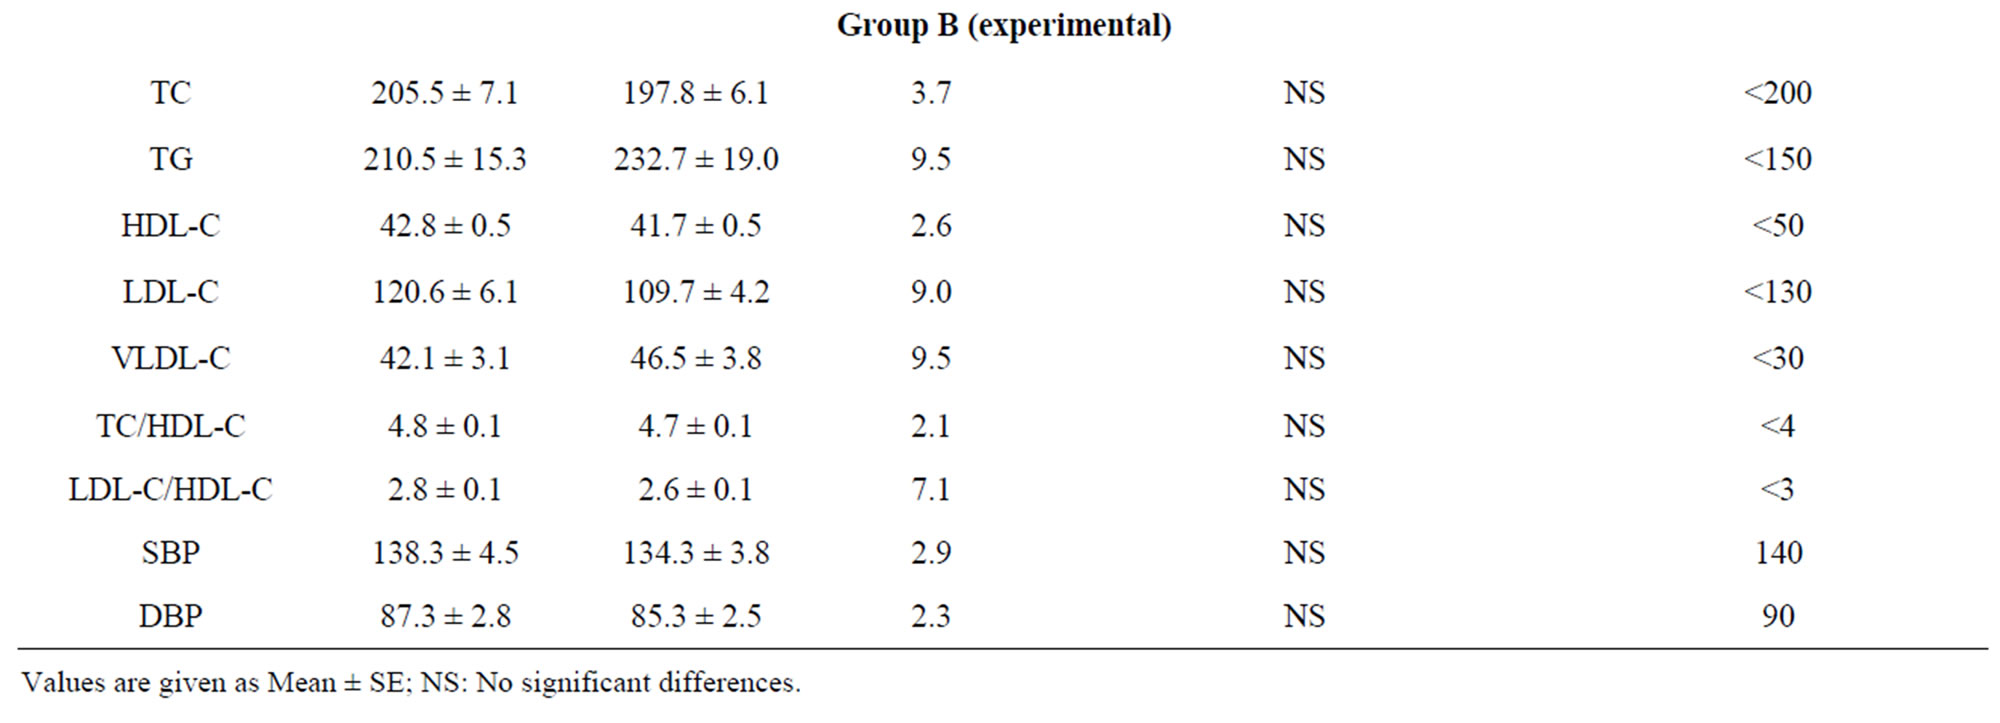
Table 6. Biochemical parameters of the selected subjects (n = 30).
after the study. It was found that the use of blended rice bran and olive oil (Group B) as the main cooking oil for a period of 45 days reduced the levels of TC and LDL-C by 3.7 and 9.0 percent respectively. The hypocholestrolaemic activity of blended oil could be due to the presence of oryzanol (2275.5 ppm) and oleic content (47.6%) of RBO + OO. Oryzanol may inhibit the absorption of cholesterol and may increase the faecal excretion of bile acids [27]. Oleic acid had been described to reduce the cardiovascular risk by reducing blood lipids, mainly cholesterol [28,29]. Our study has confirmed the results of previous studies, which demonstrated that RBO reduced the total cholesterol when used as the main cooking oil. However, the decline in serum cholesterol observed in the previous study after a period of 90 days 8 percent as compared to 3.7 percent in our study. Whereas, the levels of TG and VLDL-C increased by 9.5 percent in the subjects of Group B after the feeding trials. Indians worldwide have been shown to have a triad of high TGs with low HDL levels and high LDL levels [30]. These results were in contrast to the previous studies which showed 30 to 35 percent decline in TG levels. In addition, the amount of edible oil used by the subjects in the previous studies was mentioned as 35 - 39 g/day [31,32] whereas the corresponding figure in the present study was 45.0 g/day. In another study, fat contributed about 24 percent to the total energy as compared to the 31.4 percent contribution in our study. The ratio of LDL-C/HDL-C was recorded to be 2.6 which was in accordance with the suggested value (<3) given by the American Heart Association [33] but the ratio of TC/HDL-C (4.7) was higher than the recommendations (<4). Further, systolic and diastolic blood pressure of the subjects of Group B reduced by 2.9 and 2.3 percent respectively.
4. Conclusions
Our study showed that RBO+OO when was used as the main cooking oil had lipid lowering effects. The fatty acid composition (SFA:MUFA:PUFA) of the RBO + OO (1:2.5:1.7) along with the minor components (2525.0 ppm) of the unsaponifiable fraction may be acting synergistically to produce hypocholesterolaemic action, indicating that the hypocholesterolaemic activity of a dietary fat depends not only on fatty acid content of the oil, but also minor components of the unsaponifiable fractions. We did only one baseline estimation of lipids. We realize that to arrive at a mean value, sequential measurements of lipids are ideal and duration of the study should also be increased. The shortcoming of a single measurement is that there could be biological variations which could account for intra-individual variations.
In conclusion, RBO and OO have several advantages and health benefits, so blend of these oils can be used routinely as cooking oil. It could also help in preventing other family members from developing cardiovascular diseases. In our study, the oil was well accepted with good compliance. RBO is also a cheaper oil than other oils available in the market. So, blended rice bran and olive oil (70:30 with 2275.5 ppm oryzanol), in view of its hypolipidemic effect, could be considered beneficial for patients with lipid abnormalities as a means to maintain normal levels of lipids. It was a pilot study in which the blend of RBO and OO was used for the first time. So, more long duration research studies need to be carried out to evaluate the effectiveness of this blended oil.
5. Acknowledgements
We are thankful to the Tara Health Foods Limited (Sangrur, Punjab, India) for providing blended oil (RBO + OO) at free of cost for research purpose.
REFERENCES
- K. S. Reddy, “The Emerging Epidemic of Cardiovascular Disease in India,” In: P. Shetty and C. Gopalan, Eds., Diet, Nutrition and Chronic Disease: An Asian Perspective, Smith-Gordon, Bedford, 1998, pp. 50-54.
- S. A. Bhatnagar, K. P. Kumar, J. Hemavathy and G. A. Krishna, “Fatty Acid Composition, Oxidative Stability and Radical Scavenging Activity of Vegetable Oil Blends with Coconut Oil,” Journal of the American Oil Chemists’ Society, Vol. 86, No. 10, 2009, pp. 991-999.
- A. Kennedy, D. S. Menon and E. Suneetha, “Study on Effect of Rice Bran and Sunflower Oil Blend on Human Lipid Profile,” Indian Journal of Applied & Pure Biology, Vol. 25, No. 2, 2010, pp. 375-384.
- N. Frank, M. F. Andrews, B. S. Elliott, J. Lew and C. R. Boston, “Effects of Rice Bran Oil on Plasma Lipid Concentrations, Lipoprotein Composition, and Glucose Dynamics in Mares,” Journal of Animal Science, Vol. 83, No. 11, 2005, pp. 2509-2518.
- B. M. Siddique, A. Ahmed, H. M. Ibrahim, S. Hena, M. Rafatullah and A. K. Omar, “Physico-Chemical Properties of Blends of Palm Olein with Other Vegetable Oils,” Grasas Y Aceites, Vol. 61, No. 4, 2010, pp. 423-429. http://dx.doi.org/10.3989/gya.010710
- N. H. Khan, S. J. Khan, S. Ali, K. Hussain, S. M. Alam and A. Habib, “Development of Some New Micronutrient Rich Blends of Edible Vegetable Oils,” Current Botany, Vol. 2, No. 5, 2011, pp. 16-19.
- M. M. Most, R. Tulley, S. Morales and M. Lefevre, “Rice Bran Oil, Not Fiber, Lowers Cholesterol in Humans,” American Journal of Clinical Nutrition, Vol. 81, No. 1, 2005, pp. 64-68.
- R. Kusum, H. Bommayya, P. Fayaz and H. D. Ramachandran, “Palm Oil and Rice Bran Oil: Current Status and Future Prospects,” International Journal of Plant Physiology and Biochemistry, Vol. 3, No. 8, 2011, pp. 125-132.
- M. I. Covas, “Olive Oil and the Cardiovascular System,” Pharmacological Research, Vol. 55, No. 3, 2007, pp. 175-186. http://dx.doi.org/10.1016/j.phrs.2007.01.010
- R. Turner, N. Etienne and G. M. Alonso, “Antioxidant and Anti-Atherogenic Activities of Olive Oil Phenolics,” International Journal of Vitamin and Nutrition Research, Vol. 75, No. 1, 2005, pp. 61-70. http://dx.doi.org/10.1024/0300-9831.75.1.61
- M. Choudhary, K. Grover and G. Kaur, “Fatty Acid Composition, Oxidative Stability, and Radical Scavenging Activity of Rice Bran Oil Blends,” International Journal of Food and Nutritional Sciences, Vol. 2, No. 1, 2013, pp. 33-43.
- FAO, “Energy Costs of Activities,” In: Human Energy Requirements: Report of a Joint FAO/ WHO/UNU Expert Consultation, FAO Food and Nutrition Technical Report Series No. 1, FAO, Rome, 2004, pp. 92-96.
- Indian Council of Medical Research, “Nutrient Requirements and Recommended Dietary Allowances for Indians,” National Institute of Nutrition, Hyderabad, 2010.
- D. B. Jelliffe, “The Assessment of Nutritional Status of Community,” WHO, Geneva, 1966.
- P. Fossati and L. Principle, “Qualitative Determination of Triglycerides in Serum or Plasma by Enzymatic DHBC Colorimetric Method,” Clinical Chemistry, Vol. 28, No. 10, 1982, p. 2077.
- W. Richmond, “Qualitative Determination of Cholesterol in Serum or Plasma by Enzymatic Method,” Clinical Chemistry, Vol. 19, No. 12, 1973, p. 1350.
- M. F. Lopes-Virella, P. Stone, S. Ellis and J. A. Cohwel, “Qualitative Determination of HDL-Cholesterol in Serum or Plasma by Phospotungstate Method,” Clinical Chemistry, Vol. 23, No. 5, 1977, p. 882.
- W. T. Frieldwalds, R. I. Levy and D. S. Friedrickson, “Estimation of Plasma or Serum Low Density Lipoprotein Cholesterol Concentration without Use of Preparaline Ultracentrifuge,” Clinical Chemistry, Vol. 18, No. 6, 1972, p. 499.
- R. Kuriyan, N. Gopinath, M. Vaz and V. A. Kurpad, “Use of Rice Bran Oil in Patients with Hyperlipidemia,” The National Medical Journal of India, Vol. 18, No. 6, 2005, pp. 292-296.
- S. Johnson and N. Saikia, “Fatty Acids Profile of Edible Oils and Fats in India,” 2009, pp. 1-42.
- U. Goyal, B. Sadana and S. Verma, “Contribution of Various Foods to Fat and Fatty Acids Intake among Urban and Semi-Urban Women of Punjab,” Journal of Human Ecology, Vol. 18, No. 3, 2005, pp. 217-220.
- P. M. Vijaylaxmi, B. Kasturiba, K. R. Naik and U. Malagi, “Influence of Fats and Oils Intake on the Lipid Profile of Adults Belonging to Different Income Groups,” Karnataka Journal of Agricultural Sciences, Vol. 20, No. 1, 2007, pp. 112-114.
- A. R. Kaur, M. Nagi and T. Gulati, “Lipid Profile in Relation to Type and Adequacy of Fat Consumed by Adult Punjabi Males: A Case Study,” Journal of Research, Punjab Agricultural University, Vol. 45, No. 1-2, 2008, pp. 91-95.
- WHO Expert Consultant, “Appropriate Body-Mass Index for Asian Population and Its Implications for Policy and Intervention Strategies,” The Lancet, Vol. 363, No. 9403, 2004, pp. 157-163. http://dx.doi.org/10.1016/S0140-6736(03)15268-3
- Y. Ma, W. Li, B. C. Olendzki, S. L. Pagoto, P. A. Merriam, D. E. Chiriboga, J. A. Griffith, J. Bodenlos, Y. Wang and I. S. Ockene, “Dietary Quality 1 Year after Diagnosis of Coronary Heart Disease,” Journal of the American Dietetic Association, Vol. 108, No. 2, 2008, pp. 240-246. http://dx.doi.org/10.1016/j.jada.2007.10.047
- Ghafoorunissa and K. Krishnaswamy, “Dietary Prescriptions,” In: Diet and Heart Diseases, 2007, pp. 21-37.
- A. Berger, D. Rein, A. Schäfer, I. Monnard, G. Gremaud, P. Lambelet and C. Bertoli, “Similar Cholesterol-Lowering Properties of Rice Bran Oil, with Varied GammaOryzanol, in Mildly Hypercholesterolemic Men,” European Journal of Nutrition, Vol. 44, No. 3, 2005, pp. 163- 173. http://dx.doi.org/10.1007/s00394-004-0508-9
- E. Lopez-Huertas, “Health Effects of Oleic Acid and Long Chain Omega-3 Fatty Acids (EPA and DHA) Enriched Milks. A Review of Intervention Studies,” Pharmacological Research, Vol. 61, No. 3, 2010, pp. 200-207. http://dx.doi.org/10.1016/j.phrs.2009.10.007
- A. M.Stephens, L. L. Dean, J. P. Davis, J. A. Osborne and T. H. Sanders, “Peanuts, Peanut Oil, and Fat Free Peanut Flour Reduced Cardiovascular Disease Risk Factors and the Development of Atherosclerosis in Syrian Golden Hamsters,” Journal of Food Science, Vol. 75, No. 4, 2010, pp. 116-122. http://dx.doi.org/10.1111/j.1750-3841.2010.01569.x
- H. S. Rissam, S. Kishore and N. Trehan, “Coronary Heart Disease in Young Indians—The Missing Link,” Indian Academy of Clinical Medicine, Vol. 2, No. 3, 2001, pp. 128-132.
- C. Rukmini and T. C. Raghuram, “Nutritional and Biochemical Aspects of the Hypolipidemic Action of Rice Bran Oil: A Review,” Journal of American College of Nutrition, Vol. 10, No. 6, 1991, pp. 593-601. http://dx.doi.org/10.1080/07315724.1991.10718181
- T. C. Raghuram and C. Rukmini, “Nutritional Significance of Rice Bran Oil,” Indian Journal of Medical Research, Vol. 102, Special Issue, 1995, pp. 241-244.
- AHA, “Cholesterol Ratio—American Heart Association,” 2004. http://www.americanheart.org

