Food and Nutrition Sciences
Vol. 2 No. 2 (2011) , Article ID: 4520 , 4 pages DOI:10.4236/fns.2011.22008
The Total Amount of Energy Delivered by a Brazilian Hospital Catering does not Meet Patient Requirements as Measured by Indirect Calorimetry
![]()
1Departamento de Clínica Médica, Faculdade de Medicina de Ribeirão Preto/USP, Brazil; 2Hospital das Clínicas, Faculdade de Medicina de Ribeirão Preto/USP, Brazil.
E-mail: carla@fmrp.usp.br
Received February 3rd, 2011; revised February 16th, 2011; accepted March 1st, 2011.
Keywords: Hospital Diet, Nutritional Needs, Indirect Calorimetry, Hospitalized Patients
ABSTRACT
The literature is controversial regarding the dietary recommendations for hospitalized patients in Brazil. Objective: We aimed to determine whether the energy content of the diet for hospitalized patients met their energy requirements measured by indirect calorimetry. Methods: Cross-sectional study conducted on adult hospitalized patients of both sexes. The prescription food was checked by reading the charts. Nutritional status was evaluated on the basis of weight, abdominal circumference (AbC), arm circumference (AC), body mass index and waist/hip ratio (WHR). The resting energy requirements of the patients were determined by indirect calorimetry. The diets offered were collected on 3 random non-consecutive days. Total nitrogen, lipid, water, ash and carbohydrate content of the menus were determined. Patients receiving a standard or low-sodium diet by the oral route participated in the study. The Student T test was used to analyze the differences in energy expenditure between individuals. The association between gender and percent adequacy of the diet was calculated by the Fisher exact test. The level of significance was set at p < 0.05. Results: We studied 46 adult patients of both genders (29 women and 17 men) aged 45 ± 16 years. Anthropometric evaluation revealed a mean weight of 72 ± 26 kg, BMI of 28 ± 10 kg/m2. 78% of the patients received energy above their requirements, with this value increasing to 82% when obese patients were excluded. Conclusion: Since the hospital diet is an important and often vital resource for the recovery of patients and in view of the high prevalence of undernutrition or obesity, it is fundamental to adjust it to the intra-hospital reality.
1. Introduction
The hospital diet, as part of the care provided to the patients, should include qualities and functions that satisfy the nutritional requirements of the users. To this end, it is of fundamental importance to be aware of the characteristics of the users in order to satisfy their nutrient and energy requirements. The Catering and Nutrition Unit (CNU) must rigorously control the entire process involved in the offer of food to hospitalized patients [1].
Considering aspects ranging from prescription of the diet to its distribution and acceptance and the clinical course of the patient, standardization of the diets is fundamental within a hospital institution. Its objectives are to provide an adequate nutrient supply, to facilitate communication among the professionals, to reduce the possibility of errors, and to increase the agility of the service [2]. The menus elaborated should be balanced in order to satisfy the energy and nutrient requirements of the patients [3]. Several aspects should be considered when planning menus, such as sensory ones (food combination, type of food and processing technique, colors, flavors and textures), production elements (number of operators, and preparation techniques) and infrastructure (equipment and utensils and working conditions), as well as the nutritional profile of the clientele [4].
In general, at our institution, a standard diet is considered to be a diet that provides about 2000 kcal, 80 g proteins, and macroand micronutrients according to daily recommended ingestion. The diet is divided into five or six meals a day, varying according to presentation and/or composition. However, there are no recommendations in the literature for hospitalized Brazilian individuals. Thus, in view of the large number of hospitalized patients with a compromised nutritional status, it is necessary to be aware of this reality and to propose a model that will satisfy the demands of the patients and contribute to the quality of hospital care [5,6]. On the other hand, there is also a high rate of food wastage which contributes to the increased costs of hospitalization [7,8].
On this basis, the objective of the present study was to determine whether the energy content of the diet prescribed for hospitalized patients met their energy requirements measured by indirect calorimetry. Therefore, the present study did not intend to assess the dietary intake of the patients, but rather to investigate whether the Nutrition and Dietetics Service offers adequate amounts of calories and macronutrients for the nutritional requirements of the clientele.
2. Methods
2.1. Patients
The study included adult patients of both genders, hospitalized on different wards of the university hospital. Receiving a standard diet or low sodium diet according to the medical prescription was the inclusion criterion and no selection was made according to the underlying disease. The sample was non-probabilistic by convenience, with patients who received one of the diets mentioned above. Patients receiving special diets through a tube or catheter and patients on a specific feeding regimen were excluded. The study was approved by the Research Ethics Committee of the hospital and all patients gave written informed consent to participate.
Dietary prescription was verified using the total dietary chart. Only the standard and low-sodium diets were considered for the study since they both contain the same amounts of energy and macronutrients, only differing in terms of sodium content. In addition, the remaining diets offered by the hospital are quite different and most of the patients admitted to this institution receive the standard diet.
Approximately 16% of the hospitalized patients were selected and submitted to evaluation of nutritional status and to indirect calorimetry for the determination of their energy requirements.
The availability of physical conditions for the exam was a decisive factor for sample selection.
The meals offered by the CNU were analyzed and compared to the nutritional requirements of the patients for later adjustment and standardization.
2.2. Anthropometric Assessment
Nutritional status was evaluated by measuring weight, height, abdominal circumference (AbC) and arm circumference (AC), and body mass index and waist/hip ratio (WHR) were calculated. All measurements were performed only once. The time of hospitalization was not considered.
2.3. Body Composition Assessment
Body composition was determined by Bioelectrical Impedance using a model Quantum BIA 101 Q apparatus (RJL Systems).
2.4. Determination of Energy Requirements
The resting energy requirements of the patients were determined by measuring VO2 and VCO2 by indirect calorimetry after a 12 hour fast, at room temperature and with the patient awake, as recommended by Warlich et al. (2001). A Sensor Medics instrument (Yorba, Linda, CA, USA) was used. The resting energy expenditure was determined by the Weir equation: energy expenditure = 3.491 VCO2 (L/min) + 1.106 VO2 (L/min), expressed as kcal/min [9,10].
All patients included in the study were bedridden and none of them practiced physical activities inside the hospital. Thus, only the energy equivalent to basal expenditure was considered for the study, with the physical activity factor being excluded from the calculations.
2.5. Analysis of Diet Composition
Samples of the meals offered to the patients were collected from the Nutrition and Dietetics Service of the hospital for analysis. The foods of the standard diet offered were collected on 3 random non-consecutive days, weighed and divided according to day and meal, for a total of 18 meals (6 meals/day: breakfast, morning snack, lunch, afternoon snack, dinner, and supper).
Total nitrogen, lipid, water, ash and carbohydrate content of the menus were determined [11]. Initially, moisture was determined by direct sample drying in an oven at 105˚C. After direct sample drying for moisture determination, the ash was obtained by the method of residue incineration. The protein content was determined by the micro-Kjeldahl method, the lipid content by the BlighDyer method, and the total carbohydrates by the difference between macronutrients [12].
The total energy content of the menu was determined by the sum of the carbohydrate, lipid and protein calories, considering that 1 g carbohydrate = 4 kcal, 1 g protein = 4 kcal and 1 g lipid = 9 kcal.
2.6. Adequacy of the Diet
The energy supply was analyzed by comparing it to the energy expenditure of the patient measured by indirect calorimetry. The supply was considered to be adequate when the subjects received 90 to 110% of their requirements and inadequate when they received less than 90% or more than 110% of their requirements.
2.7. Statistical Analysis
Data are reported as means + SD. We conducted a descriptive statistical analysis of the data. The STATA software (StataCorp. 2005. Stata Statistical Software: Release 9. College Station, TX: StataCorp LP) [13] was used for data analysis. The Student T test was used to analyze the differences in energy expenditure between individuals. The association between gender and percent adequacy of the diet was calculated by the Fisher exact test. The level of significance was set at p < 0.05.
3. Results
We studied 46 adult patients of both genders (29 women and 17 men) aged 45 ± 16 years. The major reasons for hospitalization were orthopedic and gastrointestinal problems, hypertension, diabetes mellitus, and cardiac and respiratory problems. Anthropometric and body composition data are shown in Table 1.
4.4% of the subjects had a BMI < 18.4 kg/m2, 44.4% a BMI of 18.4 to 24.9 kg/m2, 27% a BMI of 25 to 29.9 kg/m2, and 24.2% a BMI > 30 kg/m2, with 2% presenting grade II obesity (BMI between 30 and 34.9 kg/m2) and 9% presenting grade III obesity (BMI > 40 kg/m2).
AbC values were within recommended limits in 14% of the women and in 64% of the men (males: <94 cm and females: <80 cm—OMS, 1998) [14]. Regarding body composition, 89% of the patients (34% of the men and 66% of the women) had body fat values above normal levels (males: 15 to 25% and females: 23 to 32%—Lohman, 1991). [15]
Figure 1 shows the values of energy expenditure for the sample. Obese and non-obese patients were analyzed separately because it is believed that obese patients have a higher energy expenditure due to the increased lean mass necessary to sustain fat mass. No difference in energy expenditure was observed between the obese and non-obese groups.
Laboratory analysis of centesimal diet composition showed that the diet provided, on average, 1824 ± 187 kcal/day, with 25% protein, 25% lipids and 51% carbo hydrates. Analysis of the calorie supply per meal showed
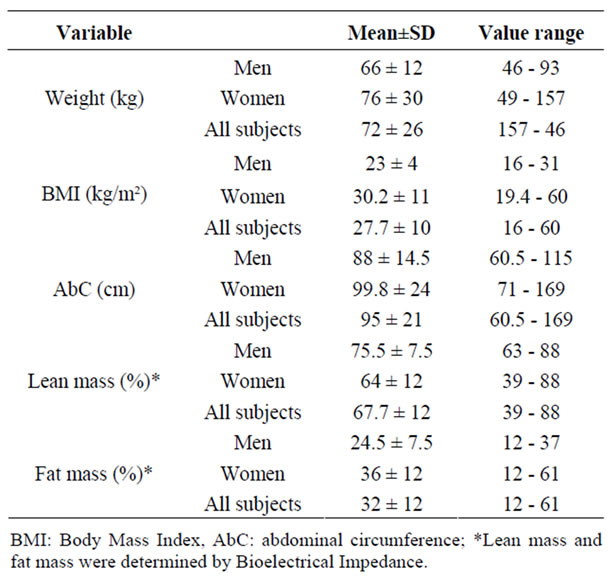
Table 1. Anthropometric assessment (weight, BMI, AbC, lean mass and fat mass) of the sample.
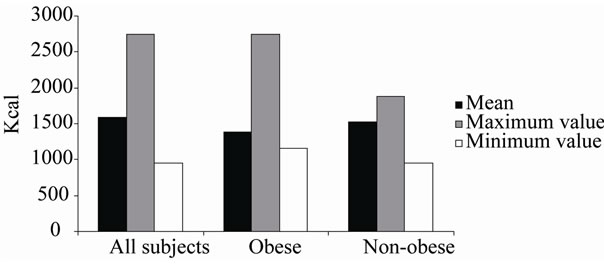
Figure 1. Indirect calorimetry values for the sample as a whole, for obese patients (BMI > 30 kg/m²) and for nonobese patients (BMI < 30 kg/m²).
that breakfast provided approximately 287 ± 37 kcal (16% of the total calorie value, TCV), the morning snack 43 ± 10 kcal (2% of TCV), lunch 547 ± 87 kcal (30% of TCV), the afternoon snack 91 ± 76 kcal (5.01% of TCV), dinner 611 ± 104 kcal (34% of TCV), and supper 245 ± 28 kcal (13% of TCV).
The percent adequacy of the diet (ratio between the calories offered and the energy expenditure of the subjects) ranged from 66 to 191%. The range for the sample of non-obese patients was 98% to 191%. Thus, 78% of patients received energy above their requirements, and this percentage reached 82% in non-obese patients.
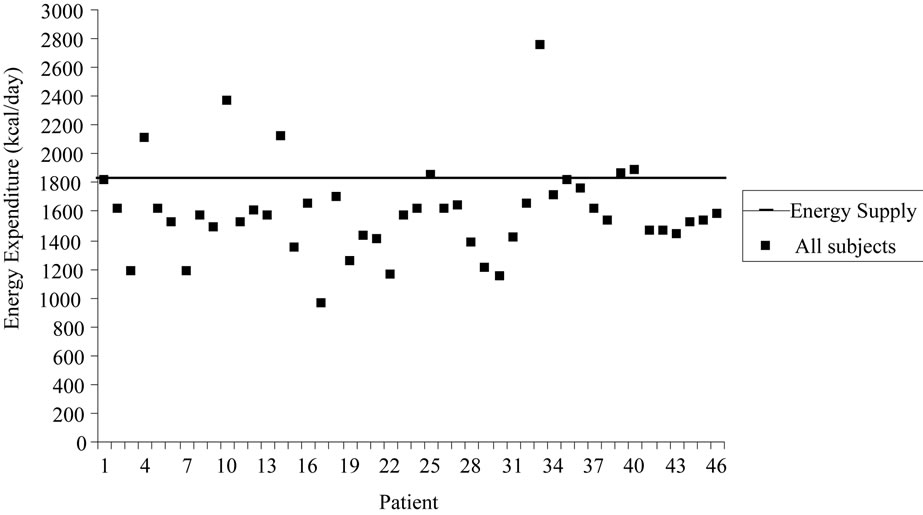
Figure 2 illustrates individual data for energy expenditure and dietary energy supply (1824 kcal/day) for all patients studied (a) and for non-obese patients (b). It can be seen that the energy supplied by the diet covers the requirements of most patients, especially when obese individuals are excluded from the analysis (b). The mean
 (a)
(a)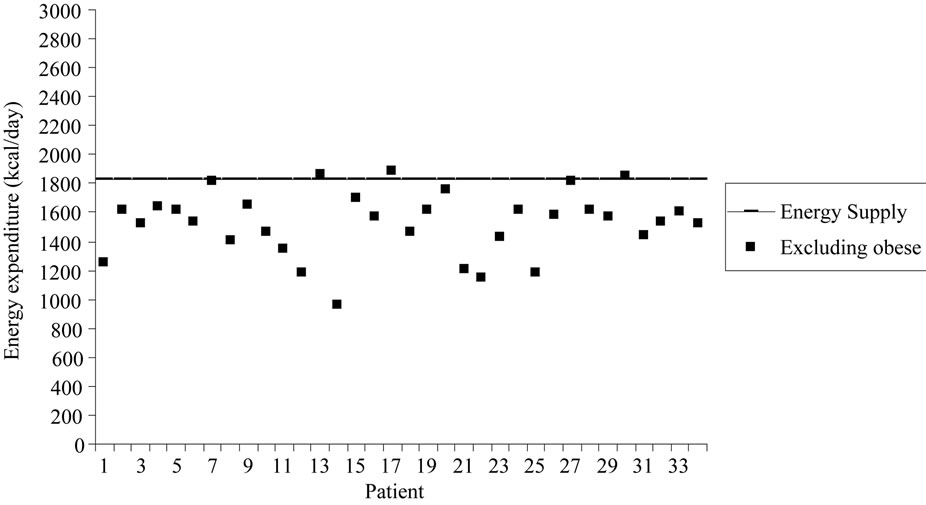 (b)
(b)
Figure 2. Subject distribution according to energy expenditure. a = All subjects; b = non-obeses patients (obese subjects were excluded). The continuous line represents the calorie supply provided by the diet (1824 kcal).
difference between the calorimetry value and the value supplied by the diet was –232 ± 318 kcal for the sample as a whole and –294.6 ± 222.5 kcal for non-obese patients, showing that the diet offered a calorie supply exceeding the energy expenditure of the patients.
When the percent adequacy of the diet was compared between genders, there was a statistically significant difference between adequacy of the diet offered and the energy expenditure of the patients (p < 0.01), which was also present when obese individuals were excluded (p < 0.01) (Figure 3).
4. Discussion
In the present study we detected 51% excess weight and 4% undernutrition among the patients investigated according to anthropometric measures, and a higher prevalence among women (38%) than men (13%). However, malnutrition within the hospital environment has been reported to affect 30 to 50% of the patients, varying according to the population investigated and the different criteria used [16,17]. Other studies have demonstrated that 20 to 60% of hospitalized patients present some degree of malnutrition [18,19].
The occurrence of the complications of obesity depends not only on excess weight but also on body fat distribution [20]. Today we know that abdominal localization of fat (central obesity) is more associated with metabolic disorders and with cardiovascular risk [21].
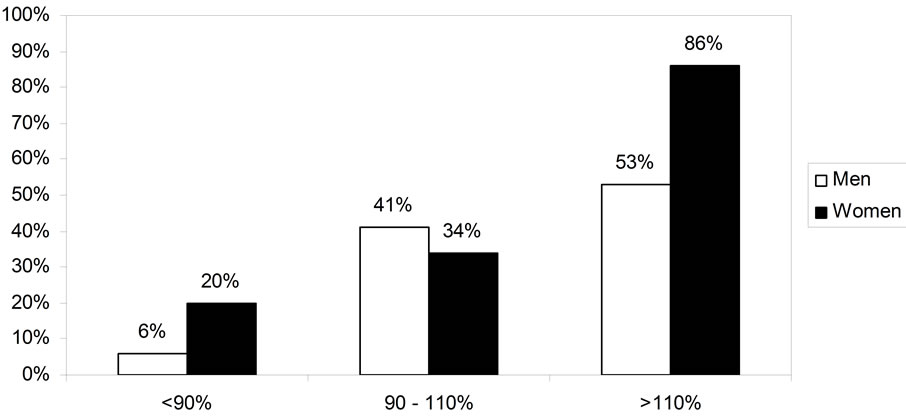
Figure 3. Gender comparison of percent (%) diet adequacy.
Regarding the anthropometric findings, the mean AbC values of the women under study were above recommended borderline levels, representing a very high risk for the metabolic complications associated with obesity, whereas this risk was not observed in men [22]. It should be pointed out that analysis of body composition revealed amounts of fat above recommended levels for both genders, contributing to the risk of diseases associated with obesity.
The goal of a hospital CNU is to provide a balanced diet that satisfies the nutritional needs of the patients, contributing to the improvement of their nutritional status. In the present study, the hospital diet proved to be inadequate for most patients in terms of calorie supply, which exceeded the daily requirements in 78% of the patients. The energy expenditure of obese patients is greater than that of other subjects [23,24]; when they were excluded, excess calories were offered to 82% of the patients. Dupertuis et al. (2003) [25] demonstrated that daily hospital meals provided 2007 ± 479 kcal per day and exceeded the requirements of the patients by 41%.
Analysis of percent macronutrient distribution in the diet and comparison with recommended intake (Dietary Reference Intakes, 2003) [26] revealed an adequate distribution since the data were within recommended ranges (20 to 35% for lipids, 10 to 35% for protein and 45 to 65% for carbohydrates).
According to Fausto (2003) [27], the calorie distribution per meal should be 20% for breakfast, 5% for the morning snack, 35% for lunch, 5% for the afternoon snack, 30% for dinner, and 5% for supper. In the diet analyzed here, only the afternoon snack and lunch were within these recommendations, whereas breakfast and the morning snack (morning meals) were below the recommendations and dinner and supper (night meals) were above them.
Considering the nutritional transition currently experienced by the Brazilian population and the comorbidities related to obesity, the excessive offer of calories to the patients studied here may contribute to a worsening of their nutritional status and thus to the development and/or aggravation of correlated diseases.
5. Conclusions
There is no consensus in the literature about the energy recommendations for hospitalized patients, and in most cases the standard diet offered is based on the needs of healthy individuals. The present results show that the diet offered at our institution does not satisfy the energy requirements of large part of the patients. In addition, a high prevalence of obesity and overweight was observed, reflecting the change in the epidemiological profile of the population. Since the diet is part of the treatment, it should be appropriate for the profile of the population attended.
REFERENCES
- S. Iff, M. Leuenberger, S. Rosch, G. Knecht, B. Tanner and Z. Stanga, “Meeting the Nutritional Requirements of Hospitalized Patients: An Interdisciplinary Approach to Hospital Catering,” Clinical Nutrition, Vol. 27, No. 6, 2008, pp. 800-805. doi:10.1016/j.clnu.2008.07.008
- A. Oliveira, L. P. Vieira, M. R. C. Albano and V. B. C. Molina, “Padronização de dietas,” In: M Isosaki and E Cardoso, Eds., Manual de dietoterapia e avaliação nutricional. Serviço de nutrição e dietética do Instituto do Coração-HCFMUSP. São Paulo: Atheneu, 2004.
- H. Vannucchi, E. W. Menezes, A. O. Campana and F. M. Lajolo, “Aplicações das recomendações nutricionais adaptadas à população brasileira,” Ribeirao Preto: Legis Suma/ Socie-dade Brasileira de Alimentação e Nutrição, 1990.
- L. M. Donini, E. Castellaneta, S. De Guglielmi, M. R. De Felice, C. Savina, C. Coletti, M. Paolini and C. Cannella, “Improvement in the Quality of the Catering Service of a Rehabilitation Hospital,” Clinical Nutrition, Vol. 271, 2008, pp. 105-114. doi:10.1016/j.clnu.2007.10.004
- Y. M. Dupertuis, M. P. Kossovsky, U. G. Kyle, C. A. Raguso, L. Genton and C. Pichard, “Food Intake in 1707 Hospitalised Patients: A Prospective Comprehensive Hospital Survey,” Clinical Nutrition, Vol. 22, No. 2, 2003, pp. 115-123. doi:10.1054/clnu.2002.0623
- J. Kondrup, N. Johansen, L. M. Plum, L. Bak, I. H. Larsen, A. Martinsen, J. R. Andersen, H. Baernthsen, E. Bunch and N. Lauesen, “Incidence of Nutritional Risk and Causes of Inadequate Nutritional Care in Hospitals,” Clinical Nutrition, Vol. 21, No. 6, 2002, pp. 461-468. doi:10.1054/clnu.2002.0585
- C. B. Nonino-Borges, E. I. Rabito, K. Silva, C. A. Ferraz, P. G. Chiarello, J. S., Santos and J. S. Marchini, “Desperdício de alimentos intra-hospitalar,” Rev Nut, Vol. 19, No. 3, 2006, pp. 349-356.
- A. D. Barton, C. L. Beigg, I. A. Macdonal and S. P. Allison, “High Food Wastage and Low Nutritional Intakes in Hospital Patients,” Clinical Nutrition, Vol. 19, No. 6, 2000, pp. 445-449. doi:10.1054/clnu.2000.0150
- J. B. Weir, “New Methods for Calculating Metabolic Rate with Special Reference to Protein Metabolism,” Journal of Physiology, Vol. 109, 1949, pp. 1-9.
- V. M. Suen, G. A. Silva, A. F. Tannus, M. R. Unamuno, J. S. Marchini, “Effect of Hypocaloric Meals with Different Macronutrient Compositions on Energy Metabolism and Lung Function in Obese Women,” Nutrition, Vol.19, 2003, pp. 703-707. doi:10.1016/S0899-9007(03)00104-7
- INSTITUTO ADOLFO LUTZ, “Métodos químicos e físicos para análise de alimentos,” Normas Analíticas do Instituto Adolfo Lutz, Vol. 1, São Paulo: IMESP, 2007.
- A. G. Cruz, A. S. Sant’Ana, M. M. Macchione, A. M. Teixeira and F. L. Schimidt, “Milk Drink Using Whey Butter Cheese (Queijo Manteiga) and Acerola Luice as A Potential Source of Vitamin C,” Food Bioprocess Technology, Vol. 2, 2009, pp. 368-373. doi:10.1007/s11947-008-0059-9
- D. Cope, “Fundamentals of Statistical Analysis,” Foundation Press, 2005.
- World Health Organization, “Physical Status: The Use and Interpretation of Anthropometry,” Geneva: World Health Organization, 1995. (WHO Technical Report Series, 854).
- T. G. Lohman, “Anthropometric Standardization Reference Manual,” Ilinois, Human Kinetics, 1991.
- D. L. Waitzberg and M. I. Correia, “Nutritional Assessment in the Hospitalized Patient,” Current Opinion in Clinical Nutrition & Metabolic Care, Vol. 6, 2003, pp. 531-538. doi:10.1097/00075197-200309000-00006
- D. L. Waitzberg, T. Waleska, M. D. Caiaffa and I. T. D. Correia, “Hospital Malnutrition: The Brazilian National Survey (IBRANUTRI): A Study of 4000 Patients,” Nutrition, Vol. 17, No. 7-8, 2001, pp. 553-580.
- H. Sungurtekin, U. Sungurtekin, V. Hanci and E. Erdem, “Comparison of Two Nutrition Assessment Techniques in Hospitalized Patients,” Nutrition, Vol. 20, No. 5, 2004, pp. 428-432. doi:10.1016/j.nut.2004.01.006
- P. Ravasco, M. E. Camilo, A. Gouveia-Oliveira, S. Adam and G. Brum, “A Critical Approach to Nutritional Assessment in Critically Ill Patients,” Clinical Nutrition, Vol. 21, 2002, pp. 73-77. doi:10.1054/clnu.2001.0508
- H. Hauner, “Abdominal Obesity and Coronary Heart Disease: Pathophysiology and Clinical Significance,” Herz Munchen, Vol. 20, 1995, pp. 47-55.
- G. Carneiro, A. Faria, F. F. Ribeiro, A. Guimarães, D. Lerário, R. G. Ferreira and M. T. Zanella, “Influência da distribuição da gordura corporal sobre a prevalência de hipertensão arterial e outros fatores de risco cardiovascular em indivíduos obesos,” Rev Saúde Pública, Vol. 36, 2002, pp. 4-11.
- World Health Organization, “Obesity: Preventing and Managing the Global Epidemic,” Geneva: World Health Organization, 1998. (WHO Technical Report Series 894).
- C. M. Melo, J. Tirapegui and S. M. Ribeiro, “Gasto Energético Corporal: Conceitos, Formas de Avaliação e sua Relação com a Obesidade,” Arquivos Brasileiros de Endocrinologia & Metabologia, Vol. 52, No. 3, 2008, pp. 452-464.
- E. Ravussin, S. Lillioja, W. C. Knowler, L. Christin, D. Freymond, W. G. Abbott, V. Boyce, B. V. Howard and C. Bogardus, “Reduced Rate of Energy Expenditure as a Risk Factor for Body-Weight Gain,” New England Journal of Medicine, Vol. 318, No. 8, 1988, pp. 467-472. doi:10.1056/NEJM198802253180802
- Y. M. Dupertuis, M. P. Kossovsky, U. G. Kyle, C. A. Raguso, L. Genton and C. Pichard, “Food Intake in Hospitalized Patients: A Prospective Comprehensive Hospital Survey,” Clinical Nutrition, Vol. 22, 2003, pp. 115-123. doi:10.1054/clnu.2002.0623
- Dietary Reference Intakes, 2003.
- M. A. Fausto, “Planejamento de dietas e da alimentação,” 4th Edition. Rio de Janeiro: Revinter, 2003.