Graphene
Vol.05 No.01(2016), Article ID:62926,11 pages
10.4236/graphene.2016.51002
Experimental Investigation of the Effect of Graphene Nanosheets on the Optical-Electrical Properties of Vanadium Oxide Nanocomposites
Issam Derkaoui1, Mohammed Khenfouch2,3*, Ibrahim Elmokri1, Sabata Jonas Moloi4, Bakang Moses Mothudi4, Mokhotjwa Simon Dhlamini4, Malik Maaza2,3, Izeddine Zorkani1, Anouar Jorio1
1Group of Nanomaterials and Renewable Energies, Laboratory of Solid State Physics, Faculty of Sciences Dharel Mahraz, University Sidi Mohamed Ben Abdellah, Atlas Fez, Morocco
2UNESCO-UNISA Africa Chair in Nanosciences-Nanotechnology, College of Graduate Studies, University of South Africa, Pretoria, South Africa
3Nanosciences African Network (NANOAFNET), iThemba LABS-National Research Foundation, Somerset West, Western Cape, South Africa
4Physics Department, College of Science, Engineering and Technology Science Campus, University of South Africa, Johannesburg, South Africa

Copyright © 2016 by authors and Scientific Research Publishing Inc.
This work is licensed under the Creative Commons Attribution International License (CC BY).
http://creativecommons.org/licenses/by/4.0/


Received 26 November 2015; accepted 18 January 2016; published 21 January 2016
ABSTRACT
We report the structural, optical and electrical properties of Graphene-Vanadium oxide nanoparticles (rGO/VO-NPs) nanocomposites prepared via a hydrothermal method on glass substrates. The samples have been characterized by X-ray diffraction (XRD), transmission electron microscopy (TEM), Fourier transform infrared spectroscopy (ATR-FTIR), Raman spectroscopy, ultraviolet-visible spectra (Uv-Vis) (absorbance/reflectance) and electrical conductivity. Our results are revealing a remarkable effect on the morphology and structure of vanadium oxide nanoparticles. Hence, the graphene layers improved their electrical conductivity and highly influenced their optical properties. Therefore, the obtained results may lead to better performance for a large field of applications.
Keywords:
Vanadium Oxide, Graphene, Optical Properties, Electrical Conductivity, Nanorods

1. Introduction
In the light of previous reports, graphene-Vanadium oxide composites have attracted extensive attention for their potential applications in energy-related areas. However, graphene sheets decorated with metal oxide NPs combine the outstanding properties of them and might result in some particular properties because of the synergetic effect between them. Hence, the dispersion of these metal oxide nanomaterials onto graphene nanosheets surfaces could not only prevent the aggregation or combine their properties but also provide additional novel properties due to the interaction between the NPs and graphene [1] [2] . Moreover, some studies have shown that integration of metal oxides in graphene matrix leads to an increase in stability. This occurs because graphene acts as a buffer layer and suppresses huge volume variations thus preventing aggregation and loss of surface area [3] . At the same time, the development of graphene-based composites provides an important milestone to improve the application performance of metal oxide nanomaterials in different fields such as electrocatalysts [4] , lithium ion battery electrodes [5] and photovoltaic devices [6] .
It should be noted that Graphene, a two-dimensional (2D) monolayer of carbon atoms is arranged in a honeycomb network. It is a zero band gap semiconductor with very high electrical conductivity, flexibility and the large surface area has been explored as an ideal substrate to host nanomaterials [7] [8] . In addition, nanostructured metal oxides with different morphologies especially One-dimensional (1D) nanostructures, such as nanowires, nanorods and nanobelts, have attracted considerable attention due to their specific physical and chemical properties [9] [10] . In this category, vanadium oxide is one of the promising nanomaterials.
To the best of our knowledge, there are few reports devoted to the synthesis of graphene-Vanadium oxides composites. However, some graphene-Vanadium oxides hybrid materials such as N-doped graphene-VO2 nanosheet for lithium-ionbattery [11] , Fe3O4/VOx/graphene [12] , silver/vanadium-oxide/grapheme [13] and Graphene- VO2 film with enhanced optical response [14] , have been investigated following many synthesis methods like sol-gel, atomic layer deposition, hydrothermal and several ones. Therefore, the hydrothermal route for synthesizing graphene composites is particularly successful in terms of controlling the particle shape, chemical composition, and crystallite size in a simple and inexpensive way [15] . The reduced graphene oxide (rGO) was employed to improve the electronic conductivity and electrochemical performance of vanadium oxides nanoparticles. The use of these nanocomposites is a promising way for the development of technological applications, especially for energy storage devices as the anode of lithium-ion batteries [16] [17] .
In the present work, we investigate the structural and optical-electrical properties of Graphene/Vanadium oxides nanoparticles. The structure and morphology of the composites are investigated in order to probe the effect of the presence rGO sheets on the dispersion and the size change of the nanostructured vanadium oxides. Furthermore, it reveals the strong effect on the optical and electrical properties of this hybrid material. Spectroscopic investigations are conducted to further elucidate the possible surface functionalization of the rGO sheets and chemical interaction with the vanadium oxides nanoparticles.
2. Materials and Methods
2.1. Material Preparation
All of the chemical reagents were analytical grade. They were purchased from Acros Organics and used without further purification. The detailed for the synthesis was as follows. GO nanosheets are synthesized from pure graphite which is treated with KMnO4 and H2SO4 according to the modified Hummer’s method [18] . The obtained GO was used as the starting precursor for the synthesis of chemically reduced graphene oxide (rGO) by hydrazine hydrate (N2H4-2H2O) at 40˚C with stirring for 6 h [19] [20] .
VO-NPs were synthesized using a hydrothermal procedure. In a typical synthesis addition of 0.75 ml of sulphuric acid, H2SO4, into an aqueous suspension of 0.45 g of V2O5 was followed by the addition of N2H4-2H2O. After stirring thoroughly, the solution’s color changed from yellow (V5+ valence state) to blue, indicating the reduction of V5+ to yield V4+ ions in solution. The pH of the resultant strongly acidic blue VO2+ solution was then adjusted to pH ≈ 5 by adding NaOH solution. Heat could also be applied to the solution while adding NaOH solution. A gray to brown precipitate was formed during the addition of NaOH solution. The hydrothermal synthesis was carried out in a Teflon-lined autoclave at 230˚C for about 48 h. In this step, the synthesized VO-NPs had nanobelts like shape.
The same steps were followed to prepare VO-NPs/Graphene nanocomposites, the appropriate amount (1:1 in molar ratio) by adding graphene solution to the prepared solution before running the hydrothermal synthesis. All samples were filtered and washed with water and ethanol to remove the organics residues and then dried at 60˚C for few hours.
2.2. Material Characterization
In this study, XRD patterns were obtained from a Rigaku Smart Lab system using Cu Ka (λ = 1.54178 Å), transmission electron microscopy (TEM) is employed to observe the morphology of rGO, VO-NPs and rGO/ VO-NPs nanocomposites, ATR-FTIR spectra were obtained using a Broker Vertex 70 with ATR system, Raman spectra were obtained using a Bruker Multi Ram with and excitation wavelength of 1064 nm, Uv-Vis (reflectance/absorbance) spectra were carried out using PerkinElmer LAMBDA 1050 UV/Vis/NIR spectrometer along with 150 mm integrating sphere (PerkinElmer, Inc., Shelton, CT USA). Finally, conductivity was measured with a Picoammeter/Voltage Source-Keithley Model 6487 system.
3. Results and Discussion
3.1. X-Ray Diffraction
The structural information for rGO, VO-NPs and rGO/VO-NPs are shown in (Figure 1). The XRD pattern of rGO (Figure 1(a)) exhibited a broad peak at 2θ = 23.5˚; compared with characteristic peak of GO at 2θ = 11˚ in our previous work confirming that GO was completely reduced by hydrazine solution [18] . The diffraction peak at about 2θ = 43˚ is associated to the (100) plane of the hexagonal carbon structure [21] . Figure 1(b) shows the XRD pattern of the as-prepared vanadium oxide nanoparticles. This pattern revealed the existence of the two phases of vanadium dioxide (VO2) and tetravanadium septoxide (V4O7). For VO2strong diffraction peaks were observed at Bragg angles 20.16˚, 33.03˚, 36.35˚, 41.65˚, 43.97˚, 46.59˚, 49.79˚, 61.29˚ and 81.79˚ are assigned to the (110) ( ) (
) ( ) (
) ( ) (012) (
 ) (
) ( ) (310) and
 ) planes; this series can be indexed to the monoclinic (b) crystalline phase (Space group 14: P121/c1) of VO2 with lattice constants a = 5.849727 Å, b = 4.600944 Å, c = 5.474888 Å and β = 122.599998 (ICDD card N˚ 9009089). Furthermore, the diffraction peaks at Bragg angles 24.61˚, 25.53˚, 30.98˚, 33.03˚, 34.63˚, 36.35˚, 41.65˚, 43.97˚, 46.59˚, 49.79˚, 61.29˚ and 81.79˚, which they could be assigned to the (102) (
 ) (
) ( ) (
) ( ) (
) ( ) (
) ( ) (
) ( ) (
) ( ) (
) ( ) (115) (
 ) and (
 ) planes, which can be readily indexed to the triclinic crystalline phase (Space group 2:A−1) of V4O7 with the lattice constants a = 5.456640 Å, b = 6.941393 Å and c = 12.139513 Å (α = 95.099998, β = 122.599998, γ = 109.250000) (ICDD card N˚ 1008024), revealing that the V5+ ions in V2O5 have been reduced to V4+ ions by the hydrazine in the reaction.
In the XRD patterns of rGO/VO-NPs nanocomposites (Figure 1(c)) shows the existence of three phases, vanadium dioxide (VO2), Hexavanadium tridecaoxide (V6O13) and Duttonite (H2VO3). The diffraction peaks of VO2were observed at 20.08˚, 33.88˚, 36.25˚, 40.82˚, 49.30˚, 64.36˚, 81.70˚; this peaks could be assigned to the (110) (130) (021) (121) (211) (002) and (171) planes, and they can be perfectly indexed to the orthorhombic crystalline phase (Space group 62:Pbnm) of VO2 with the lattice constants a = 5.0077 Å, b = 9.3563 Å and c = 2.8964 Å (α = 90.0000, β = 90.0000, γ = 90.0000); this is in agreement with the reported values (ICDD card N˚ 9000071). In the case of V6O13 diffraction peaks were observed at 26.94˚, 29.78˚, 33.88˚, 36.25˚, 44˚, 45.72˚, 49.30˚, 51.49˚, 58.20˚, 64.36˚, 81.70˚ which could be assigned to the (300) ( ) (302) (
 ) (410) (
 ) (020) (502) (321) (224) and (
 ) planes; this can be readily indexed to the monoclinic (b) crystalline phase (Space group 7: P1c1) of V6O13 with the lattice constants a = 10.0764 Å, b = 3.7161 Å and c = 11.9817 Å (α = 90.0000, β = 100.9140, γ = 90.0000) (ICDD card N˚ 2104009). For H2VO3 the diffraction peaks were observed at 20.08˚, 24.55˚, 26.94˚, 29.78˚, 33.88˚, 36.25˚, 40.82˚, 45.72˚, 49.30˚, 51.49˚, 58.20˚, 81.70˚ which could be assigned to the (200) (110) (011) (002) (21-1) (20-2) (400) (020) (31-2) (40-2) (321) and (620) planes, which can be readily indexed to the monoclinic(b) crystalline phase (Space group 15:I12/c1) of H2VO3 with calculated lattice constants a = 8.8268 Å, b = 3.9620 Å and c = 5.9781 Å and β = 90.6700, which corresponds to H2VO3; this is compatible with the standard value of ICDD card N˚ 9011014 already described in the literature.
3.2. TEM Measurements
The effects of rGO sheets on the morphologies of vanadium oxides nanoparticles have been investigated. Figure 2 presents typical TEM images of rGO, VO-NPs and the resulting nanocomposites. Figure 2(a) shows TEM images of rGO which revealed a wide and flat individual graphene sheets with a few folds along their length

Figure 1. X-rays diffraction of rGO (a), VO-NPs (b) and rGO/VO-NPs nanocomposite (c).
without any discernible roughness. In fact, this confirms that graphene sheets were fully exfoliated. Figure 2(b) shows a typical panoramic TEM image of the VO-NPs film reveals that the vanadium oxides nanoparticles are made of the homogenous phase with uniform particles which display nanobelts morphology. The nanobelts with very smooth and flat surfaces have a typical length of up to 1 μm and a width of about 9 - 14 nm. Figure 2(c) shows an important modification on the morphology of these nanostructures were prepared in the presence of graphene nanosheets. The growth of VO-NPs, in this case, leads to a rod-like shape with very smooth and flat surfaces and a typical length of up to 100 nm and a width of about 9 nm. These results support the spectroscopic investigations and confirm the effect of graphene sheets on the growth of vanadium oxide nanostructures.
3.3. Fourier-Transform Infrared Spectroscopy
ATR-FTIR spectroscopy is one of the powerful tools for detecting the species on the nanostructures surface. Figure 3 provides the infrared spectra of rGO, VO-NPs and rGO/VO-NPs nanocomposites. In Figure 3(a), the spectrum of rGO has two peaks: the first at 1630 cm−1 originated from in plane C=C bands and the skeletal vibration of the graphene sheets and the second peak located at 1770 cm−1 may be due to the C=O stretching of the remaining carboxylic groups placed at edges of rGO or CO2 [18] . As we can see VO-NPs (Figure 3(b)) infrared spectrum has multiple bands, the two ones at 617 and 670 cm−1 are associated to the characteristic V-O-V octahedral bending modes [22] . Moreover, the peak located at 893 cm−1 is attributed to the coupled vibration V=O and V-O-V [23] . The stretching vibration of the V=O (vanadyl) bond is observed at 990 cm−1 while the band located at 1070 cm−1 is assigned to the oxidation state from V5+ to V4+ [23] .The ATR-FTIR spectrum of the nano-
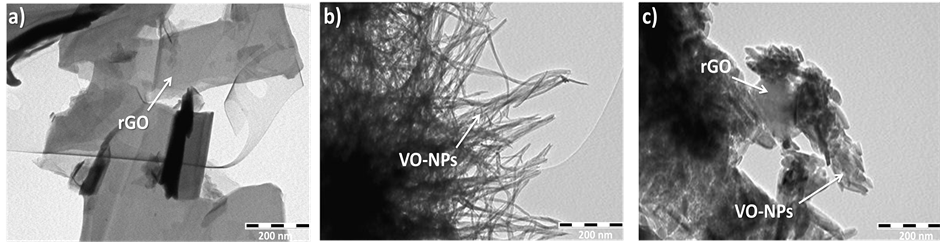
Figure 2. TEM images of the rGO, VO-NPs and rGO/VO-NPs nanocomposite.

Figure 3. ATR-FTIR spectra of the rGO, VO-NPs and rGO/VO-NPs nanocomposite.
composites prepared from rGO and VO-NPs is shown in Figure 3(c).The vibration modes of vanadium oxide are generally identified in the region below 1000 cm−1. The vibrational bands observed at 668 cm−1 and 750 cm−1 regions can be attributed to (V-O-V) as reported for vanadium oxide [24] .The characteristic peak at 910 cm−1 corresponds to V4+ terminal oxygen bonds (V4+=O) and the peak at 1005 cm−1 which corresponds to V5+ terminal oxygen bonds (V5+=O) becomes stronger, [22] -[25] . In addition, the spectrum contain sharp band at 1057 cm−1 corresponding to C-O mode [26] , and two overlapping bands located at 1285 and 1350 cm−1 are assigned as vibrations corresponding to the C-C-C angle and epoxides C-O-C, respectively [26] [27] . This may be due to the functionalization with oxygen functional groups onto the surface of rGO indicating the re-oxygenation of rGO nanosheets after the coating with vanadium oxidenanostructures. This may lead to the nucleation of VO-NPs on the surface of graphene layers which will affect the growth of these metal oxide nanoparticles. The spectrum revealed also absorption bands at around 2940 and 3126 cm−1 assigned to the stretching and bending modes of the CH2 and N-H vibrations that exist in the rGO after reduction with hydrazine while the peak observed at 3360 cm−1 can be attributed to the O-H stretching.
3.4. Raman Spectroscopy
Raman spectroscopy is a powerful and nondestructive tool to characterize carbonaceous materials because of their high Raman intensities, further information on the structure of rGO, VO-NPs and rGO/VO-NPs nanocomposites were obtained from the associated Raman spectra. As shown in Figure 4(a), the rGO Raman spectrum is characterized by the G band located at 1600 cm−1 corresponding to the first-order scattering of the E2g phonons and the D band around 1330 cm−1 arising from the breathing mode of k-point phonons of A1g symmetry [18] . In addition G band represent the in-plane stretching of ordered sp2 bonded carbon atoms while D band is ascribed to defects such as the density of impurity, disordered carbon and oxygen-containing functional groups on graphene [28] [29] . Besides this, rGO spectrum exhibit another broadband around 2600 - 2800 cm−1 corresponding to 2D band which is the result of a two-phonon lattice vibrational process and is often referred to the rGO number of layers [29] . The spectrum of VO-NPs displays a series of Raman band in the range of 200 - 1000 cm−1 (Figure 4(b)), which is due to the various vibrations of V-O type. In fact, the Raman spectrum shows the existence of a band at 287 cm−1 which could be attributed to V-O-V in the bending mode [30] . The two peaks located at 339 and 618 cm−1 are associated to the vibrational modes Bg and Ag respectively [31] . The peaks of weaker intensity which could be attributed to V-O-V bridging modes were observed at 407 cm−1 and 485 cm−1 [30] -[32] . The peak at 524 cm−1 is attributed to the triply coordinated oxygen (V3-O) stretching mode of edge-shared oxygen in common with three pyramids [33] [34] . In addition, the peak at 688 cm−1 corresponds to

Figure 4. Raman spectra of the rGO, VO-NPs and rGO/VO-NPs nanocomposite.
the doubly coordinated oxygen (V2-O) stretching mode, which is due to corner-shared oxygen common to two pyramids [33] [34] . Furthermore, the peak at 982 cm−1 could be attributed to V=O stretching vibrations [30] which are in agreement with the ATR-FTIR. The Raman spectrum of the nanocomposites prepared from rGO and VO-NPs is shown in Figure 4(c). As we can see, the series of the intensity of Raman band in the range of 200 - 1000 cm−1 becomes more intense, which indicated a clear composite interaction between vanadium oxide nanobelts and rGO nanosheets. Below 1000 cm−1, the vibrational Raman active mode of rGO/VO-NPs can be described in terms of vanadium-oxygen stretching modes, vanadium-oxygen-vanadium bending vibrations, and translational modes [35] . The new two peaks appear at 818 and 907 cm−1 are assigned to the Bg vibrational mode and the presence of hydrated VO-NPs nanorods. In addition, the two peaks located at 998 and 1096 cm−1 becomes very intense compared with vanadium oxide nanobelts peaks, these results may be due to the change of size and or shape of VO-NPs which confirms the TEM observations. In addition, the area ratio of sp3 to sp2 for rGO and rGO/VO-NPs is 1.38 and 1.13, respectively. The intensity ratio ID/IG which corresponding to the sp3/sp2 hybridization ratio decreased to 1.13 compared with that of rGO (1.38). This change can be explained by the increase of graphitic domain created in rGO/VO-NPs nanocomposites. Therefore, the Raman results are consistent with the formation of rGO/VO-NPs nanocomposites.
3.5. UV-Vis Absorbance Spectroscopy
Figure 5 shows the absorbance spectra of rGO, VO-NPs and rGO/VO-NPs nanocomposites in the wavelength range 200 - 1000 nm. The spectrum of reduced graphene oxide (Figure 5(a)) has an absorption peak at 270 nm. This absorption peak is attributed to n−π* transition of C-O bonds now embedded by exfoliation and intercalation on the graphene [18] . Compared with graphene oxide, the red shift from 230 to 270 nm is due to the change in the electronic configuration after the reduction process from GO to rGO [18] . Generally, the GO absorbance spectrum is known by the presence of three principal peaks, the main absorbance peak attributed to the π−π* transitions of C-C occurs at around 230 nm, the broad absorption spectra indicating a well-defined band-edge in the Uv-Vis-NIR energy range and a shoulder around 320 nm may be attributed to π−π* transitions of C-O. The transformation of GO in our sample is confirmed by the disappearance of C-C band centered at around 230 nm and its shifting to 270 nm upon reduction likely due to the decrease in the concentration of carboxyl groups indicating that the electronic conjugation within the reduced graphene sheets was revived upon reduction of graphene oxide [18] . The spectrum of VO-NPs (Figure 5(b)) has two bands located at around 253 nm and 370 nm, the first should be assigned to charge transfer transition, involving oxygen and vanadium (IV) in tetrahedral coordination, present in isolated species [36] [37] . The second broad band at 370 nm is attributed to octahedral

Figure 5. Uv-Vis optical absorption spectra of rGO (a), VO-NPs (b) and rGO/VO-NPs (c) nanocomposite.
V4+ species [36] . Moreover, the Uv-Vis spectrum of rGO/VO-NPs nanocomposites shown in (Figure 5(c)) presents the existence of four bands. The intense one is located at 273 nm can be attributed to the absorption of graphene layers. The second one is due to the absorption of VO-NPs. Moreover, the band at 490 nm can be attributed to the electron transfer from oxygen atoms to vanadium in octahedral coordination [37] . Indeed, the origin of this change of spectral band position was suggested to be the contribution of a quantum size effect in the VO-NPs [37] [38] . Finally, the band at 690 nm is attributed to d-d transition of V4+ [39] .
3.6. UV-Vis Reflectance Spectroscopy
The reflectance spectra of VO-NPs and the rGO/VO-NPs nanocomposites films on glass substrates measured in the wavelength range 200 - 1200 nm are shown in Figure 6. Reflectivity change was observed distinctly in the wavelength region 200 - 400 nm and slightly above 400 nm. The reflectance of the VO-NPs films has exceeded that of the rGO/VO-NPs nanocomposites films in the Uv-Vis-NIR region. The VO-NPs films switches from high reflectance (78%) to lower reflectance (49%) after the introduction of rGO, clearly showing the strong effect of rGO layers on the growth of vanadium oxide nanostructures which leads to a change in the form, the shape, and the phase. Hence, the reduced graphene oxide has an important effect on the stoichiometry and crystallinity of VO-NPs in the composite which have an influence on the optical properties.
3.7. I-V Characterization
Figure 7 shows a comparison of the I-V characteristics of VO-NPs and the rGO/VO-NPs nanocomposites. The virtually linear I-V curve obtained from VO-NPS film presents the ohmic behavior of the contact. At a negative voltage, the value of the current at which conductivity starts its linear behavior is −120 (μA). With an increase of the applied voltage, the increment in the curent reduces the occupancy of defect states, which is due to a large number of charge carriers available for conduction. For the rGO/VO-NPs nanocomposites films we observed that the conductivity reduced compared with VO-NPs films which is due to an increase in the mobility of the charge carriers after the introduction of graphene sheets, also these results can be due to the modification on the morphology and VO-NPs structure from nanobelts to nanorods which was confirmed by the TEM observations. Furthermore, the introduction of rGO sheets showing in one hand a large number of charge carriers available for conduction and in the other hand that the number of electronic defects decreases in the rGO/VO-NPs nanocoposites so that the mobility increases. However, these results show that the principal reason for a good electrical conductivity of rGO/VO-NPs nanocomposites films is decreasing the number of electronic defects in a linear

Figure 6. Reflectance spectra of VO-NPs and rGO/VO-NPs nanocomposite thin films recorded in the range 200 - 1200 nm.

Figure 7. Conductivity measurement of VO-NPs and rGO/VO-NPs nanocomposite.
way. Hence, graphene can provide the conductive pathway to improve the electrical conductivity of vanadium oxides nanoparticles.
4. Conclusion
In conclusion, VO-NPs are successfully coated onto the surface of rGO via a hydrothermal synthesis method. The XRD pattern revealed the existence of two phases of VO-NPs while graphene sheets caused a change in the crystallinity of these nanoparticles by forming three phases. In addition, the obtained phases without rGO were different to the ones which were obtained in its presence. Moreover, we confirm that vanadium oxide nanobelts were efficiently grown with a typical length of up to 1 μm and a width of about 9 - 14 nm. These nanobelts were transformed to nanorods like shape with a typical length of up to 100 nm and a width of about 9 nm in the presence of rGO sheets. This is showing clearly the strong effect of rGO layers on the growth of VO-NPs and confirmed by the formation of new IR and Raman bonds which may be due to the functionalization with oxygen functional groups onto the surface of rGO indicating the re-oxygenation of rGO nanosheets after the coating with vanadium oxide nanorods. Furthermore, we found that the synergetic effect between vanadium oxide nanoparticles and rGO layers improved the mobility of the charge carriers and highly influenced the optical properties. Hence, the importance of this study is focused on the effect of rGO sheets on the stoichiometry and crystallinity of VO-NPs which have an influence on the structural, optical and electrical properties of their hybridnanocomposite. Overall, this study could offer new insights to understand the different effects and interaction between these two nanomaterials and enhance their application performance in many fields including storage devices.
Acknowledgements
Special Acknowledgments to the Innovation city of USMBA (Morocco), Nanosciences African Network, African Laser Center, University of South Africa Department of Physics and iThemba Labs (South Africa).
Cite this paper
IssamDerkaoui,MohammedKhenfouch,IbrahimElmokri,Sabata JonasMoloi,Bakang MosesMothudi,Mokhotjwa SimonDhlamini,MalikMaaza,IzeddineZorkani,AnouarJorio, (2016) Experimental Investigation of the Effect of Graphene Nanosheets on the Optical-Electrical Properties of Vanadium Oxide Nanocomposites. Graphene,05,14-24. doi: 10.4236/graphene.2016.51002
References
- 1. Kavitha, T., Gopalan, A.I., Lee, K.P. and Park, S.Y. (2012) Glucose Sensing, Photocatalytic and Antibacterial Properties of Graphene-ZnO Nanoparticle Hybrids. Carbon, 50, 2994-3000. http://dx.doi.org/10.1016/j.carbon.2012.02.082
- 2. Kottegoda, I.R.M., Idris, N.H., Lu, L., Wang, J.Z. and Liu, H.K. (2011) Synthesis and Characterization of Graphene-Nickel Oxide Nanostructures for Fast Charge-Discharge Application. Electrochimica Acta, 56, 5815-5822. http://dx.doi.org/10.1016/j.electacta.2011.03.143
- 3. Liang, M. and Zhi, L. (2009) Graphene-Based Electrode Materials for Rechargeable Lithium Batteries. Journal of Materials Chemistry, 19, 5871-5878. http://dx.doi.org/10.1039/b901551e
- 4. Nethravathi, C., Anumol, E.A., Rajamathi, M. and Ravishankar, N. (2011) Highly Dispersed Ultrafine Pt and PtRu Nanoparticles on Graphene: Formation Mechanism and Electrocatalytic Activity. Nanoscale, 3, 569-571. http://dx.doi.org/10.1039/C0NR00664E
- 5. Wang, D., Choi, D., Li, J., Yang, Z., Nie, Z., Kou, R., Hu, D., Wang, C., Saraf, L.V., Zhang, J., Aksay, I.A. and Liu, J. (2009) Self-Assembled TiO2-Graphene Hybrid Nanostructures for Enhanced Li-Ion Insertion. ACS Nano, 3, 907-914. http://dx.doi.org/10.1021/nn900150y
- 6. Yu, D., Yang, Y., Durstock, M., Baek, J.B. and Dai, L. (2010) Soluble P3HT-Grafted Graphene for Efficient Bilayer-Heterojunction Photovoltaic Devices. ACS Nano, 4, 5633-5640. http://dx.doi.org/10.1021/nn101671t
- 7. Geim, A.K. and Novoselov, K.S. (2007) The Rise of Graphene. Nature Materials, 6, 183-191. http://dx.doi.org/10.1038/nmat1849
- 8. Geim, A.K. (2009) Graphene: Status and Prospects. Science, 324, 1530-1534. http://dx.doi.org/10.1126/science.1158877
- 9. Wang, X. and Li, Y. (2006) Solution-Based Synthetic Strategies for 1-D Nanostructures. Inorganic Chemistry, 45, 7522-7534. http://dx.doi.org/10.1021/ic051885o
- 10. Wu, C., Wei, H., Ning, B. and Xie, Y. (2010) New Vanadium Oxide Nanostructures: Controlled Synthesis and Their smart Electrical Switching Properties. Advanced Materials, 22, 1972-1976. http://dx.doi.org/10.1002/adma.200903890
- 11. Kim, H., Kim, Y., Kim, T., Jang, A.R., Jeong, H.Y., Han, S.H., Yoon, D.H., Shin, H.S., Bae, D.J., Kim, K.S. and Yang, W.S. (2013) Enhanced Optical Response of Hybridized VO2/Graphene Films. Nanoscale, 5, 2632-2636. http://dx.doi.org/10.1039/c3nr34054f
- 12. An, Q., Lv, F., Liu, Q., Han, C., Zhao, K., Sheng, J., Wei, Q., Yan, M. and Mai, L. (2014) Amorphous Vanadium Oxide Matrixes Supporting Hierarchical Porous Fe3O4/Graphene Nanowires as a High-Rate Lithium Storage Anode. Nano Letters, 14, 6250-6256. http://dx.doi.org/10.1021/nl5025694
- 13. Qin, J., Lv, W., Li, Z., Li, B., Kang, F. and Yang, Q.H. (2014) An Interlaced Silver Vanadium Oxide-Graphene Hybrid with High Structural Stability for Use in Lithium Ion Batteries. Chemical Communications, 50, 13447-13450. http://dx.doi.org/10.1039/C4CC05065G
- 14. Nethravathi, C., Rajamathi, C.R., Rajamathi, M., Gautam, U.K., Wang, X., Golberg, D. and Bando, Y. (2013) N-Doped Graphene-VO2(B) Nanosheet-Built 3D Flower Hybrid for Lithium Ion Battery. ACS AppliedMaterials& Interfaces, 5, 2708-2714. http://dx.doi.org/10.1021/am400202v
- 15. Shi, Y., Chou, S.L., Wang, J.Z., Wexler, D., Li, H.J., Liu, H.K. and Wu, Y. (2012) Graphene Wrapped LiFePO4/C Composites as Cathode Materials for Li-Ion Batteries with Enhanced Rate Capability. Journal of Materials Chemistry, 22, 16465-16470. http://dx.doi.org/10.1039/c2jm32649c
- 16. Zhao, H., Pan, L., Xing, S., Luo, J. and Xu, J. (2013) Vanadium Oxides-Reduced Graphene Oxide Composite for Lithium-Ion Batteries and Supercapacitors with Improved Electrochemical Performance. Journal of Power Sources, 222, 21-31. http://dx.doi.org/10.1016/j.jpowsour.2012.08.036
- 17. Lee, J.W., Lim, S.Y., Jeong, H.M., Hwang, T.H., Kang, J.K. and Choi, J.W. (2012) Extremely Stable Cycling of Ultra-Thin V2O5 Nanowire-Graphene Electrodes for Lithium Rechargeable Battery Cathodes. Energy & Environmental Science, 5, 9889-9894. http://dx.doi.org/10.1039/c2ee22004k
- 18. Khenfouch, M., Buttner, U., Baïtoul, M. and Maaza, M. (2014) Synthesis and Characterization of Mass Produced High Quality Few Layered Graphene Sheets via a Chemical Method. Graphene, 3, 7-13. http://dx.doi.org/10.4236/graphene.2014.32002
- 19. Khenfouch, M., Baïtoul, M. and Maaza, M. (2014) Raman Study of Graphene/Nanostructured Oxides for Optoelectronic Applications. Optical Materials, 36, 27-30. http://dx.doi.org/10.1016/j.optmat.2013.07.004
- 20. Hou, C., Zhang, Q., Zhu, M.,Li, Y. and Wang, H. (2011) One-Step Synthesis of Magnetically-Functionalized Reduced Graphite Sheets and Their Use in Hydrogels. Carbon, 49, 47-53. http://dx.doi.org/10.1016/j.carbon.2010.08.040
- 21. Zhan, Y., Meng, F., Lei, Y., Zhao, R., Zhong, J. and Liu, X. (2011) One-Pot Solvothermal Synthesis of Sandwich-Like Graphene Nanosheets/Fe3O4 Hybrid Material and Its Microwave Electromagnetic Properties. Materials Letters, 65, 1737-1740. http://dx.doi.org/10.1016/j.matlet.2011.03.019
- 22. Sediri, F. and Gharbi, N. (2007) Nanorod B Phase VO2 Obtained by Using Benzylamine as a Reducing Agent. Materials Science and Engineering: B, 139, 114-117. http://dx.doi.org/10.1016/j.mseb.2006.12.011
- 23. Pavasupree, S., Suzuki, Y., Kitiyanan, A., Pivsa-Art, S. and Yoshikawa, S. (2005) Synthesis and Characterization of Vanadium Oxides Nanorods. Journal of Solid State Chemistry, 178, 2152-2158. http://dx.doi.org/10.1016/j.jssc.2005.03.034
- 24. Baudrin, E., Sudant, G., Larcher, D., Dunn, B. and Tarascon, J.M. (2006) Preparation of Nanostructured VO2(B) from Vanadium Oxide Aerogels. Chemistry of Materials, 18, 4369-4374. http://dx.doi.org/10.1021/cm060659p
- 25. Lavayen, V., O’Dwyer, C., Cardenas, G., Gonzàlez, G. and Sotomayor Torres, C.M. (2007) Towards Thiol Functionalization of Vanadium Pentoxide Nanotubes Using Gold Nanoparticles. Materials Research Bulletin, 42, 674-685. http://dx.doi.org/10.1016/j.materresbull.2006.07.022
- 26. Acik, M., Lee, G., Mattevi, C., Pirkle, A., Wallace, R.M., Chhowalla, M., Cho, K. and Chabal, Y. (2011) The Role of Oxygen during Thermal Reduction of Graphene Oxide Studied by Infrared Absorption Spectroscopy. Journal of Physical Chemistry C, 115, 19761-19781. http://dx.doi.org/10.1021/jp2052618
- 27. Ndwandwe, S., Tshibangu, P. and Dikio, E.D. (2011) Synthesis of Carbon Nanospheres from Vanadium β-Diketonate Catalyst. International Journal of Electrochemical Science, 6, 749-760.
- 28. Das, A., Chakraborty, B. and Sood, A.K. (2008) Raman Spectroscopy of Graphene on Different Substrates and Influence of Defects. Bulletin of Materials Science, 31, 579-584. http://dx.doi.org/10.1007/s12034-008-0090-5
- 29. Pimenta, M.A., Dresselhaus, G., Dresselhaus, M.S., Cançado, L.G., Jorio, A. and Saito, R. (2007) Studying Disorder in Graphite-Based Systems by Raman Spectroscopy. Physical Chemistry Chemical Physics, 9, 1276-1290. http://dx.doi.org/10.1039/b613962k
- 30. Li, R. and Liu, C.Y. (2010) VO2(B) Nanospheres: Hydrothermal Synthesis and Electrochemical Properties. Materials Research Bulletin, 45, 688-692. http://dx.doi.org/10.1016/j.materresbull.2010.02.021
- 31. Schilbe, P. (2002) Raman Scattering in VO2. Physica B, 316, 600-602. http://dx.doi.org/10.1016/S0921-4526(02)00584-7
- 32. Petrov, G.I., Yakovlev, V.V. and Squier, J. (2002) Raman Microscopy Analysis of Phase Transformation Mechanisms of Vanadium Dioxide. Applied Physics Letters, 81, 1023-1025. http://dx.doi.org/10.1063/1.1496506
- 33. Faggio, G., Modafferi, V., Panzera, G., Alfieri, D. and Santangelo, S. (2012) Micro-Raman and Photoluminescence Analysis of Composite Vanadium Oxide/Poly-Vinyl Acetate Fibers Synthesized by Electro-Spinning. Journal of Raman Spectroscopy, 43, 761-768. http://dx.doi.org/10.1002/jrs.3089
- 34. Baddour-Hadjean, R., Marzouk, A. and Pereira-Ramos, J.P. (2012) Structural Modifications of LixV2O5 in a Composite Cathode (0 ≤ x < 2) Investigated by Raman Micro Spectrometry. Journal of Raman Spectroscopy, 43, 153-160. http://dx.doi.org/10.1002/jrs.2984
- 35. Fang, W.C. (2008) Synthesis and Electrochemical Characterization of Vanadium Oxide/Carbon Nanotube Composites for Supercapacitors. Journal of Physical Chemistry C, 112, 11552-11555. http://dx.doi.org/10.1021/jp8011602
- 36. Murgia, V., Torres, E.M.F., Gottifredi, J.C. and Sham, E.L. (2006) Sol-Gel Synthesis of V2O5-SiO2 Catalyst in the Oxidative Dehydrogenation of n-Butane. Applied Catalysis A: General, 312, 134-143. http://dx.doi.org/10.1016/j.apcata.2006.06.042
- 37. Liu, J. and Xue, D. (2010) Cation-Induced Coiling of Vanadium Pentoxide Nanobelts. Nanoscale Research Letters, 5, 1619-1626. http://dx.doi.org/10.1007/s11671-010-9685-z
- 38. Yan, C. and Xue, D. (2008) Formation of Nb2O5 Nanotube Arrays through Phase Transformation. Advanced Materials, 20, 1055-1058. http://dx.doi.org/10.1002/adma.200701752
- 39. Chen, X., Zhao, W., Wang, F. and Xu, J. (2012) Preparation and Characterization of Vanadium (IV) Oxide Supported on SBA-15 and Its Catalytic Performance in Benzene Hydroxylation to Phenol Using Molecular Oxygen. Journal of Natural Gas Chemistry, 21, 481-487. http://dx.doi.org/10.1016/S1003-9953(11)60394-0
NOTES

*Corresponding author.