International Journal of Medical Physics,Clinical Engineering and Radiation Oncology
Vol.2 No.2(2013), Article ID:31813,9 pages DOI:10.4236/ijmpcero.2013.22008
Planning and Dosimetric Comparisons of IMRT Lung Cancers with Three Advanced Optimization Algorithms
3Department of radiation Oncology, Sichuan Cancer Hospital, Chengdu, China
Email: Yiec@hotmail.com
Copyright © 2013 Yie Chen et al. This is an open access article distributed under the Creative Commons Attribution License, which permits unrestricted use, distribution, and reproduction in any medium, provided the original work is properly cited.
Received March 10, 2013; revised April 15, 2013; accepted May 15, 2013
Keywords: MCO; DMPO; Tomotherapy; Lung IMRT
ABSTRACT
Purpose: To evaluate planning quality and dosimetric differences of clinically deliverable Intensity-modulated Radiation Therapy lung plans generated from Tomotherapy, Pinnacle3, and RayStation™ treatment planning systems. Method and Materials: Ten patients diagnosed with non-small-cell lung carcinoma (NSCLC) previously treated with plans on Pinnacle using Direct Machine Parameter Optimization were randomly selected and re-planned with Tomotherapy dose volume constraints and same beam geometry with RayStation Multi Criteria Optimization (MCO) equivalent uniform dose (EUD) or dose volume constraints, respectively. Prescription was established as 60 Gy to cover > 95% of PTV. Planning outcomes such as D95 (95% of volume of PTV receiving the prescribed dose), D5, D33, mean heart and lung doses, V20 (volume of lung receiving 20 Gy), and max cord dose of 1cm3 were evaluated according to our departmental clinical protocols. Conformity index (CI = PTV/prescription isodose volume) and homogeneity index (HI = D5/D95) were also reported simultaneously. All plans were successfully uploaded for delivery verification. Results: Mean volume of calculated PTV was 356 ± 141 cm3. The planning results indicated that CI, HI, D95 and D5 of PTV, V20 of lung, and 1cm3 max cord dose were comparable but with better overall dosimetric distributions with conformity and homogeneity index from Tomotherapy plans in comparison to both Pinnacle and RayStation planning outcomes. Conclusions: Tomotherapy plans achieved better uniform tumor coverage with fewer hot spots while sparing more critical structures with superior dose fall-off. RayStation plans with MCO automatically generated a set of Pareto optimized solutions with given objectives to allow tradeoffs between targets and critical organs and tended to achieve better tumor coverage compared to Pinnacle. All three planning algorithms can generate clinical deliverable IMRT lung plans while Tomotherapy plans provide superior dosimetric indexes compared to Pinnacle and RayStation due to its unique beamlet optimization process with high modulation.
1. Introduction
Intensity Modulated Radiation Therapy (IMRT) was defined as a dosimetric planning technique with Multi-leaf Collimators (MLCs) in radiation therapy. A benefit of using IMRT was to conform the tumor shape while sparing adjacent critical structures to minimize treatment impact. IMRT has been established in modern clinic to improve dose distribution with possible fewer side effects. While MLC design of Linear Accelerators posted limitation on optimum IMRT delivery, this technique has been traditionally implemented with leaf sequencing process of the plan specific optimized intensity maps. The two-step process usually might experience degradation of the plan quality after fulfilling the machine characteristics with MLC limitation. The methodology translates each intensity map into a set of deliverable aperture shapes [1-5]. Clinically, there were many treatment planning systems (TPS) commercially available with different optimization algorithms for IMRT. Dosimetric results were largely based on system characteristics, IMRT optimization algorithms, as well as machine deliverable functions with various outcomes. Improvement of planning results relies heavily on planner’s experience to fulfill clinical judgment with available hardware systems (inverse planning algorithms and MLC design). Shepard et al. has tested and introduced an automated planning algorithm in which bypassing the traditional intensity optimization, with directly optimizes the shapes and the weights of the apertures which was defined as direct aperture optimization (DAO) in the commercial planning systems [6]. By specifying the maximum number of apertures per beam direction and providing significant control over the complexity of MLC delivery, this became possible because the machine dependent delivery constraints imposed by the MLC are enforced within the aperture optimization algorithm rather than in a separate leaf-sequencing process for the optimized intensity maps. In this study, the focus was established on the plans generated from Pinnacle (version 9.2, Philips Medical, Madison, WI) with DMPO algorithms [6,7] compare to RayStation (version 2.4.8.180, RaySearch Laboratory, Stockholm, Sweden) MCO algorithm [8,9] and Tomotherapy Convolution/Superposition algorithm (version 4.0.4, Accuray, Sunnyvale, CA) among ten randomly selected IMRT lung patients. Pinnacle DMPO algorithm was considered as the benchmark for comparison studies as most of our IMRT cases were planned and treated with this algorithm. We created extremely similar dose constraints for verification purposes and evaluated clinical significance with identical DICOM imaging and structure sets. In order to demonstrate advantages and disadvantages of the planning, patients were selected due to the complexity of GTV location and critical structures around the disease site, with limited dose tolerance settings and tissue in homogeneity.
In traditional IMRT planning workflow, fluence maps were first generated based on the objectives of target and critical organs, then converted to segments, and leaf sequencer was applied to create deliverable MLC segments. With Pinnacle version 9.2, IMRT plans were optimized with DMPO, and MLC setting were produced directly within the optimization process [6].
RayStation is the one of the first commercially available planning systems with MCO funcationality in order to enable the treatment planning procedure with intuitive and time-efficient calculations [10-12]. Based on available calculation algorithms, with the planning system which has provided dose volume objectives or equivalent uniform dose (EUD) based optimization process [13,14], the graphical display with navigation sliders for each trade-off objectives enabled users to observe the improvement or worsening of the objective functions in real time. Based on the trade-off objectives of the target and critical structures, a set of Pareto optimal plans and a balanced plan with elimination of the weights in the objective function, was generated. Graphical interface in this particular planning system provided friendly interactive tools to achieve different combination of goals with different objectives in a pre-calculated Pareto spaces. Advantages of this interactive approach also came to the selection within very few optimized plans in the solution space which likely resulted in a “best” calculation of deliverable plan.
Tomotherapy is a megavoltage radiation delivery system, consists of a ring gantry CT scanner with a binary multileaf collimator (MLC) [15-20]. During radiation delivery, the patient is continuously translated through a ring gantry with rotating fan beam techniques creating the IMRT dosimetric outcome Planning system is partly integrated into the treatment delivery platform, withbeamlet calculation performed t optimize dose distribution. The helical pattern of delivery represents the binary MLC characteristics with 51 beam delivery angles inside this system.
Within this study, lung IMRT plans were compared among Pinnacle with DMPO, RayStation with MCO, and Tomotherapy with convolution/superposition optimization to evaluate planning quality and dosimetric differences. Conformity and homogeneity indices were also reported, dose delivered to targets and critical organs were also summarized for the purpose of this study.
2. Material and Methods
Ten patients diagnosed with NSCLC staged from IIA to IIIB were randomly selected (n = 10) with five cases located on the left lung and five cases located on the right lung. Range of contoured PTV was from 141.3 to 610.7 cm3, with mean volume of 379 ± 170 cm3. Five patients were treated with five fixed gantry angles and other five were treated with six fixed gantry angles with Pinnacle IMRT plans based on the locations and sizes of the tumor. No pre-selected beam angles were defined in those cases due to various tumor locations. The identical CT DICOM images and structures of those ten cases such as GTV, PTV, total lung (right and left lungs), heart, spinal cord plus 5 mm expansion, RIND structures (external patient contours subtracted 1cm of PTV expansion), and external contours were transferred either directly or via Oncentra™ MasterPlan (version 3.3, Nucletron Corporation, Columbia, MD) workstation to Tomotherapy and RayStation for re-planning purposes. Identical energy selection and prescription of 60 Gy to 95% of PTV were also utilized in this retrospective study. Isocenter, beam angles and maximum number of segments on RayStation were properly matched on Pinnacle since they were both utilizing similar IMRT optimization algorithms. Plans on RayStation were planned with four cases using same or similar dose volume constraints and six cases using EUD dose constraints, to take advantages of unique features in Pareto plans.
In organizing Tomotherapy planning criteria, same prescription, nominal normal dose calculation grid, and jaw field width of 2.5 cm were used. Modulation factor was set at 3.5, with a pitch factor of 0.287; dose volume based optimization with helical delivery technique was performed as the standard Tomotherapy treatment.
Planning outcomes such as D95 (95% of volume of PTV receiving the prescribed dose), D5, D2, and D1 to PTV, D33 (dose to 33% volume of heart) and mean dose to heart, V20 (percent volume of total lung receives 20 Gy) and mean dose to total lung, and 1 cm3 of spinal cord dose were reported for evaluation according to departmental clinical protocols. CI was evaluated with the following definitions: Knoos et al. [21] has described the Conformity Index (CI) as:
where VPTV is the contoured PTV, and VI is the volume of VPTV covered by the prescription isodose volume.
Homogeneity Index (HI) was evaluated with RTOG definitions due to its simplicity as:

where D5 is minimum dose to cover 5% of PTV, and D95 is minimum dose to cover 95% of PTV.
Results from all cases were analyzed using PASW (formerly SPSS, LLC, Chicago, IL) Statistics 18. A p-value of 0.05 or less was considered statistical significance for clinical dosimetry presented in this study.
3. Results
3.1. CI and HI
Figure 1 has shown HI results of ten lung patients from three TPS. The planning range of HI for Tomotherapy compared to Pinnacle and RayStation was from 1.02 to 1.06, 1.04 to 1.11, and 1.04 to 1.10, respectively. There was a statistically significance of HI compared Tomotherapy to Pinnacle (p = 0.001) and RayStation (p = 0.001). And Table 1 shows the mean and standard deviation of CI and HI of ten patients. There was no statistically significance of CI among three TPS with the tested patients.
3.2. PTV
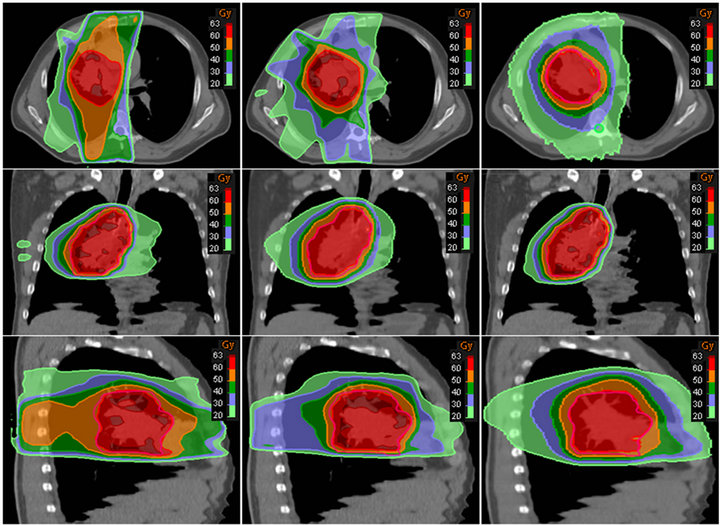
Figures 2 and 3 have shown the planning dose to 95% and 5% of PTV for each patient. The dosimetry coverage of D95 for Tomotherapy, Pinnacle, and RayStation was from 59.5 to 60 Gy, 58.6 to 60.4 Gy, and 58.7 to 59.7 Gy, respectively. Table 2 shows the mean and standard deviation of D95, D5, D2, and D1 of PTV. Dose to volume of 95% PTV was better with Tomotherapy compared to RayStation and Tomotherapy (p = 0.033). There was also a statistically significance of D5 compared Tomotherapy to Pinnacle (p = 0.000) and RayStation (p = 0.000), so were D2 and D1. As expected, hot spots were lower for Tomotherapy. Figure 4 shows the color-washed isodose of Pinnacle, RayStation, and Tomotherapy of one patient. Figure 6 shows the DVH evaluation of PTV with comparison for the same patients on three TPS, clearly To-
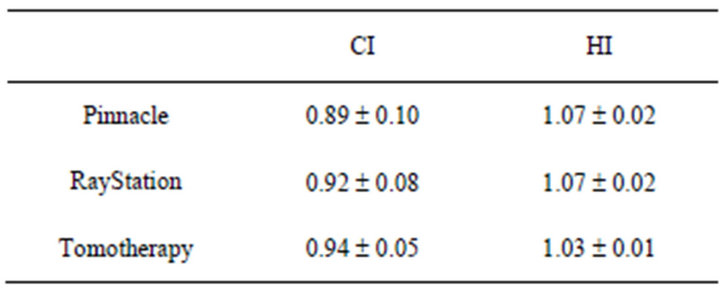
Table 1. Mean and standard deviation of CI and HI.
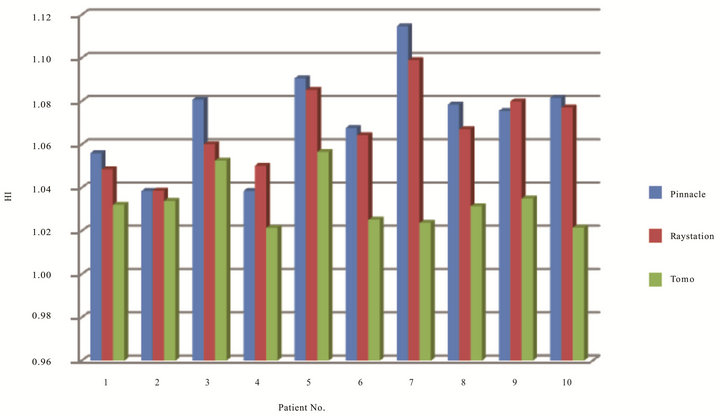
Figure 1. HI of ten patients on three TPS.
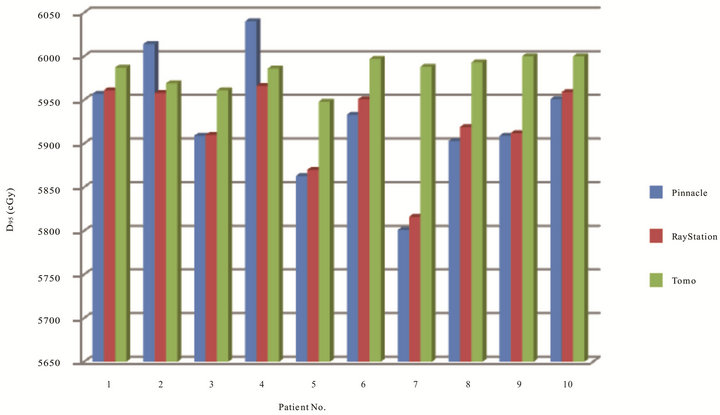
Figure 2. Dose coverage in cGy to 95% of PTV of 10 patients on three TPS.
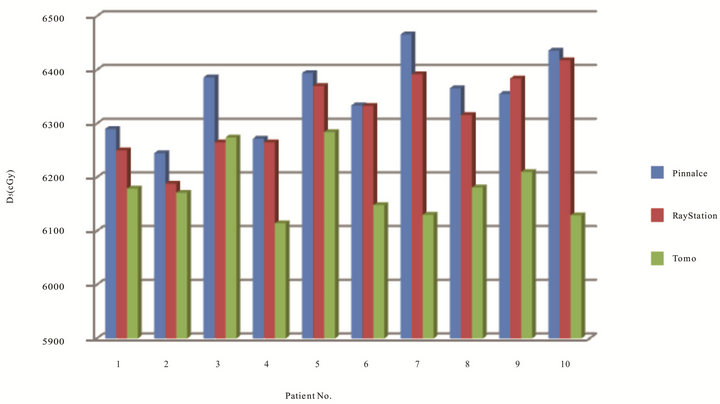
Figure 3. Dose in cGy to 5% of PTV of the ten patients optimized on three TPS.
motherapy had a better PTV coverage with steep dose fall offs.
3.3. Heart
Figure 5 has shown dose to 33% of heart of ten patients on three TPS. The range of D33 for Tomotherapy, Pinnacle, and RayStation was from 1.68 to 20.92 Gy, 1.75 to 23.08 Gy, and 1.25 to 22.21 Gy, respectively. Only five cases on Tomotherapy had lower heart dose. Table 3 also has shown mean dose and standard deviation of D33 and Dmean of heart. The range of Dmean for Tomotherapy, Pinnacle, and RayStation was from 1.84 to 20.23 Gy, 2.53 to 21.26 Gy, and 1.19 to 19.53 Gy, respectively. The mean dose to the heart is lowest for RayStation compare to Tomotherapy and Pinnacle. Statistically there was no significance for heart among three TPS. Figure 6 also has showed the DVH evaluation of heart in one of the ten cases which were all summarized in the tabular format with statistical indication.
3.4. Total Lung
Results in Figure 7 indicated volume of total lung receiving 20 Gy of ten patients on three TPS. The range of V20 for Tomotherapy, Pinnacle, and RayStation were from 13.32% to 30.30%, 17.01% to 33.2%, and 16.76% to 34.66%, respectively. The range of mean dose to total
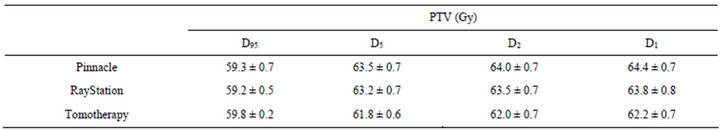
Table 2. Mean dose and standard deviation of PTV structure on three TPS.
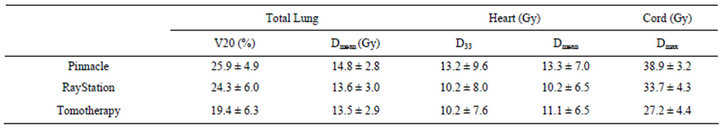
Table 3. Dose summary to total lung, heart, and cord, respectively.
 (a) (b) (c)
Figure 4. Axial, coronal, and sagittal views of color washed isodose of one patient. From left to right, (a) Pinnacle (b) RayStation and (c) Tomotherapy.
lung for Tomotherapy, Pinnacle, and RayStation were 10.17 to 18.49 Gy, 9.64 to 19.45 Gy, and 8.87 to 18.72 Gy, respectively. Table 3 again has shown mean and standard deviation of V20 and mean dose to total lung. Figure 8 shows the DVH evaluation of total lung. It has clearly indicated that Tomotherapy plan had the lowest percent volume of total lung to 20 Gy. A statistic significance was observed between Tomotherapy and Pinnacle planning (p = 0.018).
3.5. Cord
Figure 9 has shown dose to spinal cord at 1 cm3 volume of each patient in three TPS. The ranges of cord for Tomotherapy, Pinnacle and RayStation were 21.21 cGy to 32.89 Gy, 35.33 cGy to 45.25 Gy, 26.98 cGy to 40 Gy, respectively. Results have indicated that all cases on Tomotherapy had the lowest cord dose, followed by RayStation and Pinnacle. Table 3 has shown plans with Tomotherapy have the lowest cord dose at 1 cm3 com-
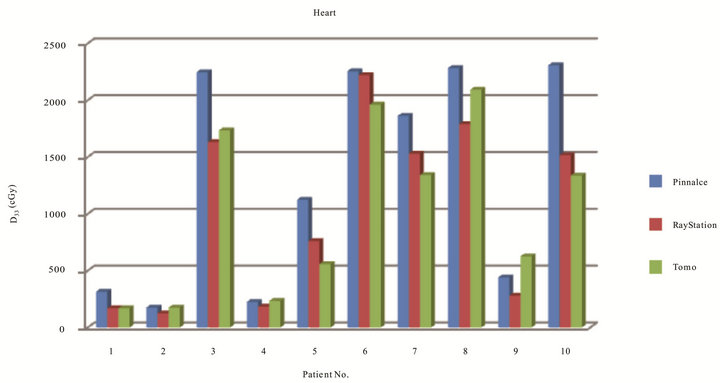
Figure 5. Dose in cGy to 5% of PTV of the ten patients optimized on three TPS.
pared to Pinnacle (p = 0.000) and RayStation (p = 0.003), and between Pinnacle and RayStation (p = 0.020).
4. Discussion
IMRT lung planning presents great challenges in the optimization process due to the approximated locations of critical organs. Parallel and serial critical structures also limit the tolerance doses. Of ten lung cases, Tomotherapy has achieved superior plans with better dose conformity and homogeneity, and it also shows lower dose to critical organs such as total lung and cord due to its optimization techniques with the agreement of studies from Scrimger et al. [22]. Tomotherapy with multiple beam entries (51 different beam angles) also made the optimization process easier to accomplish the planning goals. However, for Tomotherapy, the planning time was the longest compared to both Pinnacle and RayStation because the beamlets have to be pre-calculated before optimization. Our findings show that Tomotherapy planning delivered lower doses to 33% of heart in five cases, only two cases were with lower mean dose to heart but still under the tolerance dose with our clinical protocols. Dose to 33% of heart were calculated as the lowest for all patients on RayStation with Pareto based plan results compared to Pinnacle, the mean dose to heart on RayStation was lower for all except one case which Tomotherapy was lower and one case had the same dose. Based on the numerical analysis, there was no statistically significance for heart doses among Tomotherapy, Pinnacle, and RayStation.
As there is no literature currently available in comparison of the three treatment planning systems because RayStation is relatively new commercialized treatment planning system. To our knowledge, this study of dosimetric comparison of RayStation to Tomo and Pinnacle is the first investigation about the clinical planning differences. The three TPS currently co-existed in our department which presented great opportunities in IMRT dosimetric comparison and the clinical finding can be guidelines for further planning parameters selection with template implementation.
5. Conclusion
We have studied the dosimetric differences in ten randomly selected lung cases among Tomotherapy, Pinnacle, and RayStation planning platforms. Overall, Tomother-

Figure 6. DVH for PTV and heart of a typical patient with three planning results. PTV-Pink, Heart-Yellow.
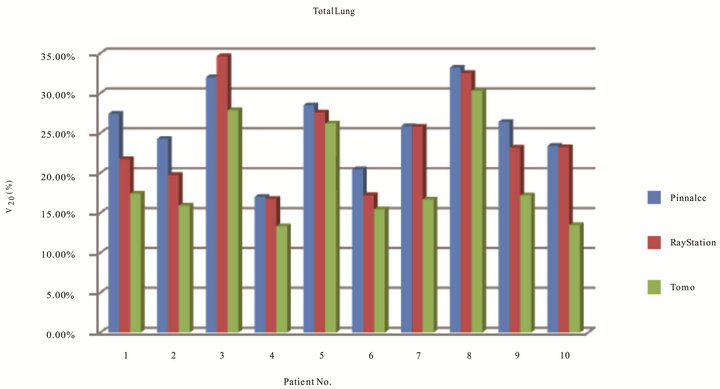
Figure 7. Total lung receiving 20 cGy of ten patients on three TPS.
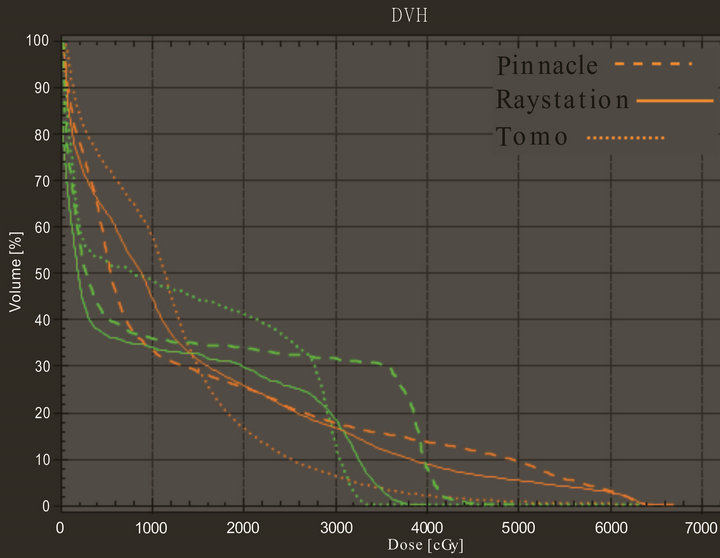
Figure 8. DVH comparison for total lung and cord for one of the patients on three TPS. Color green represents cord and orange represents total lung.
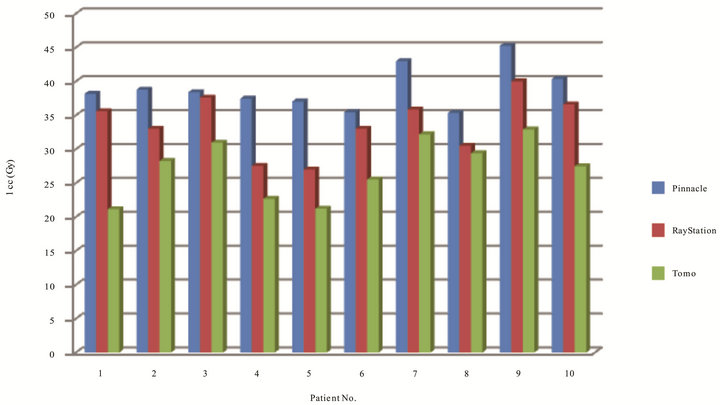
Figure 9. Dose to cord at 1 cm3 volume in Gy of ten patients on three TPS.
apy in general can achieve the best conformity and uniform coverage with fewer hot spots in target while sparing more critical structures such as total lungs, heart, and spinal cord among these three TPS based on current DVH analysis. Alternatively, RayStation unique MCO algorithm can achieve a better dose conformity and fewer hot spots in target, less dose to critical organs compare to Pinnacle’s DMPO approach. RayStation MCO Pareto based IMRT plans is helpful in determining the best optimized dosimetry with shorter planning time in real time update graphic view. The homogeneity indexes were about the same between RayStation and Pinnacle. All three planning system can produce adequate clinically deliverable treatment plans for lung cases in this study. A future investigation on changing of dose calculation grid sizes, different modulation factor, and pitch for the optimization on Tomotherapy is also recommended. Further analysis to optimize all cases with EUD based criteria will simplify the dose constraints in RayStation and Pinnacle. Initial investigation has shown that Ray-
Station do have potential to generate sets of optimized plans with easy manipulation. However, fine tuning the Pareto plans to generate acceptable dose limits to the critical organs in lung cases is also recommended for future direction.
REFERENCES
- T. Bortfeld, D. Kahler, T. Waldron and A. Boyer, “X-Ray Field Compensation with Multileaf Collimators,” International Journal of Radiation Oncology, Biology, Physics, Vol. 28, No. 3, 1994, pp. 723-730.
- C. Chui, T. LoSasso and S. Spirou, “Dose Calculation for Photon Beam with Intensity Modulation Generated by Dynamic Jaw or Multileaf Collimation,” Medical Physics, Vol. 21, No. 8, 1994, pp. 1237-1244. doi:10.1118/1.597206
- J. Galvin, X. Chen and R. Smith, “Combining Multileaf Field to Modualte Fluence Distributions,” International Journal of Radiation Oncology, Biology, Physics, Vol. 27, No. 3, 1993, pp. 697-705. doi:10.1016/0360-3016(93)90399-G
- P. Xia and L. Verhey, “Multileaf Collimation Leaf Sequencing Algorithm for Intensity Modulated Beams with Multiple Static Segments,” Medical Physics, Vol. 25, No. 8, 1998, pp. 1424-1434. doi:10.1118/1.598315
- W. Bar, M. Alber and F. Nusslin, “Fluence-Modulated Radiotherapy with an Optimization Integrated Sequencer,” Medical Physics, Vol. 13, No. 1, 2003, pp. 12-15.
- D. Shepard, M. Earl, X. Li and C. Yu, “Direct Aperature Optimization: A Turnkey Solution for Step-and-Shoot IMRT,” Medical Physics, Vol. 29, No. 6, 2002, pp. 1007- 1018. doi:10.1118/1.1477415
- B. Hardemark, A, Liander, H. Rehbinder and J. Lӧf, “Direct Machine Parameter Optimization with RayMachine in Pinnacle,” RaySearch White Paper, 2003.
- J. Lӧf, “Development of a General Framework for Optimization of Radiation Therapy,” Ph.D. Thesis, Stockholm University, 2000. http://www.raysearchlabs.com/upload/Specialists/Articles_reports/JohanLofsThesis_LoRes.pdf
- J. Rehbinder and H. Lӧf, “Inverse Planning Optimization with RayMachine in Pinnacle,” RaySearch White Paper, 2002. http://www.raysearchlabs.com/upload/Specialists/Solutions/White%20paper%20RayMachine.pdf
- S. Tung, M. Lii, P. Lai and P. Wong, “Clinical Evaluation of Direct Machine Parameter Optimization Algorithm for Head and Neck IMRT Treatment,” Medical Physics, Vol. 32, No. 6, 2005, p. 1971. doi:10.1118/1.1997765
- T. Hong, D. Craft, F. Carlsson and T. Bortfeld, “Multicriteria Optimization in Intensity-Modulated Radaition Therapy Treatment Planning for Locally Advanced Cancer of the Pancreatic Head,” International Journal of Radiation Oncology, Biology, Physics, Vol. 72, No. 4, 2008, pp. 1208-1214. doi:10.1016/j.ijrobp.2008.07.015
- D. Craft, W. Chen, E. Salari, T. Madden and T. Bortfeld, “Multicriteria Optimization,” 2012. http://gray.mgh.harvard.edu/index.php?option=com_content&view=article&id=39:multicriteria-optimization&catid=7:optimization&Itemid=15
- A. Niemierko, “Reporting and Analyzing Dose Distributions: A Concept of Equivalent Uniform Dose,” Medical Physics, Vol. 24, No. 1, 1997, pp. 103-110.
- Q. Wu, R. Mohan, A. Niemierko and R. Schmidt-Ullrich, “Optimization of Intensity-Modulated Radiotherapy Plans Based on the Equivalent Uniform Dose,” International Journal of Radiation Oncology, Biology, Physics, Vol. 52, No. 1, 2002, pp. 224-235.
- T. Holmes and T. Mackie, “Tomotherapy,” In: J. G. Webster, Ed., Encyclopedia of Medical Devices and Instrumentation, 2nd Edition, John Wiley & Sons, New York, 2006.
- T. R. Mackie, “Tomotherapy: A New Concept for the Delivery of Dynamic Conformatl Radiothearpy,” Medical Physics, Vol. 20, No. 6, 1993, pp. 1709-1719. doi:10.1118/1.596958
- T. Mackie, J. Balog, K. Ruchala, D. Shepard, S. Aldridge and E. Fitchard, “Radiation Therapy Treatment Optimization,” Seminars in Radiation Oncology, Vol. 9, No. 1, 1999, pp. 108-117,. doi:10.1016/S1053-4296(99)80058-7
- T. Mackie, J. Balog, K. Ruchala, D. Shepard, S. Aldridge, E. Fitchard, P. Reckwerdt, G. Olivera, T. McNutt and M. Mehta, “Tomotherapy,” Seminars in Radiation Oncology, Vol. 9, No. 1, 1999, pp. 108-117. doi:10.1016/S1053-4296(99)80058-7
- J. Welsh, R. Patel, M. Ritter, P. Harari, T. Mackie and M. Mehta, “Helical Tomotherapy: An Innovative Technology and Approach to Radiation Therapy,” Technology in Cancer Research and Treatment, Vol. 1, No. 4, 2002, pp. 311-316.
- D. Shepard, G. Olivera and P. Reckwerdt, “Iterative Approaches to Dose Optimization in Tomotherapy,” Physics in Medicine and Biology, Vol. 45, No. 1, 2000, pp. 69-90. doi:10.1088/0031-9155/45/1/306
- T. Knoos, I. Kristensen and P. Nilsson, “Volumetric and Dosimetric Evaluation of Radiation Treatment Plans: Radiation Conformity Index,” International Journal of Radiation Oncology, Biology, Physics, Vol. 42, No. 5, 1998, pp. 1169-1176. doi:10.1016/S0360-3016(98)00239-9
- R. Scrimger, W. Tome, G. Olivera, P. Reckwerdt, M. Mehta and J. Fowler, “Reduction in Radiation Dose to Lung and Other Normal Tissues Using Helical Tomotherapy to Treat Lung Cancer, in Comparison to Conventional Field Arrangements,” American Journal of Clinical Oncology, Vol. 26, No. 1, 2003, pp. 70-78. doi:10.1097/00000421-200302000-00014