Open Journal of Energy Efficiency
Vol.3 No.1(2014), Article ID:43602,11 pages DOI:10.4236/ojee.2014.31002
Issues with Philippines Road Transport Energy Consumption
Sudhir Gota
Independent Consultant, Bangalore, India
Email: sudhirgota@gmail.com
Copyright © 2014 by author and Scientific Research Publishing Inc.
This work is licensed under the Creative Commons Attribution International License (CC BY).
http://creativecommons.org/licenses/by/4.0/


Received 26 November 2013; revised 26 December 2013; accepted 5 January 2014
ABSTRACT
Department of Energy of Philippines statistics reveal that from 2000 to 2010, the road transport fuel consumption and corresponding CO2 emissions have grown modestly with an annual growth rate of 0.5%. This modest growth is in contrast to the rapid increase in vehicle numbers, economic activity and in absence of implementation of comprehensive sustainable transport policies and options. The main objective of this research is to correlate official fuel consumption data (i.e. top-down) with bottom up quantifications and provide relevant policy recommendations. Based on the assessment of transport demand variables and review of policies and strategies, fuel consumption in transport sector was found to be growing at a much faster rate when compared to official estimates. Use of official data on fuel consumption in road transport sector may lead to serious errors. This has huge implications on policies and investments.
Keywords:Philippines; Fuel Economy; ASIF; MRT; Transport Emissions

1. Introduction
Latest data from Department of Energy (DOE) [1] in the Philippines on fuel consumption in road transport sector suggests that road transport energy consumption has slowed down over the past decade with an annual growth rate of only 0.5% from 2000 to 2010 (6.7 MTOE in 2000 to 7.1 MTOE in 2010) when compared with 11% growth between 1990 to 1996 (Figure 1). Further, it is interesting to observe varied behavior of gasoline and diesel consumption. Gasoline consumption over the same period has increased by nearly 1%, i.e. increase from 2.7 to 3 MTOE while diesel consumption has not shown any increase and has remained constant around 4 MTOE from 2000 to 2010.
This is in contrast to findings from Department of Transport and Communications (DOTC) and investigations
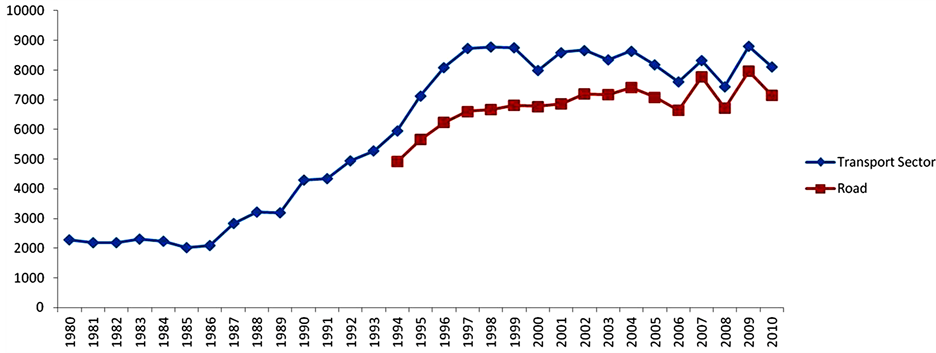
Figure 1. Transport sector and road sector fuel consumption based on DOE statistics.
done by other experts and agencies. Latest document on Clean Technology Fund Plan [2] for Philippines reports that road transport carbon emissions (or fuel consumption) have increased at 6% - 10% annually from 1990 to 2007 and this growth has resulted in relative doubling of transport share in the total emissions. Road sector dominates other modes in Philippines and accounts for nearly 88% share over the past decade.
Department of Energy of Philippines quantifies fuel consumption in road sector based on the top down approach or “Fuel Sold Approach”. The total fuel sold is considered as a balance of primary fuels produced, plus imports, minus exports, minus international bunkers and minus net changes in stocks. This consumption value relates to use for the transport activity itself and not for consumption by the transport company for non-transport purposes and off-road activities. The top down approach is generally considered more accurate than the bottom-up (A-S-I-F) approach for quantifying overall consumption. Top down assessment gives the consumption values but does not explain the reasons behind the consumption values [3] .
The main objective of this research is to correlate official fuel consumption data (i.e. top-down) with bottom up quantifications and provide relevant policy recommendations.
The structure of the paper is as follows: In Section 2, various bottom-up studies in Philippines are summarized and this discussion is followed by a review of road transport issues related to bottom-up modelling in Section 3. In Section 4, analysis is carried out to investigate possible implications of fuel price increase and implementation of sustainable transport policies and options on fuel consumption. This discussion is concluded by correlating top down fuel consumption data with bottom-up estimates and possible scenarios are tested to derive recommendations.
2. Bottom-Up Quantifications
Over the past decade, three major bottom-up studies have been carried out in Philippines road transport sector to quantify fuel consumption and CO2 emissions as summarized below.
Ÿ World Bank led “A strategic approach to climate change in the Philippines: an assessment of low-carbon interventions in the transport and power sectors” [4] . This study estimated that the road transport GHG emissions have been increasing at an average growth rate of 3.1% and the diesel consumption from 2007 to 2010 was growing at 6%.
Ÿ Asian Development Bank led “Transport and Carbon Dioxide Emissions: Forecasts, Options Analysis, and Evaluation” [5] . This study estimated increase in road transport CO2 emissions from 2005 to 2015 at around 2% and emissions from 2015 to 2035 to grow at 5.8%.
Ÿ Clean Air Asia led “Accessing Asia: Air Pollution and Greenhouse Gas Emissions from Road Transport and Electricity” [6] . The annual average growth rate from 2000 to 2010 was estimated to be 3.3%. Diesel consumption was estimated to growing at around 3%.
Clearly based on the assessments, the fuel consumption and emissions between 2000 and 2010 are growing at higher rates when compared to top down assessments. This aspect is dissected in more detail in subsequent sections.
3. Road Transport Growth in the Philippines
Table 1 captures growth in some of the transport parameters in the Philippines [7] [8] .
Growing economy with increase in income levels coupled with existing low motorization rates is influencing high growth in vehicle ownership. Vehicle ownership over 2000 to 2010 has increased at 6%. Motorization Index i.e. vehicles for 1000 people increased from 48 to 72 within a decade. Among vehicles, the fastest growing mode was two wheelers with nearly 11% annual increase while buses increased only marginally (Table 2). This is a pointer towards public transport especially buses not being effective enough in Philippines to address growing demand for mobility. Increase in number of driving licences (3.6%) point towards increase in number of drivers in the Philippines road network.

Table 1. Transport indicators and data from Philippines.
Table 2. Vehicle growth rate in Philippines.
Interestingly, growth in diesel vehicles (5.3%) is outpacing gasoline vehicles (4%). Diesel cars are growing at 18% while gasoline cars are growing at only 2%. Diesel Cars share in total cars has grown from 4% to 14% within a decade. This growth however contradicts the official diesel consumption values as the diesel consumption has remained stagnant.
Infrastructure growth in terms of road kilometres has been slow but the major emphasis has been on paving road rather than on capacity increase. The increase in road bridges length establishes that infrastructure supply improvements have been carried out with sustained investment to try to accommodate traffic growth. Infrastructure expenditure as a share of the Philippines’ GDP declined from 5.6% in 1998 to 3.6% in 2003 [9] and it has only averaged 2.7% of the GDP over the last decade.
In absence of subsidies, fuel prices especially gasoline has increased at 11% annually which can impact travel demand and vehicle ownership. This impact is discussed in more detail in the subsequent section.
4. Analysis
Based on the above overview, there could be now only two possible logical reasons which could explain the low reported growth of fuel consumption in Philippines road transport sector, 1) High increase in fuel prices and 2) impact of sustainable transport policies in reducing travel demand. Impacts of both these parameters are investigated below.
4.1. Impact of Fuel Price
Though, lot of research has been carried out in developed countries on fuel price elasticity, there is no literature available in Philippines on travel demand changes due to fuel price increase. Fuel price increase over a period of time will impact travel demand and fuel consumption in variety of ways i.e. change in origin or destination (relocation), increase in occupancy, increase in transit use, decrease in driving distance, increase in fuel efficiency, change in vehicle type (Ownership) etc.
Fuel prices have increased all across Asia though not in uniformity due to subsidies provided by the governments to artificially control the fuel prices. Philippines government passed the “Oil Deregulation Law” in 1998 and removed the subsidies in the fuel and deregulated the industry. With increased fuel prices, the cost of driving increased thereby having indirect influence on ownership. Economic linear regression of vehicle ownership with GDP per capita from 1981 to 2010 establishes impact on ownership of vehicles. The linear elasticity of ownership with GDP/capita decreased post 1998 as fuel prices started increasing at a faster rate as shown in below Table 3.
Clearly, the elasticity of car ownership with GDP/capita changes over the 1999-2010 period which means that with each unit increase in GDP/capita, the demand for car ownership has reduced in 1999-2010 period when compared with 1981-1998. It has been established that Car ownership growth rates rapidly accelerate at incomes around $3000 to $5000 per capita per year and then typically peak around $10,000, followed by a slow decline under business-as-usual approach [10] . Clearly, increased gasoline prices can be an important factor here. Interestingly, demand for diesel cars also increased over this period. Also, large increase in two wheeler ownerships can be directly attributed to higher fuel efficiencies and low ownership and driving costs. Faster economic growth over last decade has attracted higher increase in number of vehicles. In case the fuel prices would not have increased, the vehicle growth would have been higher.
In order to understand the travel behavior changes with fuel price, MRT ridership variation is considered as a proxy variable and compared with monthly fuel price. Main hypothesis here is that MRT ridership reflects two growth scenarios, i.e. due to annual increase in ridership and due to shift of people from motorized modes to MRT due to fuel price increase.
By observing daily ridership per month variation with fuel price increase over 6 years [7] [8] , no clear trend could be established which could support theory of low growth in fuel consumption in road transport sector due to high degree of shift to MRT. The peak gasoline price was observed in 2008 where it crossed 60 pesos. Ridership did not reflect drastic increase due to shift of people from private modes to MRT during high gasoline prices. Clearly, fuel price increase does not appear to make any significant reductions in travel demand (Figure 2).
4.2. Impact of Sustainable Transport Policies
Significant reduction in travel demand due to appropriate policy initiatives can lead to modest growth in fuel consumption. The Philippine National Energy Efficiency and Conservation Program is probably the most ambitious plan launched between 2000 to 2010 period. This plan launched in 2004 was targeted to contribute towards the achievement of 60% energy self-sufficiency by 2010 and the avoidance of cumulative 50.9 million tons of
Table 3. Elasticity of ownership with GDP/capita.
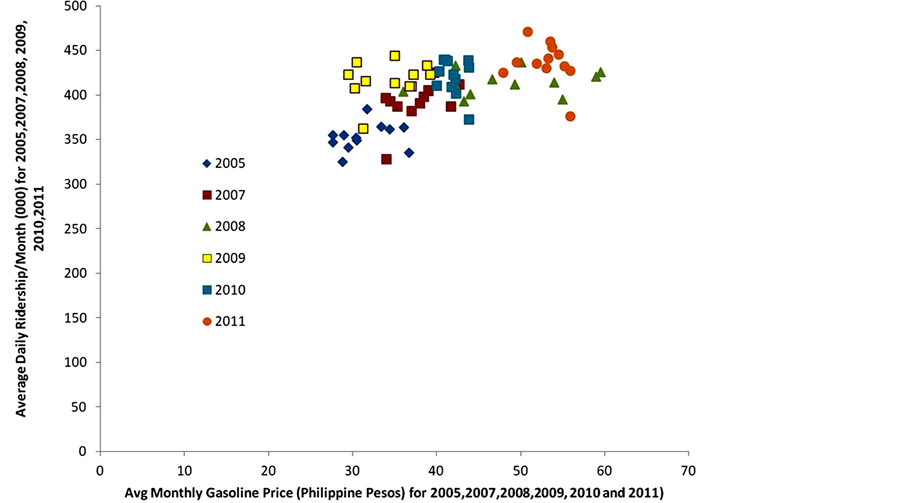
Figure 2. MRT3 daily ridership/month vs. gasoline fuel prices.
CO2 emissions for the period 2005 to 2014.
By 2012, Department of Energy had reported high impact of this initiative based on modest growth in total fuel consumption with savings in magnitude of 28 million barrels of oil [11] when compared with the baseline. Under this plan, the main initiative for transport sector was ‘fuel economy drive’ initiative to improve fuel efficiency of vehicles and to capture baseline data on fuel economy of vehicles. These drives are conducted mainly to educate people on ways to improve driving and to raise awareness on fuel efficiency of different types of vehicles on actual traffic conditions.
Philippines also initiated an additional information campaign, the “Road Transport Patrol”, by Institutionalizing a Committee on Fuel Conservation and Efficiency in Road Transport (CFCERT) in 1998 [12] . This program targets a 5% reduction in fuel consumption by awareness raising and training. The activities focus on the campaign that provides consumers with information on the efficient use of fuel through proper vehicle maintenance, efficient driving and values formation among drivers through seminar/workshops, and the use of the media.
In order to decrease the carbon content of fuel and to reduce import of fuel, Philippines implemented Biofuels Act 2006. The main objective was to include 5% ethanol by 2009. However, this impact is accounted for in total fuel consumption in transport sector.
However, all the programs discussed above are mainly to improve fuel efficiency of vehicles by information campaigns, awareness raising and alternative fuel. The plans discussed above do not include development and implementation of fuel economy standards and radical improvement in public transport sector. Further, the main focus is on improving fuel efficiency through campaigns and not on reducing actual travel activity. Based on literature review, prominent initiatives over 1990-2013 are summarized below with qualitative assessment of impact over 2000-2010 and long-term impact (Table 4). The policies and strategies ratings have been rated based on following approach using expert judgement:
Ÿ “N” refers to no reductionŸ “L” refers to low, i.e. less than 10,000 tons/yearŸ “M” refers to medium i.e. less than 100,000 tons/year and greater than 10,000 tons/year, and
Ÿ “H” refers to High i.e. greater than 100,000 tons/year.
As seen from the policy scorecard, majority of actions over 2000-2010 resulted in “No” to “Low” impact. In terms of Avoid-Shift-Improve approach [13] , Philippines is mainly targeting improve aspect followed by shift and avoid. In Metro Manila, the main emphasis is on improving speeds. Philippines development plan- 2011-2016 quotes speed improvement as a primary indicator in measuring success of Metro Manila’s
Table 4. Policy/strategy scorecard for Philippines.
transport strategy [14] .
It quotes targets to measure success of Philippines development plan 2011-2016.
Ÿ Decreased travel time from 2.17 min/km to 1.57 min/km in 2016Ÿ Increase in travel speed from 27.79 Km/hour to 38.2 km/hour by 2016Ÿ Increased occupancy due to reduction of city buses-air-conditioned from 40 to 65, non-air-conditioned from 37 to 45.
Clearly, Philippines is mainly targeting “Improve” approach without actually implementing fuel economy standards for light and heavy duty vehicles. Improvements in energy efficiency as planned by the Philippines government does not compensate for increasing travel demand (i.e. increase in vehicles) and thus to expect modest growth in fuel consumption as stated by official statistics may not be realistic. By correlating top-down and bottom-up estimates and by developing possible scenarios, this aspect is investigated in detail below.
4.3. Correlating Top-Down and Bottom-Up Estimates for Energy Consumption
Increasing vehicle population without implementation of fuel economy standards, would lead to high fuel consumption provided the average travel per vehicle does not reduce sufficiently. In order to investigate this, first input parameters in each bottom-up study is compared and a plausible scenario is developed based on CAA study [6] by modifying the travel activity data to achieve official gasoline and diesel consumption values.
Clean Air Asia’s [6] gasoline estimates over the initial three years (2000-2003) closely follow the official fuel consumption values. But with increasing vehicle numbers and assumed constant travel, gap between estimates increase as the official statistics show marginal increase. Interestingly, the World Bank estimates closely follow the official gasoline consumption values after 2007 (Figure 3).
The World Bank [4] study uses a very low travel activity (2800 km/year) and low fuel efficiency (9 kmpl) for two and three wheelers which may compensate impact of each other in ASIF framework, i.e. vehicle with low efficiency with low travel activity may not make a huge difference in overall computations. In order to match the official gasoline consumption scenario, the average vehicle activity was reduced while keeping fuel efficiency constant in the CAA study and the results are tabulated below Table 5.
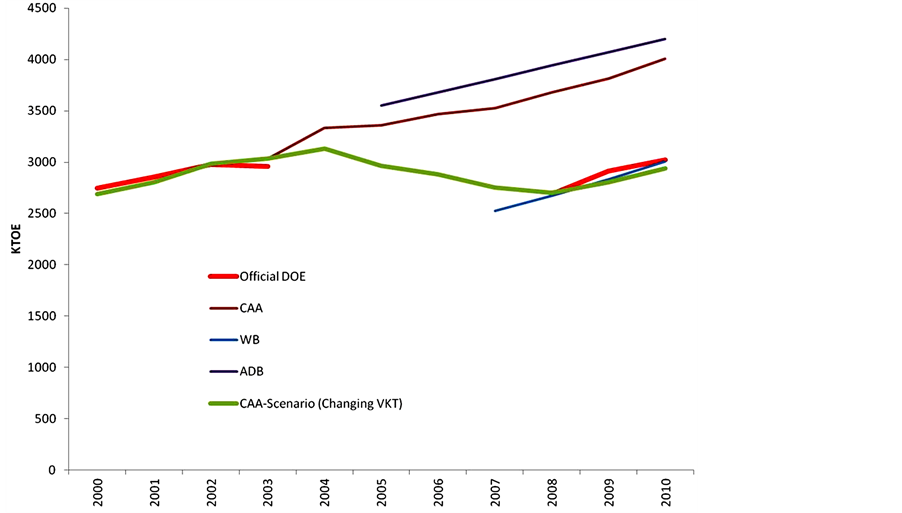
Figure 3. Gasoline consumption values from top-down and bottom-up assessments.
Table 5. Assumed average vehicle travel comparison (CAA vs. Scenario).
In scenario of modest gasoline consumption growth, over the years, the vehicles need to drastically reduce the travel distance to compensate for the impact of increased vehicle numbers and replicate official low gasoline consumption growth values. In terms of modes, tricycles and jeepneys are the most “sensitive” modes considering high numbers and low fuel efficiency. In order to simulate official gasoline consumption, the average travel of vehicle needs to reduce from 2004 to 2008 at an annual rate of 6%. This is a very significant change in travel behavior. Independent research carried out suggests that on an average, tricycles operate around 70 to 80 km/day or 25,000 km/year [15] and jeepneys operate around 100 - 150 km/day which translates to a minimum of 35,000 KM/year. Clearly, drastic reduction in vehicle activity of tricycles and jeepneys cannot be really expected and hence gasoline consumptions values are set to grow rapidly. There is no argument in favor of 6% annual reduction in average vehicle travel from 2004 to 2008 as the main drivers to travel growth, i.e. population, fuel price and GDP/capita have not shown any huge variation over the last decade.
It is also very difficult to correlate diesel consumption values from top-down with bottom-up estimates as there is a big difference among all studies and with top-down assessments. The official diesel consumption values in road transport sector show huge variation (Figure 4). Below table presents one of the plausible scenario’s with different average travel vehicle. In order to simulate official fuel consumption, the average travel of vehicle needs to reduce (when compared to CAA study) from 2000-2003 by 6%, 2004-2007 no change, 2008 by 6% and 2009-2010 by 4% (see below table).
Further, excluding diesel cars, all the other modes are commercial in nature and to assume drastic reduction in vehicle activity is difficult as it is directly linked with livelihood. The most sensitive mode is Jeepney (UV) and to assume Jeepney which travels around 120 - 150 Km/day to travel only around 24,000 km/Year is not appropriate (Table 6).
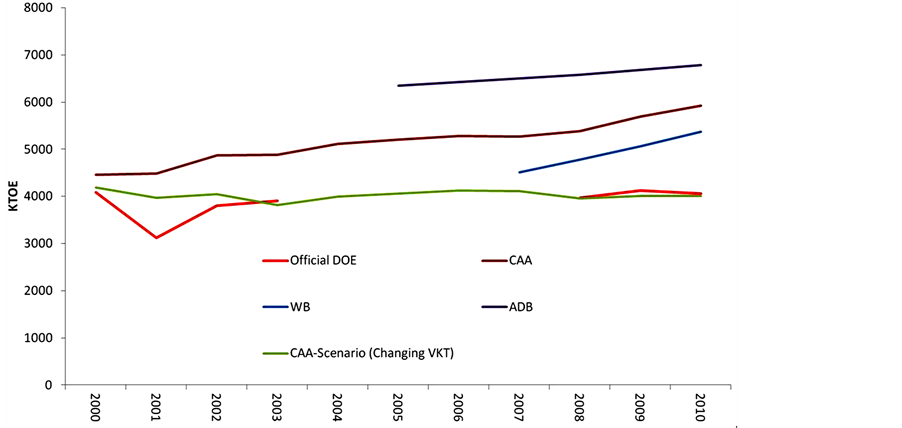
Figure 4. Diesel consumption values from top-down and bottom-up assessments.
Table 6. Assumed average vehicle travel comparison (CAA vs. Scenario).
Freight movement on roads is powered by diesel. Freight movement is growing fast with demand outstripping truck supply. Increased freight movement and demand for road freight would call for increased diesel consumption and thus to assume that diesel consumption is stagnant in Philippines is not realistic. Also to assume Trucks travelling at 17,000 annual travel is not logical. In comparison, in countries like China and India, freight operators need to operate trucks for at least 50,000 kilometres annually in order to make profits.
Clearly, diesel consumption has increased in Philippines road transport sector and there can be no arguments in favour of diesel commercial vehicles reducing average annual travel by 4% - 6% over many years.
Combining all the top down and bottom up estimates and forecasts on Road transport CO2 emissions results in single figure makes an interesting reading (Figure 5). General approach of top-down future projection of fuel consumption in Philippines is mainly by correlating vehicle growth intensity with official fuel consumption and by interpolating future vehicle growth using population and GDP forecasts. Since the vehicle number is correlated with lower values of fuel consumption based on misleading statistics, the estimates for future are lower when compared with normal bottom-up projections of extending the travel demand for future (linking vehicle ownership with GDP/capita) and computing fuel consumption and emissions.
By 2030, top down estimates project road transport CO2 emissions to be around 30 - 40 million tons while bottom-up estimates project around 80 - 100 million tons. The variation is more than 200% and a serious cause of concern as it impacts plans and strategies of two different ministries. DOE (energy) mainly focuses on topdown projections while DOTC (transport) focuses on bottom-up estimates.
4.4. Comparison with Other Countries
Using the fuel consumption values from top-down and correlating this with bottom-up travel demand would allow calculation of transport efficiencies, i.e. passenger transport efficiency g/pkm (grams of CO2 per passenger kilometer travel) and freight transport efficiency g/tkm (grams of CO2 per freight kilometer travel).
Philippines road transport efficiencies are showing rapid improvement in annual efficiency i.e. −1.9% (passenger) and −2.9% (freight) due to rapid increase in transport demand with modest growth in official fuel consumption values. The 2010 values for CO2 g/pkm and CO2 g/tkm are 29 and 63.
By comparing Philippines with other countries as estimated by ICCT [16] , it can be observed that efficiency of Philippines transport sector is very high when compared with other countries. While passenger transport efficiency levels are reasonable to certain degree (i.e. comparison with India, China and Asia Pacific), freight transport efficiency is highest among the world which is an unrealistic conclusion. Country like Japan which has implemented a host of strategies to reduce travel demand and which has implemented stringent fuel economy standards has managed to improve annual passenger transport efficiency by −1.6% and annual freight transport efficiency by −1.4%.
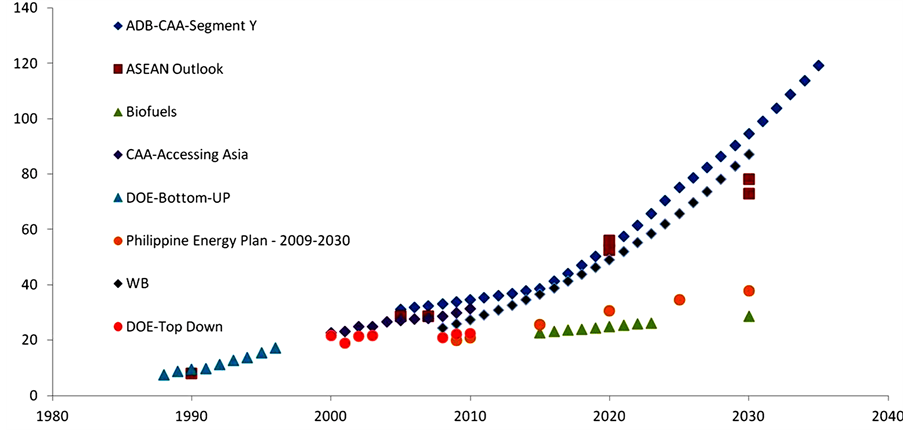
Figure 5. Philippines road transport CO2 emissions.
5. Fuel Smuggling
In terms of top-down data, the data for transport fuel consumption is predominantly dependent upon the time liness, accuracy and consistency of data provided by oil companies and other organizations. There are chances that fuel sales do not capture the impact of fuel smuggled into the system. Though, no hard scientific data exists on the quantum of fuel smuggling in Philippines, but experts agree on high magnitude of fuel smuggling in Philippines due to geographical location i.e. surrounded by countries with lower fuel price due to subsidies. Fuel smuggling in Philippines is carried out by using variety of methods such as-Small oil tankers load diesel or gasoline from a mother ship stationed in international waters, misdeclaration (declaring finished product as raw products), diversion and undervaluation of oil imparts to reduce taxes [17] .
Petron Corporation, the country’s largest oil company has reported that one out of every three litres of gasoline or diesel sold in the Philippines is smuggled [18] which can result in nearly 1 billion USD loss of revenues [19] . This is a very high estimate and serious loss to the economy. Government is now planning to constitute a high profile agency/task force to reduce fuel smuggling in the country and restrict importation of certain goods (such as fuel) at accredited ports.
A 33% of increase in fuel consumption can lead to proportionate increase in carbon emissions of transport sector and make Philippines transport sector more fossil fuel and carbon intensive. Based on earlier discussions, there are chances that more diesel is smuggled inside Philippines when compared with gasoline as diesel consumption is stagnant while gasoline consumption is showing some increase.
6. Conclusions
Top down estimates are not realistic with ground conditions in Philippines. With increasing vehicle sales, no restrictions to travel activity and without implementation of fuel economy targets, fuel consumption increase cannot be expected to be modest. Philippines have not yet implemented fuel economy standards nor has it implemented very aggressive “avoid” and “shift” strategies.
Clearly, the official statistics on road transport fuel consumption do not provide enough justification and insights on the implication of the growing travel demand on fuel consumption and carbon emissions. Among the fuel types, the variation between top-down and bottom-up is much more intensive in diesel when compared with gasoline.
Current modeling done by Department of Energy and Department of Transportation and Communications [2] point to different conclusions with regards to energy consumption projections in transport sector. There needs to greater collaboration between DOE and DOTC in addressing the growth in fuel consumption as it may impact plans and strategies of each organization. Targets being set against unrealistic fuel consumption values may not be productive for transport sector in Philippines.
Bottom-up estimates can be made much more reliable by providing good data especially on tricycles, jeepneys and trucks. These are the most sensitive modes in terms of fuel consumption. In longer term, Philippines need to provide a baseline on fuel efficiency values and travel activity based on vehicle sales. For planning vehicle fuel economy targets this data would be critical.
Acknowledgements
This work is supported by the Lee Schipper Memorial Foundation/WRI Fund. Author would like to acknowledge support by Clean Air Asia for providing data and Mr. Stefan Bakker and Mr. Bert Fabian for review support.
References
- Department of Energy, Philippines (2012) Total Final Energy Consumption by Sector. http://www.doe.gov.ph/policy-planning/key-energy-statistics-2010/1234-energy-consumption2
- Department of Energy, Philippines (2011) Clean Technology Fund (CTF) Country Investment Plan (CIP) for the Philippines. http://www.doe.gov.ph/doe_files/pdf/Researchers_Reports/CTF%20Investment%20Plan%20Philippines%20final.pdf
- Schipper, L. and Marie-Lilliu, C. (1999) Transportation and CO2 Emissions: Flexing the Link a Path for the World Bank. World Bank Environmentally and Socially Sustainable Development. World Bank, Washington DC.
- George, E., Samuel, C., Nabor, G. and Cindy, T. (2010) A Strategic Approach to Climate Change in the Philippines: An Assessment of Low-Carbon Interventions in the Transport and Power Sectors. World Bank, Washington DC.
- Schipper, L., Fabian, H. and Leather, J. (2009) Transport and Carbon Dioxide Emissions: Forecasts, Options Analysis, and Evaluation. ADB Sustainable Development Working Paper Series.
- Clean Air Asia (2012) Accessing Asia: Air Pollution and Greenhouse Gas Emissions Indicators for Road Transport and Electricity. Clean Air Asia, Manila.
- Land Transport Office, Department of Transport and Communications—Philippines (2013) Annual Reports. http://www.lto.gov.ph/index.php/publication/statistical-reports
- National Statistical Coordination Board (2013) Statistical Reports. http://www.nscb.gov.ph/stattables/
- OECD (2013) Structural Policy Challenges for Southeast Asian Countries, Philippines. South East Asian Outlook, OECD.
- Dargay, J., Gately, D. and Sommer, M. (2007) Vehicle Ownership and Income Growth, Worldwide: 1960-2030. Energy Journal.
- Inquirer (2012) Philippine Energy Conservation Program Saves 28 M Barrels of Oil. http://business.inquirer.net/51977/philippine-energy-conservation-program-saves-28-m-barrels-of-oil
- Department of Energy, Philippines. Road Transport Patrol. http://www2.doe.gov.ph/Efficiency/road_transport_patrol.htm
- Dalkmann, H. and Brannigan, C. (2007) Transport and Climate Change. Module 5e: Sustainable Transport: A Sourcebook for Policy-Makers in Developing Cities. Deutsche Gesellschaft Fuer Technische Zusammenarbeit (GTZ), Eschborn.
- National Economic and Development Authority (2011) Philippines Development Plan-2011-2016. Government of the Philippines. http://www.gov.ph/2011/05/27/philippine-development-plan-2011-2016
- Asian Development Bank (2012) Fast Facts on E-Trikes. http://www.adb.org/sites/default/files/news/fast-facts-etrikes.pdf
- Façanha, C., Blumberg, K. and Miller, J. (2012) Global Transportation Energy and Climate Roadmap. The International Council for Clean Transportation.
- Asia News Network (2013) Oil Smuggling in Philippines. http://www.asianewsnet.net/Oil-smuggling-in-Philippines-45195.html
- Manila Standard Today (2013) A Second Look at Oil Derugulation. http://manilastandardtoday.com/2013/04/16/a-second-look-at-oil-deregulation
- International Energy Agency (2013) World Energy Outlook Special Report 2013: Southeast Asia Energy Outlook. http://www.iea.org/publications/freepublications/publication/name,43534,en.html