Modern Research in Inflammation
Vol.2 No.4(2013), Article ID:39009,6 pages DOI:10.4236/mri.2013.24009
MR imaging of cheek lesions of Kimura’s disease: Focusing on the signal abnormalities and the relationship with superficial musculoaponeurotic systems
![]()
1Department of Radiology, Showa University Northern Yokohama Hospital, Yokohama, Japan; *Corresponding Author: rad.ukisu@gmail.com
2Department of Otolaryngology, Showa University Northern Yokohama Hospital, Yokohama, Japan
Copyright © 2013 Ryutarou Ukisu et al. This is an open access article distributed under the Creative Commons Attribution License, which permits unrestricted use, distribution, and reproduction in any medium, provided the original work is properly cited.
Received 4 September 2013; revised 2 October 2013; accepted 10 October 2013
Keywords: Kimura’s Disease; SMAS (Superficial Musculoaponeurotic Systems); MRI
ABSTRACT
Background and Purpose: Kimura’s Disease (KD) is a rare benign chronic eosinophlic inflammatory disorder, characterized by angiolymphoid proliferation with peripheral eosinophilia and elevated serum immunoglobulin E. Most lesions occur in the head and neck regions. To the best of our knowledge, the relationship between subcutaneous cheek lesion of KD and the surrounding structures including superficial musculoaponeurotic systems (SMAS) has never been reported. The purpose of this study was to describe MR imaging findings of cheek subcutaneous lesion of KD and adjacent SMAS. Materials and Methods: Seven cheek subcutaneous lesions of 5 patients histopathologically proved KD were evaluated. We retrospectively evaluated the MR imaging findings of subcutaneous lesions for signal intensity in each imaging sequence, the border of the lesions, and appearance of SMAS. Results: All cheek lesions were displacing normal fat tissue. These lesions showed ill-defined border (7/7), slightly high signal intensity on T1-weighted images (7/7), and intermediate (1/7) or high signal intensity (6/7) on T2-weighted images. Cheek lesions were enhanced by intravenous injection of gadolinium to signal intensity close to that of fat tissue (3/4), and in one case, the avid enhancement of the mass was seen (1/4). All lesions attached to the outer surface of SMAS, however, only one out of 7 lesions distributed below the SMAS without tearing of the layers. SMAS below the lesion showed high signal intensity on T2-weighted images in two lesions (2/7). Conclusion: KD should be included in the differential diagnosis when a cheek mass presents with non-specific signal intensities and irregular border, which attaches to but does not interrupt SMAS on MR imaging.
1. INTRODUCTION
Kimura’s Disease (KD) is a rare chronic inflammatory disorder, characterized by angiolymphoid proliferation with peripheral eosinophilia and elevated serum immunoglobulin E (IgE). The cause and pathogenesis remain unclear. Most lesions occur in the head and neck regions. Malignant transformation has never been reported; however, the local recurrence is frequent [1,2]. Fine needle aspiration or biopsy is indispensable in making prompt diagnosis. However, their ability of making histologic diagnosis appears to be limited in some cases [3]. KD often produces subcutaneous nodules with frequently associated regional lymphadenopathy. Oguz et al. first reported abnormal intensity of fat tissue on magnetic resonance (MR) imaging studies [4]. However, the relationship between cheek subcutaneous nodule of KD and surrounding structures including superficial musculoaponeurotic systems (SMAS), i.e., fibromuscular and aponeurotic layers of the superficial component of the face, has never been reported. Therefore, in order to help make correct imaging diagnosis of KD, we reviewed cheek subcutaneous lesions and adjacent SMAS on MR examinations. The purpose of this study was to determine the MR imaging findings of KD, primarily focusing on the subcutaneous cheek lesions as well as adjacent SMAS.
2. MATERIALS AND METHODS
2.1. Patients and Clinical Data
A total of 7 cheek subcutaneous nodules of 5 patients with KD (all Japanese male, 33 - 51 years old, mean age 36.2) were evaluated (Table 1). All patients presented with painless facial mass, and underwent MR imaging studies. One of the patients had a history of left parotidectomy due to KD 4 years ago (Case 3). Medical records and MR images were available for each patient. Biopsy and/or surgical removal were performed in all patients, and Kimura’s disease was histopathologically proved.
2.2. Imaging Techniques
MR imaging was performed with a 1.5-Tesla (Signa Exite, Horizon LX or Twin-speed, GE Medical Systems, Milwaukee, WI) or 0.5-Tesla (Signa Contour, GE Medical Systems, Milwaukee, WI) super-conducting unit equipped with conventional head coils. All images were obtained in the axial plane. In all cases, multiplanar spinecho T1-weighted images (TR/TE/NEX, 460 - 600 ms/4.1 - 14 ms/1, 12 - 20 axial sections with a 5 - 7 mm section thickness and a 1-mm intersection gap, 320 × 256 - 192 × 128 matrix and a 180 - 200-mm field of view) and fast spin-echo T2-weighted images were acquired (TR/TE/
NEX, 3740 - 5500 ms/78 - 120.3 ms/1, 12 - 20 axial sections with a 5 - 7 mm section thickness and a 1-mm intersection gap, 512 × 512 - 256 × 192 matrix, and a 160 - 180-mm field of view). Gadolinium-enhanced spin-echo T1-weighted images were obtained in 4 lesions 90 - 120 seconds after the bolus administration of 0.1 mmol/kg gadopentetate dimeglumine (Magnevist; Bayer Healthcare, Berlin, Germany). Fat-saturated contrast-enhanced T1-weighted spin-echo image (TR/TE/NEX, 350 - 860 ms/7 - 20 ms/1, 12 - 20 axial and/or coronal sections with a 5 - 6 mm section thickness and a 1 - 1.5 mm intersection gap, 320 × 256 - 256 × 224 matrix, and a 20-mm field of view) were obtained 300 - 480 seconds after contrast medium injection.
2.3. Image Analysis
We retrospectively reviewed the MR images in terms of the location, size, and border of the lesion. Furthermore, we also reviewed signal intensity on each sequence, degree of enhancement, and the appearance of SMAS (Figure 1) adjacent to the lesion. The size of the lesion was measured at the greatest dimension. The border of the lesion was classified into smooth or not. The MR signal intensity of the lesions was compared qualitatively with those of the adjacent normal muscles. The degree of enhancement within the lesion was subjectively assessed as none, moderate, and avid. SMAS, which can be considered as a sheet of tissue that extends from the neck into the face [5] was evaluated for the presence of interruption and abnormal signal intensity adjacent to the lesion on each sequence.
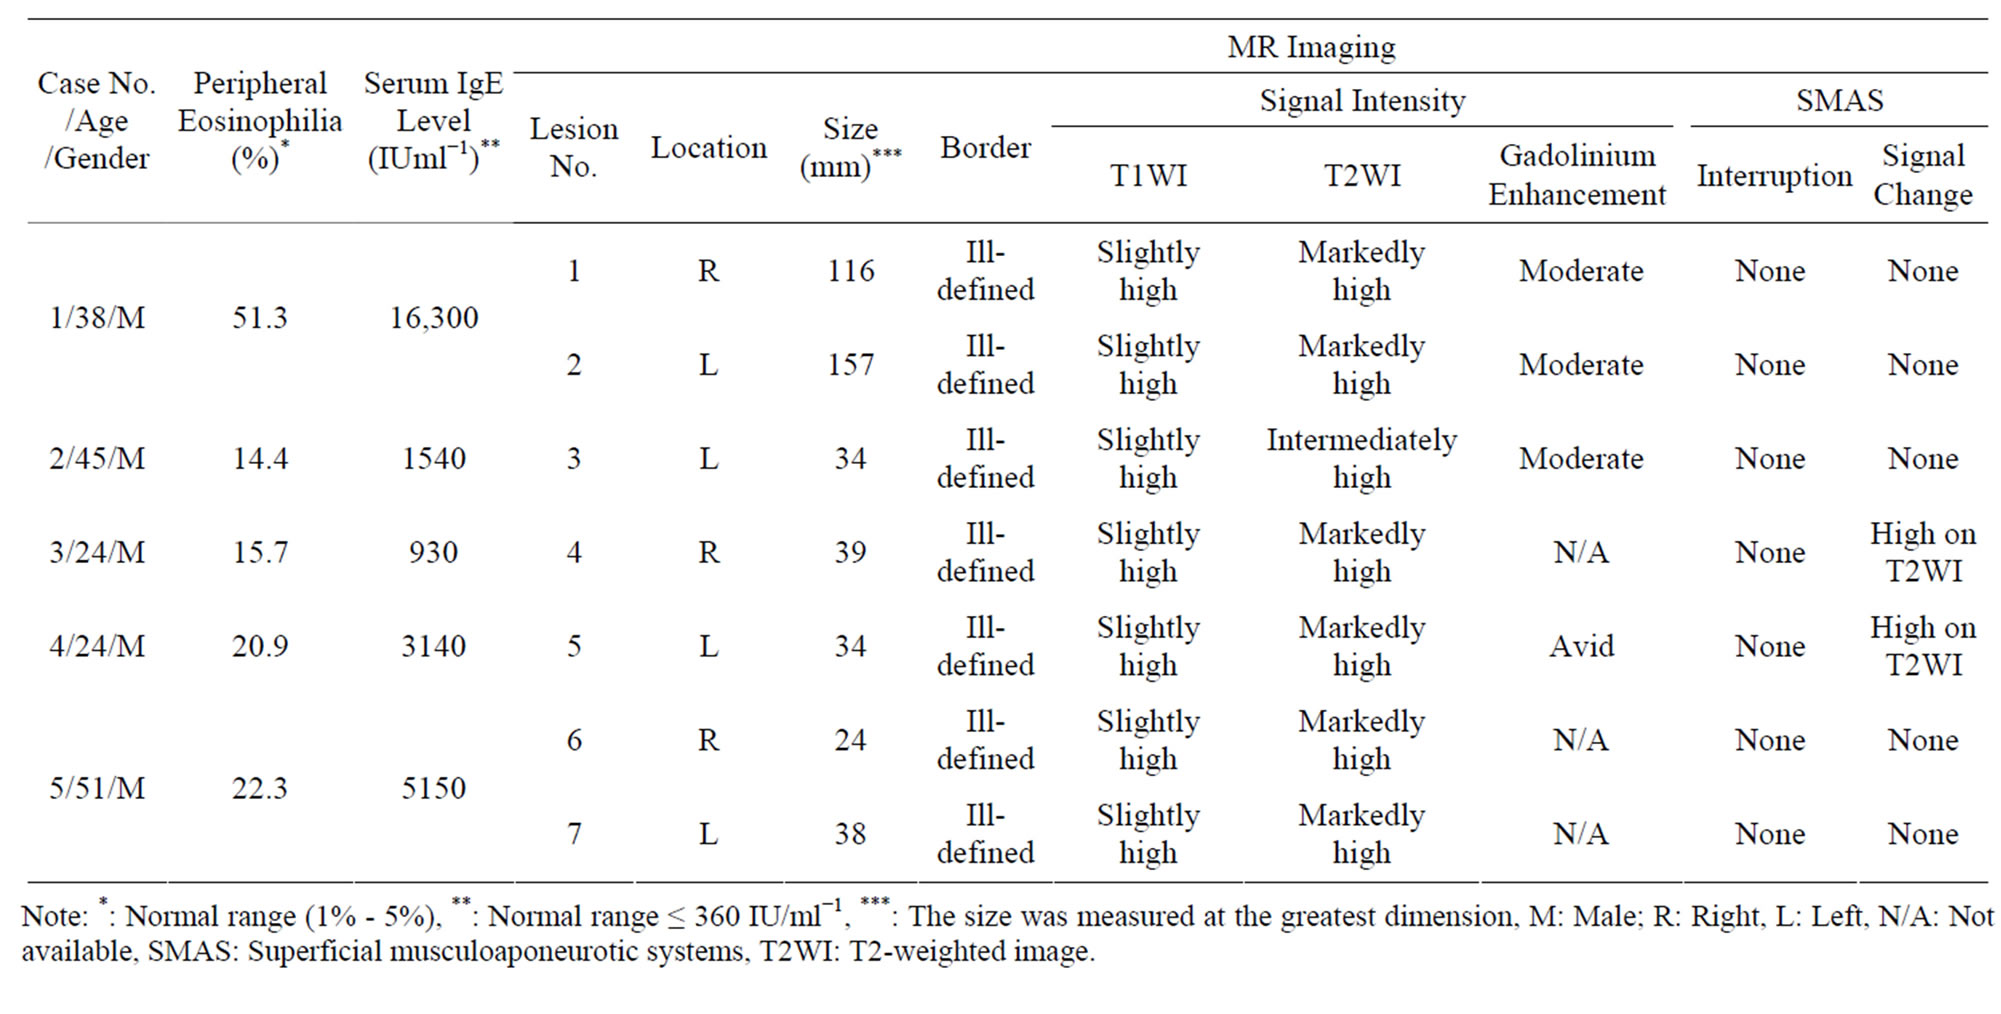
Table 1. Patients’ data and MR imaging findings.
Note: *: Normal range (1% - 5%), **: Normal range ≤ 360 IU/ml−1, ***: The size was measured at the greatest dimension, M: Male; R: Right, L: Left, N/A: Not available, SMAS: Superficial musculoaponeurotic systems, T2WI: T2-weighted image.
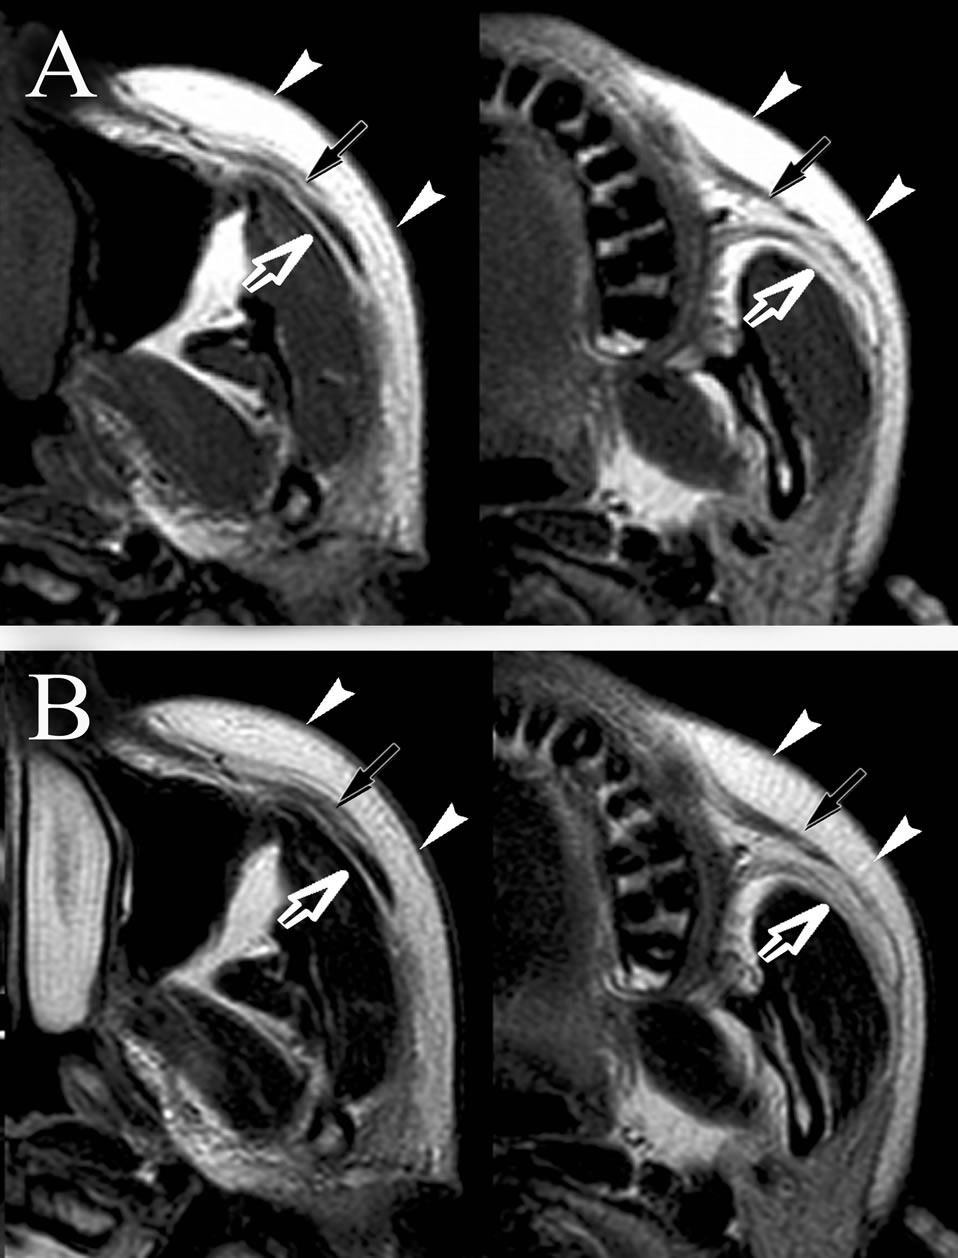
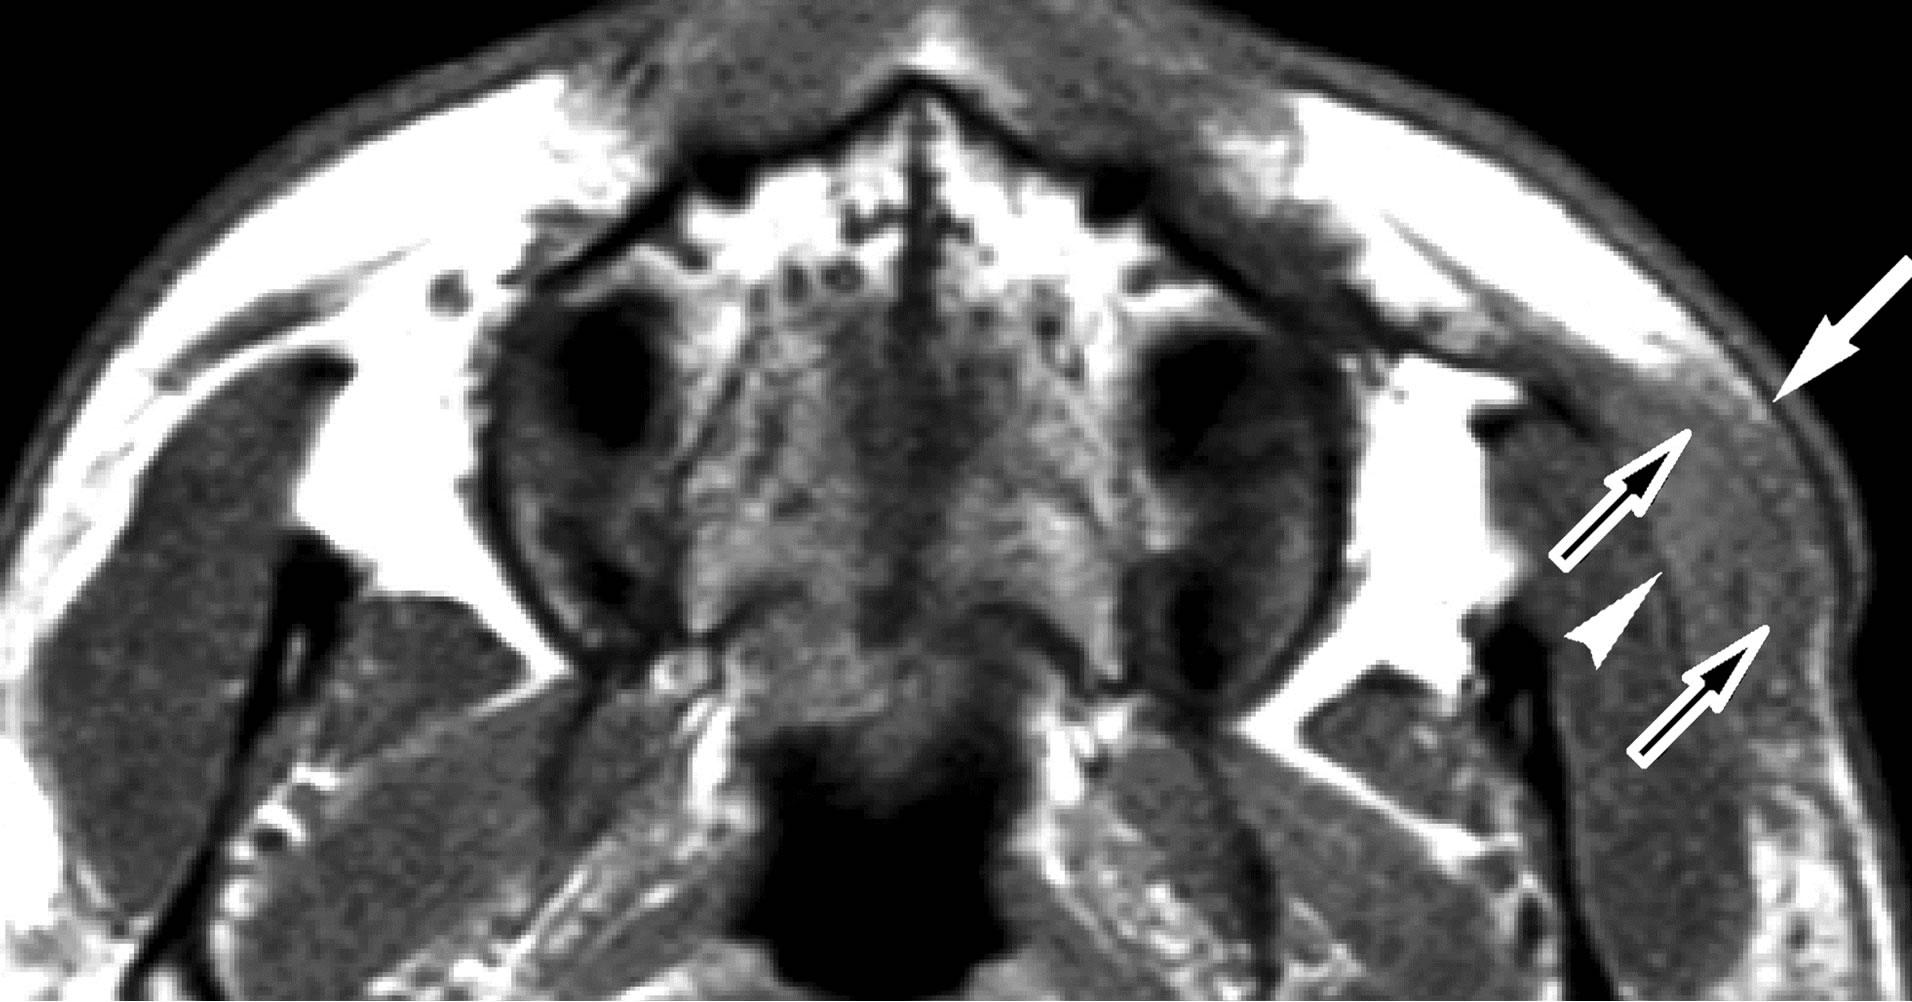
Figure 1. Normal appearance of SMAS on MR imaging. T1- weighted (A, TR/TE = 440 ms/12 ms) and T2-weighted image (B, TR/TE = 4500 ms/101 ms) at the level of middle (left) and bottom (right) of maxillary sinus. Note that the SMAS (arrows) reveals curvilinear low intensity on T1- and T2-weighted images. SMAS separates fat tissue between subcutaneous region (arrowheads) and buccal space (open arrows) very clearly.
3. RESULTS
Patient data and the MR imaging findings are summarized in Table 1. Peripheral eosinophilia and elevated serum IgE levels were present in all patients. In two patients, the cheek lesions were seen bilaterally. The size of the lesions ranged from 24 to 157 mm in greatest diameter with a mean of 61 mm. All lesions distributed as if replacing normal fat tissue (7/7). These lesions showed ill-defined border (7/7), slightly high signal intensity on T1-weighted images (7/7), and intermediate (1/7) or markedly high signal intensity (6/7) on T2-weighted images. All lesions attached to the outer surface of SMAS (7/7), however, only one out of 7 lesions distributed below the SMAS without tearing of the layers (1/7). Cheek lesions were enhanced by intravenous injection of gadolinium with signal intensity increased to that of fat tissue (moderate enhancement, 3/4), and in one case, avid enhancement of the mass was seen (1/4). In lesion 4 and 5, SMAS adjacent to the mass also showed high signal intensity without interruption of fascial structure on T2- weighted image (2/7). In lesion 3, the mass revealed slightly high signal intensity with ill-defined border on T1-weighted image. On T2-weighted image, this lesion showed intermediately signal intensity without any change of SMAS. On gadolinium-enhanced T1-weighted image, moderate enhancement corresponded to the lesion was seen (Figure 2). In lesion 5, the lesion showed slightly high signal intensity, and distributed in the subcutaneous cheek as well as buccal fat underlying the SMAS on T1- weighted image. SMAS between the subcutaneous and buccal lesion was clearly seen as thin low signal layer. On T2-weighted image, the mass showed homogeneous high signal intensity. SMAS adjacent to the mass shows
 (a)
(a)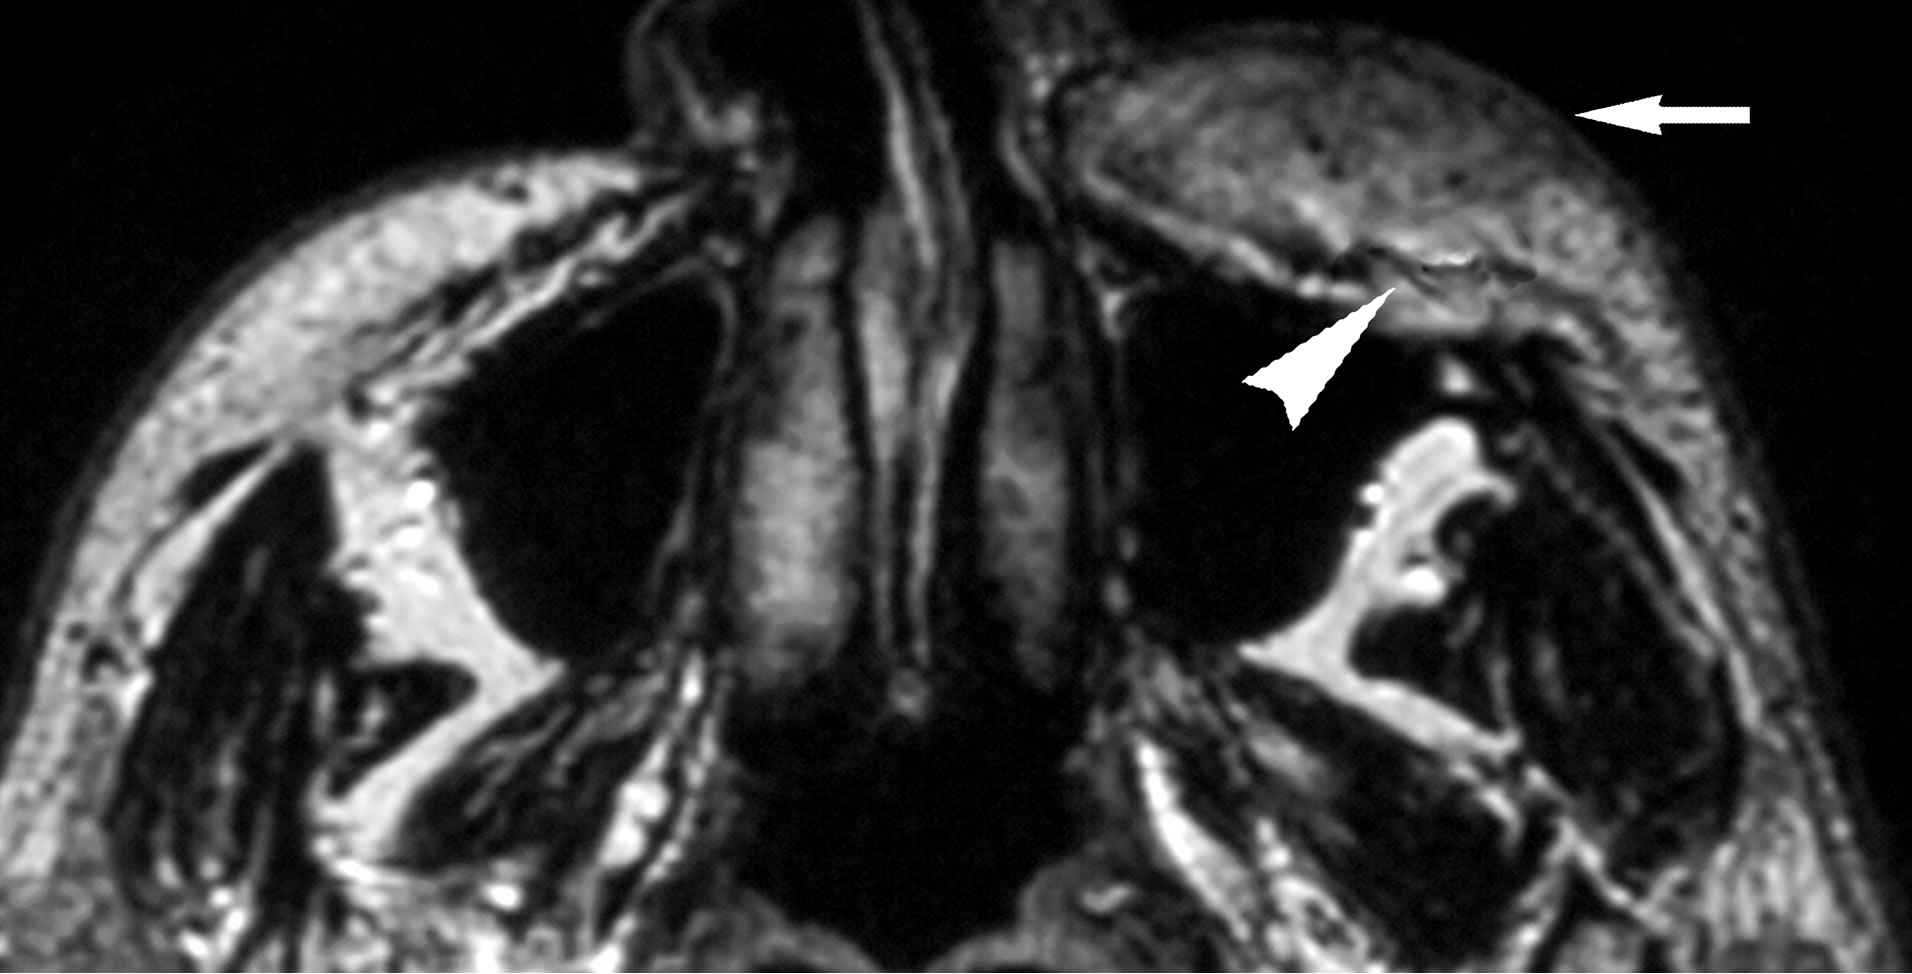 (b)
(b)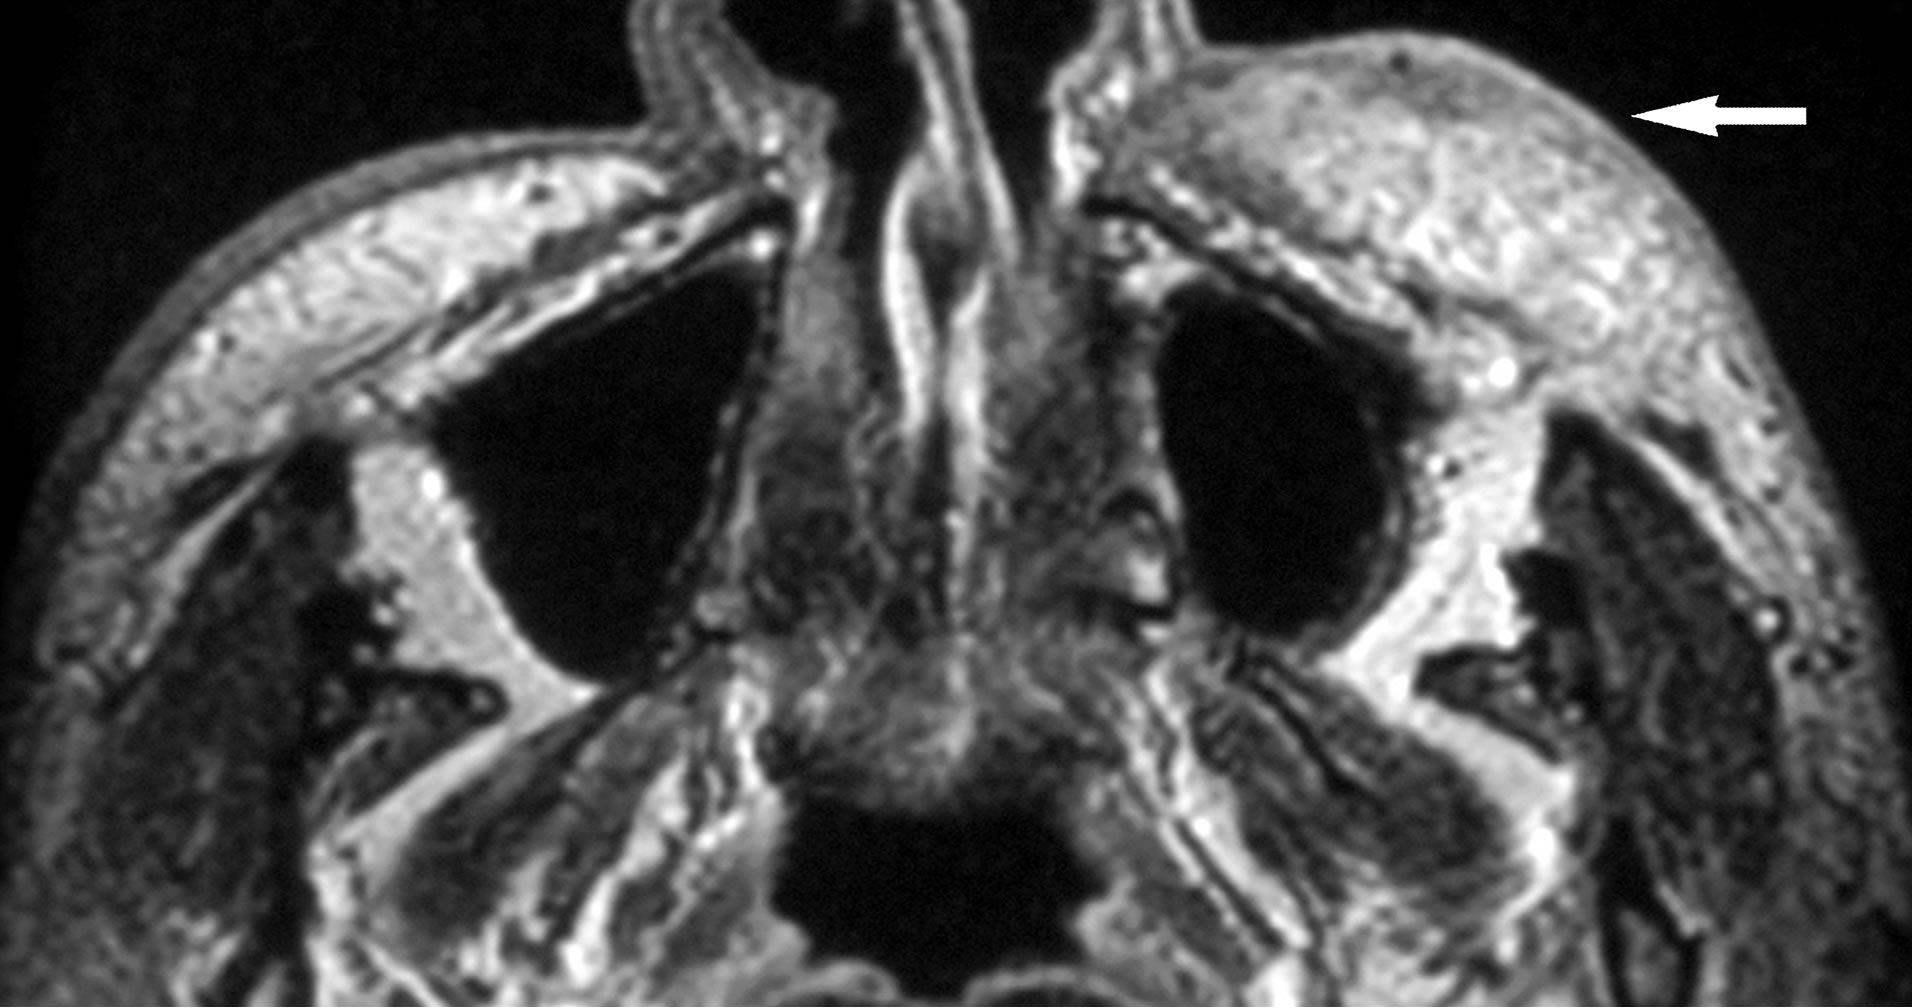 (c)
(c)
Figure 2. (a) Lesion 3. 45-year-old male with KD. On T1- weighted MR image (TR/TE = 460 ms/14 ms), the mass shows higher signal intensity (arrow) than the masticator muscle (open arrow); (b) On T2-weighted image (TR/TE = 3000 ms/96 ms), the mass reveals intermediate signal intensity (arrow) without interruption of SMAS (arrowhead); (c) Gadolinium-enhanced T1-weighted images (TR/TE = 460 ms/14 ms) shows that the mass is moderately enhanced with ill-defined border (arrow).
high signal intensity, however, this musculoaponeurotic system showed no interruption. On gadolinium-enhanced fat-suppressed T1-weighted image, the mass showed avid and homogeneous enhancement (Figure 3).
4. DISCUSSION
KD is a chronic inflammatory disorder, and most le-
 (a)
(a)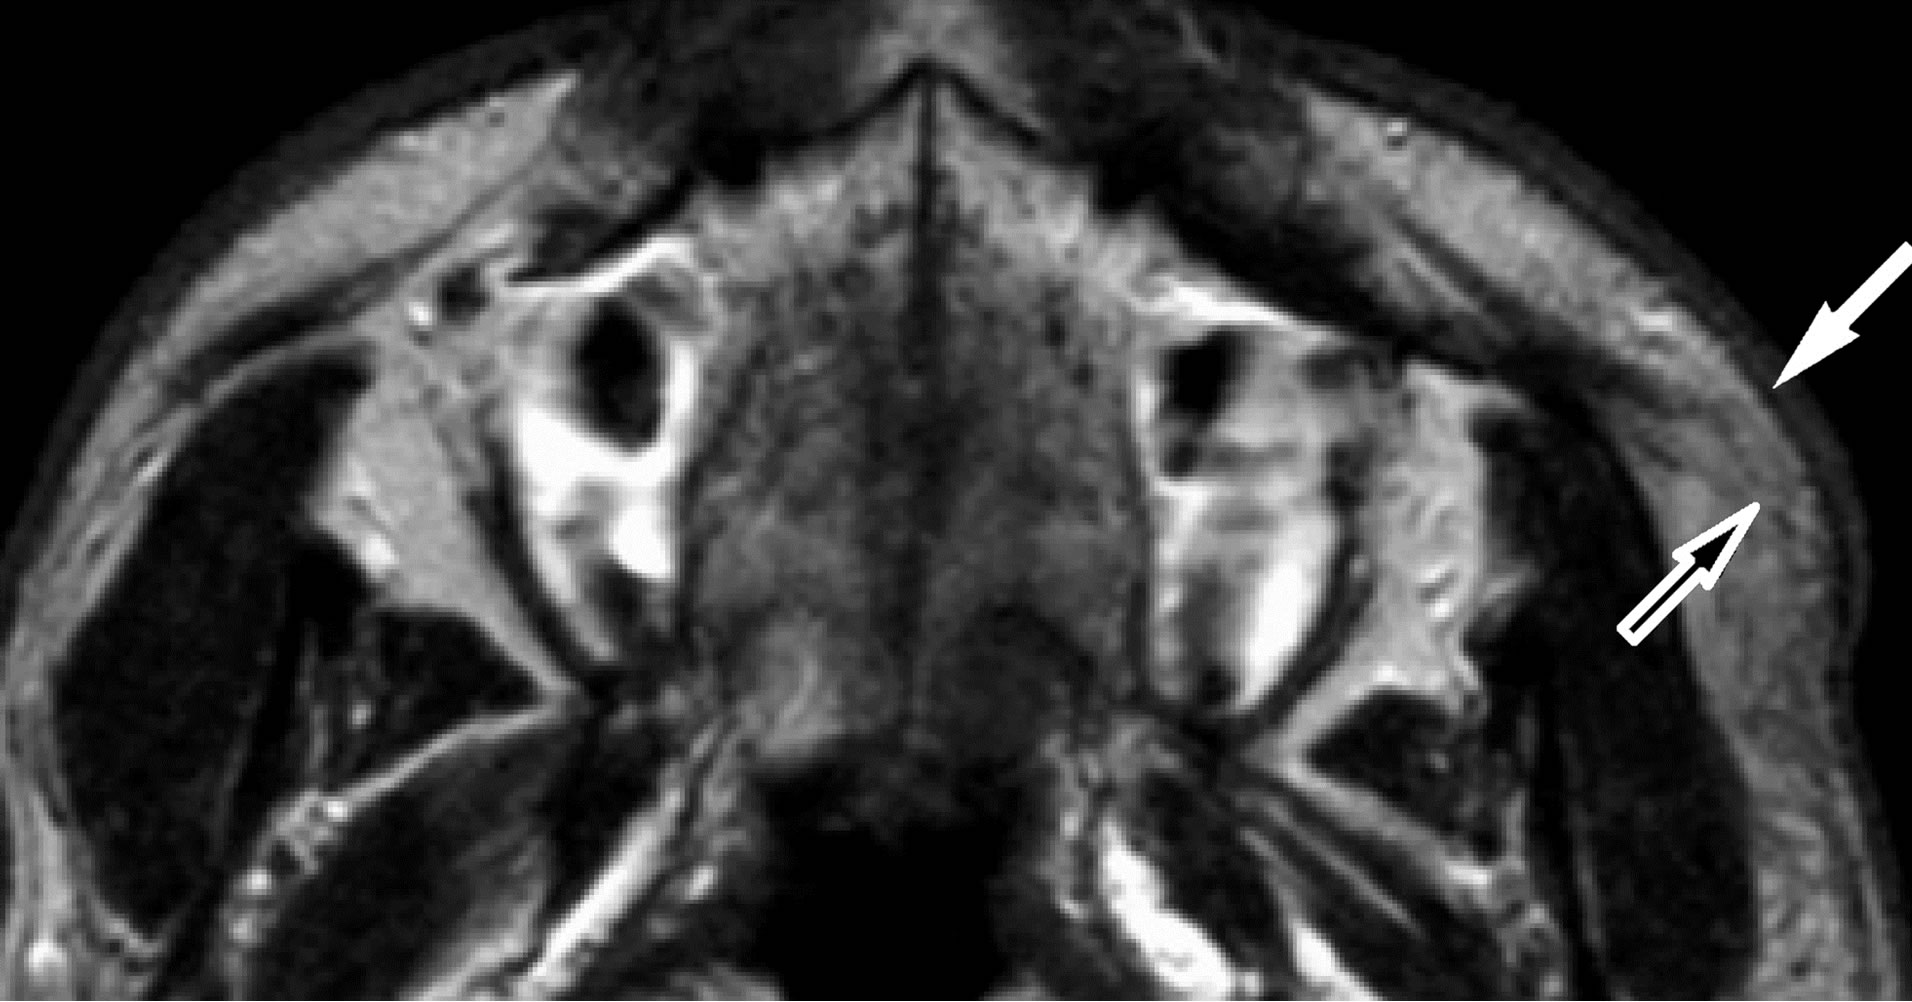 (b)
(b)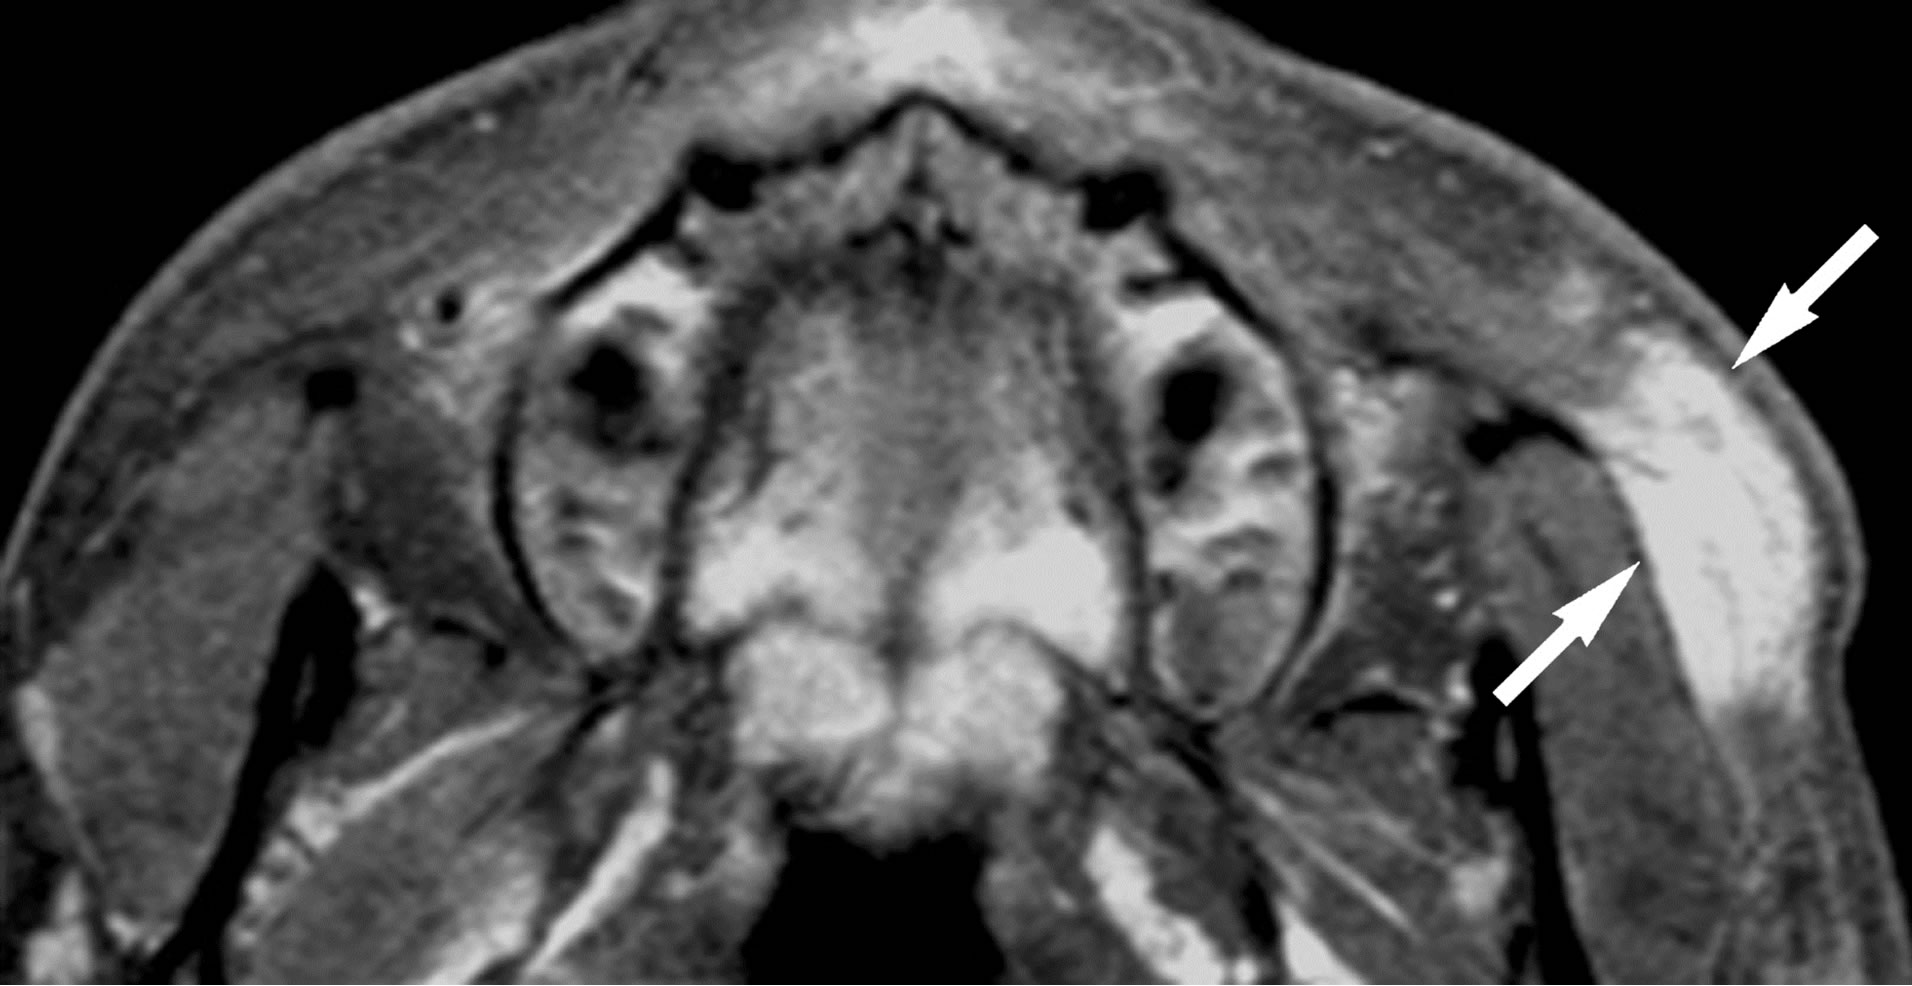 (c)
(c)
Figure 3. (a) Lesion 5. A 24-year-old male with KD. On T1- weighted MR image (TR/TE = 460 ms/14 ms), the mass shows slightly high signal intensity than that of muscle (arrow). The lesion distributes in the subcutaneous cheek as well as buccal fat (arrowhead). SMAS adjacent to the mass is clearly seen as thin low signal intensity (open arrows); (b) T2-weighted image (TR/TE = 3000 ms/96ms) shows the mass as high signal intensity (arrow). Although SMAS adjacent to the mass shows high signal intensity, no interruption of this musculoaponeurotic system is noted (open arrow); (c) On gadolinium-enhanced fatsuppressed T1-weighted images (TR/TE = 460 ms/14ms, fatsuppression), the mass shows avid and homogenous enhancement (arrows).
sions can be seen in the head and neck region. It affects the Oriental population, primarily of Chinese or Japanese extraction. The disease has a male predominance (87%), and mostly occurs during the second and the third decades of life. The lesions are commonly found in soft tissues, the major salivary glands with lymphnodes being frequently involved. Peripheral blood eosinophilia (10% - 70%) and an elevated serum IgE level (800 - 35,000 IU/ml) are seen [1,2,6]. Parka et al. evaluated CT and MR imaging findings of KD in 28 patients, and they found a total of 52 non-nodal lesions in the head and neck. The parotid and periparotid area were the most frequent location of KD (69%), while the cheek area involvement was only 11.5% [6].
The histologic features of KD are proliferation of folliculoid structures with infiltration by mainly eosinophils, some plasma cells, lymphocytes, and mast cells. Also, some degree of vascular proliferation and fibrosis can be observed. The treatment of KD is not well-established, although surgical resection is often the initial treatment of choice. However, complete resection is difficult because of infiltrative nature of the disease, and recurrence is common [2,7]. Other therapeutic options include irradiation therapy with or without systemic corticosteroids, cytotoxic agents, cyclosporine, and pentoxifylline [6,7]. Although this entity is a benign condition, the clinical course is often slowly progressive. Symptoms may fluctuate during long periods of years, sometimes the therapeutic effects are transient, and a definitive treatment method has not been established.
There are several reports on MR imaging of KD. Multiple lesions are common, and sometimes are distributed symmetrically. On T1-weighted images, the lesions of KD show various signal intensities. On T2-weighted images, they usually show high signal intensities [4,8-12]. In most cases, the degree of gadolinium-enhancement on T1-weighted images is intermediate to avid. The variability in the signal intensity on enhanced or unenhanced MR images is thought to be attributed to the different degrees of fibrosis and vascular proliferation of individual lesion [13]. The MR findings of cheek KD lesions observed in the present study were in line with the previous reports.
There have been no reports which documented the appearance of SMAS and cheek mass of KD patients. SMAS is defined as one continuous and organized fibrous network in the face connecting the facial muscles with the dermis, and consists of a three-dimensional architecture of collagen fibers, elastic fibers, fat cells, and muscle fiber [5,14]. The lesions of KD tend to infiltrate into surrounding fat tissue [4,6], therefore, diffuse loss of T1-weighted normal hyperintensities of fat suggests that the lesions grow and infiltrate as if they replace the normal fat tissue. Malignant tumors in this area such as mucoepidermoid carcinoma of accessory parotid gland tend to break SMAS and grow into deep space of the face [15]. In our cases, no interruption of SMAS was found. SMAS might play the barrier role, preventing the invasion of inflammatory cheek lesion that accompanies KD. High signal intensities on T2-weighted images were shown in SMAS adjacent to the KD lesion in two cases. Although the histopathological change of SMAS could not be evaluated in this study, the abnormal high signal intensities on T2-weighted image may reflect the infiltration of focal and chronic inflammation of the mass. In light of the signal intensity changes of SMAS and the defined boarders of the mass, KD arising in the buccal tissue possibly arises from the adipose tissue or intestitium and grows by replacing fat tissue. Adipocytes have different characteristics depending on the location and excrete different cytokines and chemokines [16]. Pathogenesis of KD may be dependent upon some specific substances excreted within the head and neck adipose tissue, and the immunopathological process elicited by them. Relationship between the degree of gadolinium enhancement and activity of the lesions are unclear and require further accumulation of cases and histopathological correlation.
Because of the non-specific MR imaging findings, differential diagnosis of KD in the cheek fat tissue is variable. The major differential diagnosis on MR imaging studies is benign/malignant minor parotid tumor, malignant tumors arising in cutaneous or subcutaneous tissue, tuberculous infection, and angiolymphoid hyperplasia with eosinophilia (ALHE) [17]. The minor salivary gland tumors are usually encapsulated or pseudoencapsulated and are limited to the gland, while KD is frequently associated with irregular extension into the subcutaneous tissue. In some cases malignant cutaneous or subcutaneous tumors seem to be indistinguishable from KD when only referring to MR imaging studies. However, large malignant tumors tend to grow in the deep region of the cheek such as buccal space. In addition, the long clinical course as seen in KD is unusual [11]. Because SMAS is usually interrupted in malignant cutaneous or subcutaneous tumors, preserved SMAS in KD may help differential diagnosis. Lymphadenopathy associated with tuberculous infection usually shows central hypointensity with peripheral gadolinium enhancement [9]. In contrast, the mass of KD did not show ring enhancement but had mostly uniform enhancement in our cases. ALHE reveals similar histologic features with KD; however, there is no sex or racial predilection. Peripheral eosinophilia is only seen in 20% of the patients, and generally no lymphadenopathy is present. In addition, ALHE usually shows an erythematous dermal nodule in the head and neck region that can itch and bleed easily [17].
Although the small patient population is a limitation, our results indicate that as for a cheek mass which shows ill-defined border without adjacent SMAS interruption, KD should be considered as a differential diagnosis.
5. CONCLUSION
Cheek masses of KD showed MR findings reflecting infiltrative nature of the disease; however, no interruption of SMAS was seen in any of our cases. When a cheek mass shows non-specific signal intensities and at least moderate gadolinium-enhancement, the relationship between the mass and SMAS should be evaluated carefully. If the mass shows irregular border and is attached to SMAS without interruption on MR images, and is associated with typical peripheral eosinophilia and elevated serum IgE, the lesion may be investigated under the suspicion of KD.
REFERENCES
- Kimura, T., Yoshimura, S. and Ishikawa, E. (1948) Unusual granulomas combined with hyperplastic changes in lymphatic tissues. Trans Soc Pathol Jpn, 37, 179-180.
- Chen, H., Thompson, L.D., Aguilera, N.S. and Abbondanzo, S.L. (2004) Kimura disease: A clinopathologic study of 21 cases. The American Journal of Surgical Pathology, 28, 505-513. http://dx.doi.org/10.1097/00000478-200404000-00010
- Kapoor, N.S., O’Neill, J.P., Katabi, N., Wong, R.J. and Shah, J.P. (2012) Kimura disease: Diagnostic challenges and clinical management. American Journal of Otolaryngology, 33, 259-262. http://dx.doi.org/10.1016/j.amjoto.2011.05.005
- Oguz, K.K., Ozturk, A. and Cila, A. (2004) Magnetic resonance imaging findings in Kimura’s disease. Neuroradiology, 46, 855-858. http://dx.doi.org/10.1007/s00234-004-1248-5
- Prendergast, P.M. (2012) Anatomy of the head and neck. In: Shiffman, M.A. and Giuseppe Di, A., Eds., Cosmetic Surgery, Springer-Verlag, Inc., Berlin Heidelberg, 29-39.
- Park, S.W., Kim, H.J., Sung, K.J., Lee, J.H., Park, I.S., et al. (2012) Kimura disease: CT and MR imaging findings. American Journal of Neuroradiology, 33, 784-788. http://dx.doi.org/10.3174/ajnr.A2854
- Sun, Q.F., Xu, D.Z., Pan, S.H., Ding, J.G., Xue, Z.Q., Miao, C.S., Cao, G.J. and Jin, D.J. (2008) Kimura disease: Review of the literature. Internal Medicine Journal, 38, 668-672. http://dx.doi.org/10.1111/j.1445-5994.2008.01711.x
- Som, P.M. and Biller, H.F. (1992) Kimura disease involving parotid gland and cervical nodes: CT and MR findings. Journal of Computer Assisted Tomography, 16, 320-322. http://dx.doi.org/10.1097/00004728-199203000-00028
- Takahashi, S., Ueda, J., Furukawa, T., et al. (1996) Kimura disease: CT and MR findings. American Journal of Neuroradiology, 17, 382-385.
- Ginsberg, L.E. and McBride, J.A. (1998) Kimura’s disease. American Journal of Roentgenology, 171, 1508. http://dx.doi.org/10.2214/ajr.171.6.9843280
- Hiwatashi, A., Hasuo, K., Shiina, T., Ohga, S., Hishiki, Y., Fujii, K. and Ishitoya, J. (1999) Kimura’s disease with bilateral auricular masses. American Journal of Neuroradiology, 20, 1976-1978.
- Takeishi, M., Makino, Y., Nishioka, H., Miyawaki, T. and Kurihara, K. (2007) Kimura disease: Diagnostic imaging findings and surgical treatment. Journal of Craniofacial Surgery, 18, 1062-1067. http://dx.doi.org/10.1097/scs.0b013e3180f61249
- Choi, J.A., Lee, G.K., Kong, K.Y., et al. (2005) Imaging findings of Kimura’s disease in the soft tissue of the upper extremity. American Journal of Roentgenology, 184, 193-199. http://dx.doi.org/10.2214/ajr.184.1.01840193
- Ghassemi, A., Prescher, A., Riediger, D. and Axer, H. (2003) Anatomy of the SMAS Revisited. Aesthetic Plastic Surgery, 27, 258-264. http://dx.doi.org/10.1007/s00266-003-3065-3
- Lin, D.T., Coppit, G.L., Burkey, B.B. and Netterville, J.L. (2004) Tumors of the accessory lobe of the parotid gland: A 10-year experience. Laryngoscope, 114, 1652-1655. http://dx.doi.org/10.1097/00005537-200409000-00028
- Kheterpal, I., Ku, G., Coleman, I., Yu, G., Ptitsyn, A.A., Floyd, E. and Gimble, J.M. (2011) Subcutaneous adipose tissue stromal vascular fraction cells vs. mature adipocytes based on DIGE, proteome of human. Journal of Proteomic Research, 10, 1519-1527. http://dx.doi.org/10.1021/pr100887r
- Seregard, S. (2001) Angiolymphoid hyperplasia with eosinophilia should not be confused with Kimura’s disease. Acta Ophthalmologica Scandinavia, 79, 91-93. http://dx.doi.org/10.1034/j.1600-0420.2001.079001091.x