Advances in Remote Sensing
Vol.03 No.01(2014), Article ID:43419,12 pages
10.4236/ars.2014.31002
Change Detection of Desert Sand Dunes: A Remote Sensing Approach
Surender Varma1*, Vatsal Shah2, Biplab Banerjee1, Krishna Mohan Buddhiraju1
1Center of Studies in Resources Engineering, IIT Bombay, Mumbai, India
2ElectricalEnginering, IIT Bombay, Mumbai, India
Email: *synind@gmail.com
Copyright © 2014 by authors and Scientific Research Publishing Inc.
This work is licensed under the Creative Commons Attribution International License (CC BY).
http://creativecommons.org/licenses/by/4.0/


Received 31 August 2013; revised 30 September 2013; accepted 7 October 2013
ABSTRACT
Deserts are one of the major landforms on the Earth. While deserts occupy about one-fifth of Earth’s land surface, they have been studied to a much lesser extent. All over the world, desert landforms are expanding ever rapidly and more and more human settlements are finding place in desert regions for habitation. Thus, quantifying and monitoring dunes becomes more relevant from a managerial perspective. Analyzing desert areas using satellite imagery is a challenging task due to weak textural differences and nearly homogeneous spectral responses in most parts of the terrain. In this paper, a post-clustering methodology for change detection of desert sand dunes is proposed. Features based on Radon spectrum are used to cluster dunes of various orientations. These clustered boundaries are used to detect if there are any changes occurring in the dune re- gions. In the experiments, remote sensing data covering various dune regions of the world are observed for possible changes in dune orientations. In all the cases, it is seen that there are no major changes in desert dune orientations since three decades.
Keywords:
Change Detection; Desert Land Forms; Monitoring Sand Dunes

1. Introduction
Desert regions are increasingly facing imminent threats and becoming vulnerable to effects of climate changes, urbanization, land degradation, water shortage, etc. [1] . Deserts are extremely important habitat for specialized flora and fauna. Besides, deserts possess extensive amounts of minerals such as lithium, boron, etc. Low surface runoff which is one of the major characteristics of desert regions helps in preserving these minerals on the land. Quantification of dune morphology not only helps for mapping purposes but also provides important informa- tion about the regional geologic history, environmental change, and desertification. Knowledge about changes occurring in dune boundaries and their directions will also contribute to the ability in making prediction about wind patterns. From a human perspective, if the dunes are changing in direction and are towards populated re- gions, then immediate precautionary steps are to be initiated by the respective authorities. Hence, it has become imperative to accurately map and monitor deserts to formulate and implement various management activities. Categorizing dunes using field instruments is generally arduous as they generate sparse data. Quantitative me- thods using remote sensing data are more viable for collecting dune information and monitoring them.
Major studies in respect of desert dynamics are mainly focused in and around vegetation or water bodies and changes occurring with respect to them. Dunes can either be stable or mobile as a function of vegetation and wind power. Unrestrained erosion is generally a feature of bare dunes. Stabilized dunes, on the other hand, do not undergo major changes in textures, and can thus facilitate the growth of vegetation [2] [3] . In the work by [4] , a combination of Digital Elevation Modeling and GPS guided field survey were used to obtain the base data about dunes. NDVI index was often used to monitor the growth vegetation and its relation to surrounding set- tlements. [5] used brightness index, semi-variogram, and other statistical data to analyze the changes in texture orientations. [6] has made use of Principal Component Analysis to detect changes in the images.
While above techniques capture certain aspects of desert environments, they are not specifically devised to- wards orientation of dunes. Analyzing desert areas using satellite imagery is a challenging task due to weak tex- tural differences and nearly homogeneous spectral responses in most parts of the terrain, i.e., categorization of dunes via traditional clustering techniques is a challenging task as dunes with differing orientation character will have similar gray value, NDVI index and also brightness index.
Researchers in remote sensing community have extensively worked on a variety of methodologies for other land covers but fewer methodologies have been proposed specifically for dune regions. In this paper we present a novel way of identifying changes in dune orientations.
Radon Transform
Radon developed the Radon Transform in the early part of 19th century [7] . A line with normal vector in direc- tion  at a distance of s from the origin satisfies the line equation (1):
 (1)
(1)
 (2)
(2)
The mass density  evaluated over different viewing directions will give rise to a series of 1D projec- tions parameterized by
 . The Dirac delta function
 , is zero for every argument except on
  axis. Its integral,
  is the radon transform expressed as given in Equation (2). Maximum angle of Radon spectrum can be used to represent surface orientations of sand dunes in [8] . Radon spectrum also contains additional information which can be used to delineate dunes. This additional information can be captured using statistical features based on Radon Spectra which can help in better clustering of dunes. In a related work by [9] , Radon Transform was used to compute the global orientation of the texture present in the image. In the current paper, initially statistical features computed from Radon spectrum are used to cluster various texture regions. Further a change detection technique has been proposed to monitor the changes occurring in these dune texture boundaries.
The study areas selected belong to various dune regions across the world. Depending on the availability of good quality data, it has been ensured that the images selected correspond to the same time of the year. This acts as the prerequisite for change detection so that the changes occurring are not due to seasonal changes.
2. Methodology
The main objective of this methodology is to identify regions of change in the multi temporal desert dune da- tasets. A post-clustering based approach was developed for identifying changes in the orientations of dunes. In- itially contiguous regions representing dunes with each region having similar dune orientation are generated. The region boundaries are used as basis for finding changes in multi temporal remote sensing data. i.e., on a temporal scale, if the boundaries of corresponding regions match then it is considered that there is “no-change” in dune patterns else we say that “change” has occurred.
The methodology adopted is shown in the flowchart (Figure 1). The input image and the reference image be- longing to different times but corresponding to the same region are first registered to ensure the correctness of corresponding pixels for the change detection algorithm. Histogram matching is later performed on to ensure that the changes observed are not due to radiometric differences. Radon Transform is then applied on the im- agery and then similar to Haralick texture features [10] , three statistical features (Equations (3), (4), and (5)) basing on Radon spectrum have been defined namely Mode, standard deviation, and entropy. These features are seen to be superior over mean, median and correlation features for dune texture delineation. It is to be noted that these statistical quantities quantifying Radon data are extracted at each pixel location using a moving window (block) processing technique.
1) Mode radon angle
 (3)
(3)
2) Entropy
 (4)
(4)
3) Standard Deviation
 (5)
(5)
In Equations (3) to (5), the function f(q) denotes the number of pixels with angle q within the window cen- tered around the pixel in consideration. Mode angle feature shown in Equation (3) is the angle with the highest frequency within that block. Entropy feature signifies the randomness of angular information. In Equation (4), p(q) indicates the fraction of pixels having orientation q in the neighborhood. Equation (5) gives the standard deviation feature signifying the spread of angles with respect to the mean angle.
Three different images of the same size as the original image are created by using the above calculated
Figure 1. Flowchart of the methodology.
statistical features for each block. Next, each pixel is assigned the same attribute as that of the majority of pixels within a block. Thresholds are assigned empirically using trial and error basing on their ability to delineate dune patterns. A binary image is thus created for each feature. Once again, these discrete binary feature outputs are transformed into continuous feature output images using a recursive smoothing step. Finally, the texture clustered output is obtained by combining the feature outputs using logical “or” operator.
The window based processing technique is used in order to get contiguous cluster regions. Window size is dependent on a host of factors such as the image resolution, size of the texture patterns on the dunes, distance between successive dune crests, etc. The window size, thresholds used in clustering and other such parameters used in the clustering algorithm are kept constant for both the reference and the input images.
The clustered regions obtained from the reference and the registered input images are then compared with each other. The changes occurring in the dune orientations are captured by observing the variations in the boundaries of clustered regions for identical dune orientations. These changes can be easily depicted by taking the difference of the individual clustered outputs.
All the operations explained in this section are performed for each type of texture orientation individually. For example, if an image has two major regions of different textural orientations, the image will be scanned succes- sively to identify the regions having differing textural orientations one after another. If there are no changes over the temporal scale then the clustering algorithm should ideally give similar boundaries for each cluster region. On the other hand, changes in dune orientations will correspond to changes in the boundaries of the obtained cluster regions.
3. Results and Discussion
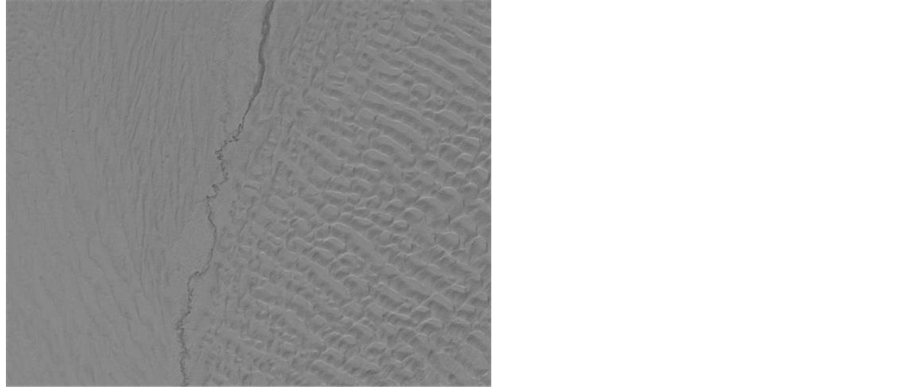
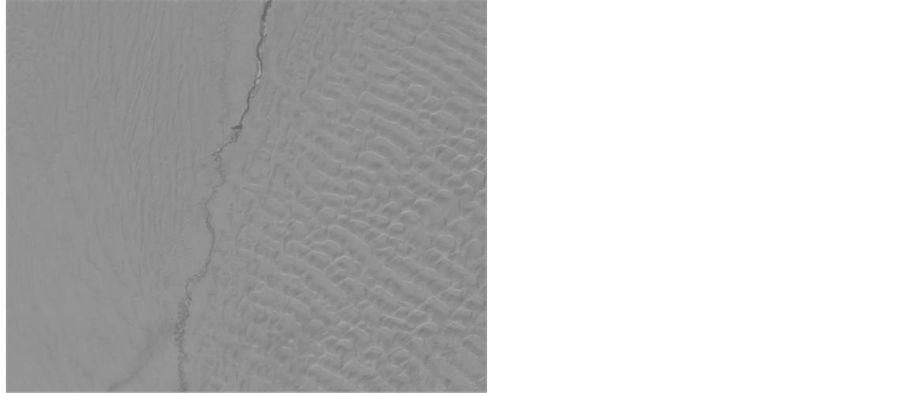
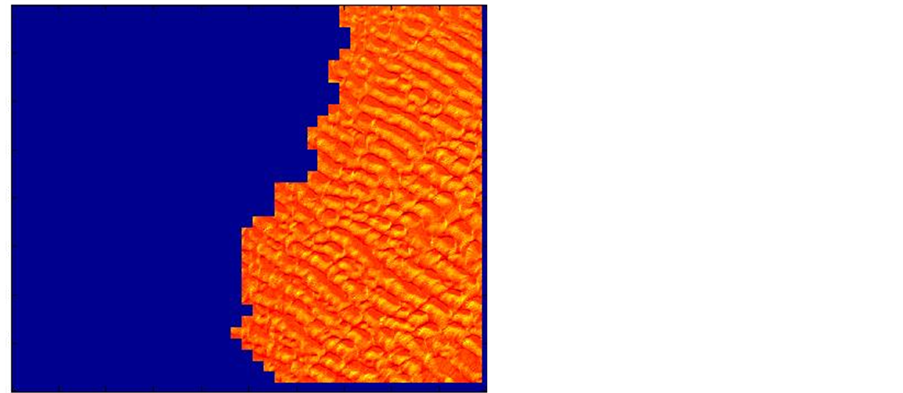
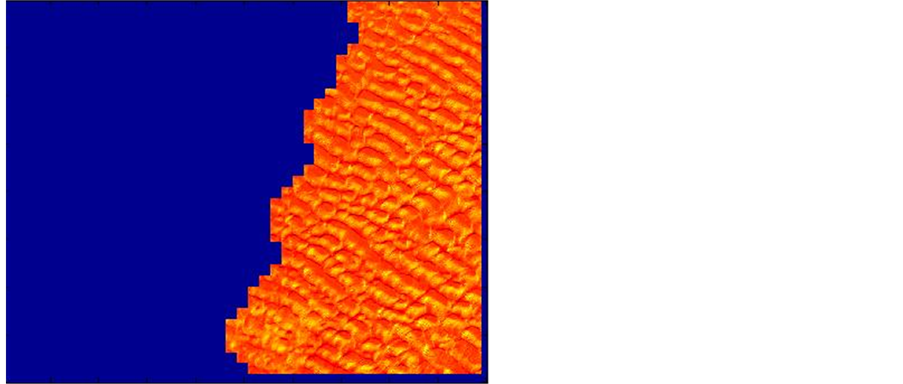
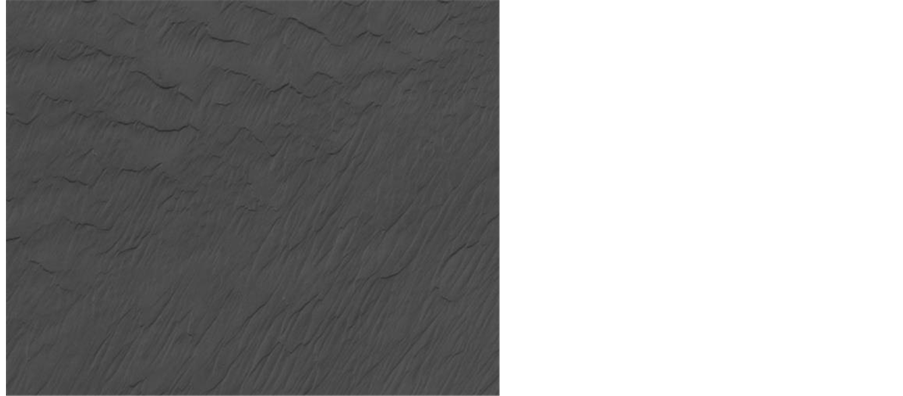
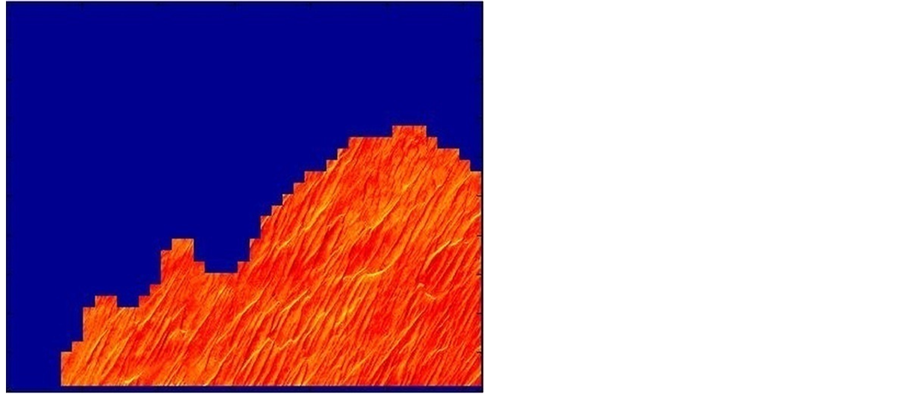
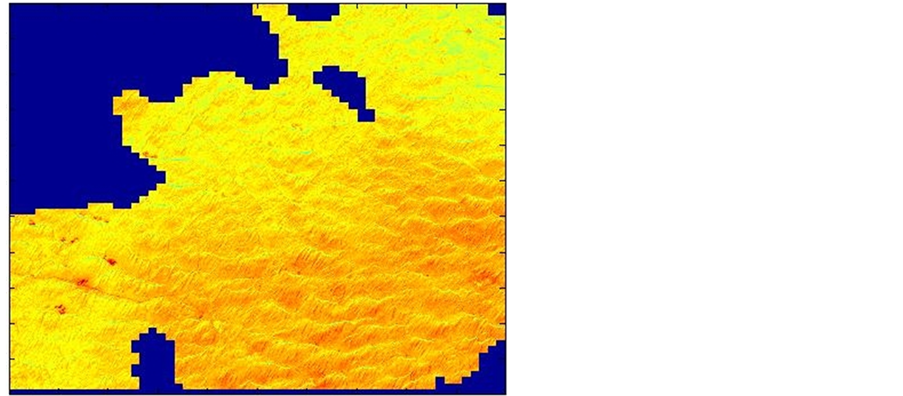
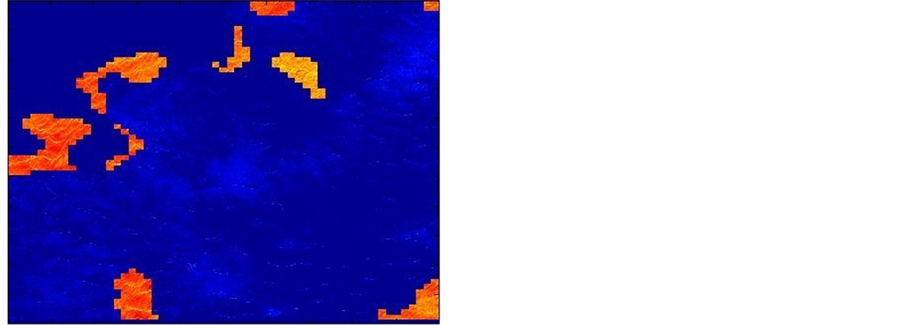
The datasets used for the experiments are summarized in Table 1. Figure 2 and Figure 3 are the images cor- responding to the Gobi desert of central Asia in China-Mangolia region. Figure 4 and Figure 5 indicate the corresponding clustered outputs obtained using the Clustering algorithm mentioned in Section II. The orange colored region in Figure 4 and Figure 5 encompasses the desert regions with horizontal orientation of sand dunes, while the blue region indicates the vertically oriented sand dunes. Figure 6 indicates the difference out- put which can be obtained using the Change Detection Algorithm in Section 2.
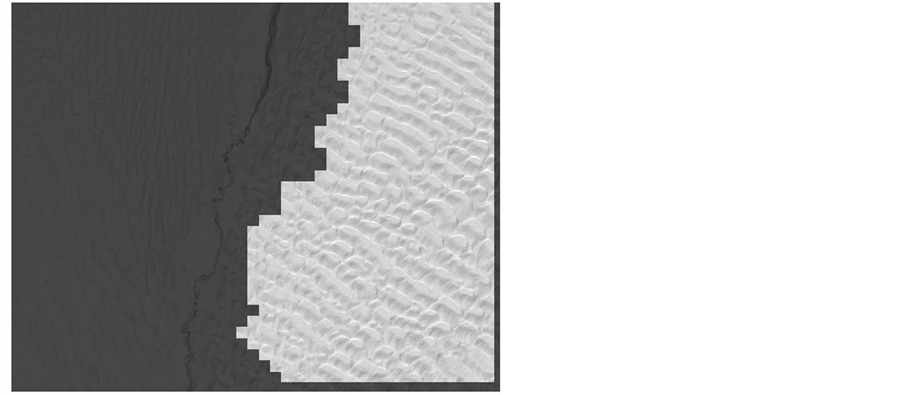
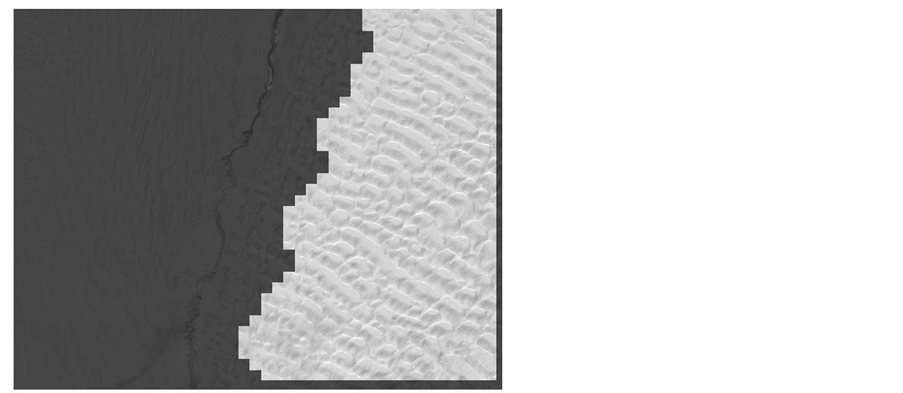
Figure 7 and Figure 8 show the superimposition of corresponding input images and clustered outputs.
This gives a good visualization of the matching between image regions and cluster regions.
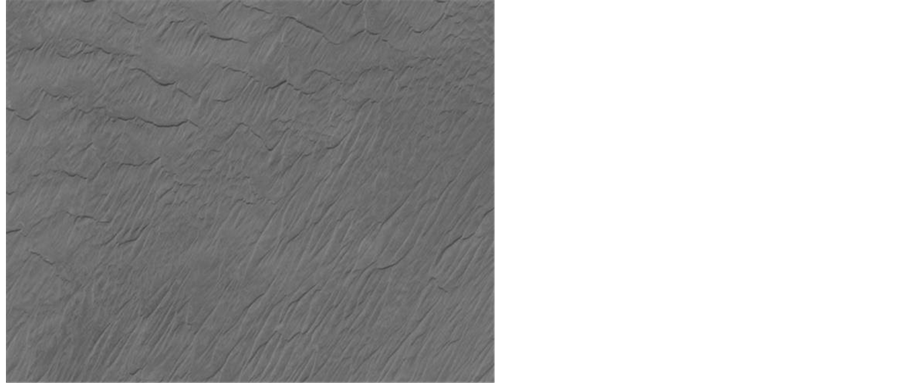
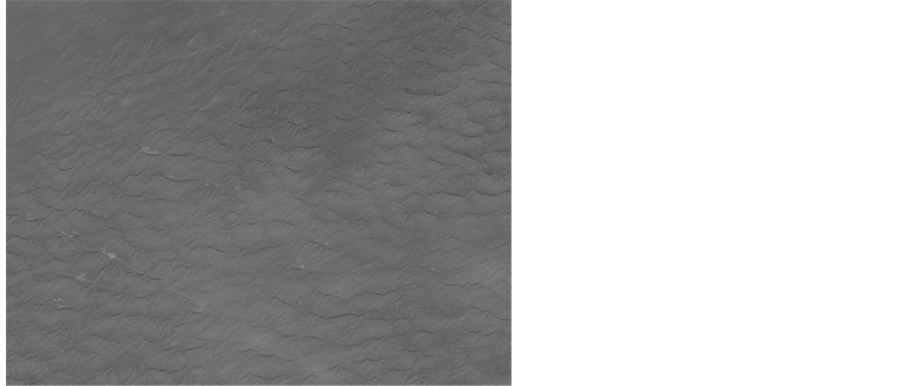
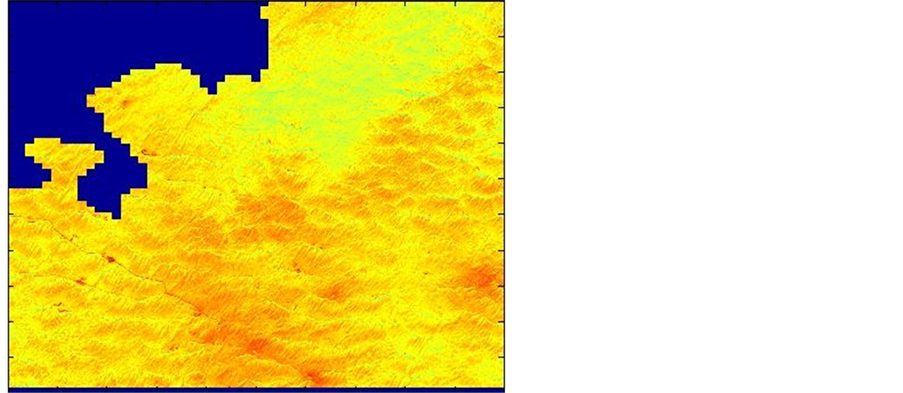
For the 2nd dataset (Figure 9 and Figure 10), imagery correspond to Thar Desert region in the north western region of India is taken. Figure 11 and Figure 12 show the corresponding clustered outputs respectively. The orange colored region in indicates the desert regions with diagonally oriented sand dunes, while the blue region indicates the sand dunes with horizontal orientation. Figure 13 indicates the difference output. As next dataset (Figure 14 and Figure 15), we consider another region of Thar Desert. Figure 16 and Figure 17 are the corres- ponding clustered outputs for the third dataset. The orange colored region in Figure 16 and Figure 17 indicates the desert regions with horizontally oriented sand dunes, while the blue region indicates the sand dunes with no
Table 1. Description of datasets
Figure 2. Gobi Desert region 1 at time 1.
Figure 3. Gobi Desert region 1 at time 2.
Figure 4. Clustered output of image in Figure 1.
Figure 5. Clustered output of image in Figure 2.
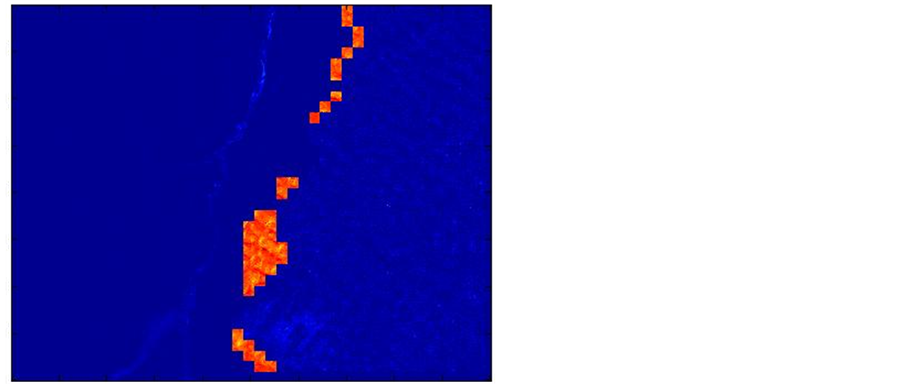
Figure 6. Change detection output: difference output of Figure 4 and Figure 5.
Figure 7. Superimposed clustered output of image in Figure 2.
Figure 8. Superimposed clustered output of image in Figure 3.
Figure 9. Thar Desert region 1 at time 1.
Figure 10. Thar Desert region 1 at time 2.
Figure 11. Clustered output of image in Figure 9.
Figure 12. Clustered output of image in Figure 10.
Figure 13. Change detection output: difference output of Figure 11 and Figure 12.
Figure 14. Thar Desert region 2 at time 1.
Figure 15. Thar Desert region 2 at time 2.
Figure 16. Clustered output of image in Figure 14.
Figure 17. Clustered output of image in Figure 15.
particular orientation. Figure 18 indicates the change detection output for third dataset.
Sahara desert region in Yemen is taken as the 4th dataset (Figure 19 and Figure 20) for experimentation. Figure 21 and Figure 22 are the corresponding clustered outputs for dataset 4. The orange colored regions in both these images denote the diagonally oriented sand dunes, while the blue region indicates the absence of dunes with any specific orientation. Figure 23 indicates the change output of dataset 4.
The attribute allocation after Radon transform is performed block wise rather than pixel wise. Block size is dependent on a host of factors such as the image resolution, size of the texture patterns on the dunes, distance between identically oriented dunes, etc. Larger block sizes have thus been used to cluster the dataset1 imagery, while smaller block sizes were used to cluster imagery of 2nd dataset.
Optimal thresholds for correct clustering of dunes are decided by observing the texture patterns and compar- ing them with the generated output regions. It has been ensured that exactly same thresholds were used for clus- tering images corresponding to each image set.
The change outputs obtained by the methodology adopted in case of all the four datasets used indicate that the interiors of the clustered regions are not undergoing any changes. All the minor changesare observed to occur at the boundaries of these clustered regions.
4. Conclusions
In this paper, we have proposed post clustering Methodology to monitor sand dunes based on changes occur- ring in their cluster boundaries. The separation of different textured regions has been achieved with the help of selective statistical Radon features. This knowledge of categorical dune regions and changes occurring over a period of time will aid the administrative setup in taking precautionary measures and thus protect the surround- ing ecosystem.
Change detection of desert sand dunes was performed on desert data sets belonging to three different dune re- gions of the world. The proposed change detection algorithm worked very effectively for the interior parts of imagery but faltered slightly at the borders of these clusters. This is primarily due to the block based processing technique which will enhance the subtle variations at the edges. These Block effect is particularly useful in ge- neralization and smoothing of clustered regions.
It has been observed that essentially the dune regions in all the considered cases remained constant in terms of their orientation structure since around three decades. There are only minor changes occurring at the interface of dune patterns. This indicates the stability of wind direction and other factors affecting dune orientations. The constancy of dune regions with similar textural boundaries over the time periods considered may not necessarily imply the dormancy of sand throughout but it does point out to the similar patterns of wind directions in that time span. Hence it can be inferred that over the years, though the actual sand particles may be migrating, but there is a definite pattern in their direction of migration. While these findings have implications for understanding
Figure 18. Change detection output: difference output of Figure 16 and Figure 17.
Figure 19. Sahara Desert region at time 1.
Figure 20. Sahara Desert region at time 2.
Figure 21. Clustered output of image in Figure 19.
Figure 22. Clustered output of image in Figure 20.
Figure 23. Change detection output: difference output of Figure 21 and Figure 22.
of dune geomorphology and the changes occurring in dune directions, they also draw the attention to a wider study of dune orientations and their feedback to associated phenomena both at regional and global scales.
Furthermore, the fact that the proposed block based approach does not require any additional information apart from the one available through satellite imagery suggests that it can be used for a host of applications. It is to be veri- fied if the constancy of dune orientations holds well from a historical perspective. Non-availability of open domain remote sensing data prior to 1972 limits the scope of using the proposed methodology for dune change detection.
References
- Belaid, M.A. (2010) Remote Sensing of Desert Cities in Developing Countries. In: Tarek, R. and Carsten, J., Eds., Remote Sensing of Urban and Suburban Areas, Vol. 10, Springer Publisher, New York, 245-265.
- Lancaster, N. (1988) Development of Linear Dunes in the Southwestern Kalahari, Southern Africa. Journal of Arid Environments, 14, 233-244.
- Paisley, E.C.I., Lancaster, N., Gaddis, L.R. and Greeley, R. (1991) Discrimination of Active and Inactive Sand from Remote Sensing: Kelso Dunes, Mojave Desert, California. Remote Sensing of Environment, 37, 153-166. http://dx.doi.org/10.1016/0034-4257(91)90078-K
- Yang, X. (2011) Visualization Urban Spatial Growth of Desert Cities from Satellite Imagery: A Preliminary Study. Proceedings of the 25th International Cartographic Conference, Paris, 3-8 July 2011, CO-439.
- Karnieli, A., Gilad, U., Ponzet, M., Svoray, T., Mirzadinov, R. and Fedorina, O. (2008) Assessing Land-Cover Change and Degradation in the Central Asian Deserts Using Satellite Image Processing and Geostatistical Methods. Journal of Arid Environments, 72, 2093-2105. http://dx.doi.org/10.1016/j.jaridenv.2008.07.009
- Aldossary, A. (2012) Analysis of Urban Change Detection Techniques in Desert Cities Using Remote Sensing. Master’s Thesis, California State University, Northridge.
- Radon, J. (1917) On the Determination of Functions from Their Integrals along Certain Manifolds. Mathematische- Physikalische, 69, 262-267.
- SurenderVarma G., Banerjee, B. and Buddhiraju, K.M. (2012) Representation of Desert Sand Dunes by Surface Orientation Using Radon Transform. Proceedings of IGARSS, Munich, 22-27 July 2012, 2733-2736.
- Jafari-Khouzani, K. and Soltanian-Zadeh, H. (2005) Radon Transform Orientation Estimation for Rotation Invariant Texture Analysis. IEEE Transactions on Pattern Analysis & Machine Intelligence, 27, 1004-1008. http://dx.doi.org/10.1109/TPAMI.2005.126
- Haralick, R.M., Shanmugam, K. and Dinstein, I. (1973) Textural Features for Image Classification. IEEE Transactions on Systems, Man and Cybernetics, 6, 610-621. http://dx.doi.org/10.1109/TSMC.1973.4309314
NOTES
*Corresponding author.


