Advances in Nanoparticles
Vol. 1 No. 3 (2012) , Article ID: 25156 , 8 pages DOI:10.4236/anp.2012.13004
Influence of Temperature on Calcium Hydroxyapatite Nanopowders
1Centro Grandi Apparecchiature-UniNetLab, Università degli Studi di Palermo, Palermo, Italy
2Dipartimento di Chimica “S. Cannizzaro”, Università degli Studi di Palermo, Palermo, Italy
Email: *antonio.zanotto@unipa.it
Received September 5, 2012; revised October 8, 2012; accepted October 24, 2012
Keywords: Hydroxylapatite; Precipitation; Thermal Treatment; Alcohol Dispersion
ABSTRACT
The aim of this work is to investigate the effects of thermal treatment, in the range of temperature between 80˚C - 900˚C, on crystallinity, morphology and particles size of calcium hydroxylapatite nanopowders (HAp). A complete study was carried out applying 31P Magic Angle Spinning NMR, X-ray diffraction, nitrogen porosimetry and Transmission Electron Microscopy techniques. HAp specimens were prepared by chemical precipitation in an aqueous solution of calcium nitrate and ammonium hydrogen phosphate. The thermal treatment performed, showed the formation of crystals whose appearance has three main morphologies and different particles size. HAp treated up to 500˚C showed a set of needle-like shape crystals with a low surface area value. These crystals turned into rod-like crystals with temperature increase, along with an increase in crystallite size. At 900˚C was detected a hexagonal hydroxylapatite phase. Furthermore, Dynamic Light Scattering explored a stable HAp dispersion. The isopropyl alcohol dispersion resulted stable for at least two weeks, useful to create layers of determined morphology nanoparticles.
1. Introduction
In the recent years Calcium Hydroxyapatite, (Ca10(PO4)6 (OH)2) has received much attention for its wide set of application: catalysis, fertilizers and pharmaceutics, protein chromatography and preparation of biocompatible materials such as artificial bones and teeth [1]. HA nanopowders (HAp) are mainly used as the source material to form sintered body and polymer composites [2,3]. Each application depends on HAp structure, crystallinity, particles size, and morphology. The growing interest of the scientific community on the HAp synthesis resulted in several chemical routes of investigation such as precipitation, sol-gel, microemulsion, synthesis assisted by microwave irradiation [4] or hydrothermal method, reverse micelle template system [5-10]. The three main difficulties arising at this phase are formation of nonstoichiometric products [1], low crystallinity due to experimental conditions such as pH and temperature and contamination of the used reactants, whose ions, sodium, potassium, nitrate and chloride, show strong affinity with HAp.
The thermal treatment influences the crystallinity, the mechanical properties and the catalytic activity. Only few authors have systematically investigated the effects of temperature on the HAp crystallinity and crystals morphology. Pang and Bao [11] gave evidence of an increase of crystallinity and crystallite size due to the higher synthetic temperature and the ripening time. However the effect of calcination temperature on the obtained HAp was not taken into consideration.
This paper studies the effect of thermal treatment on samples obtained by precipitation, in particular its influence on the HAp crystallinity, morphology and particle size.
The characterization of the specimens was performed using 31P Magic Angle Spinning NMR, X-ray diffraction (XRD), nitrogen porosimetry, and Transmission Electron Microscopy (TEM). In conclusion, the HAp samples were dispersed in liquid suspension, water and isopropyl alcohol, and tested using Dynamic Light Scattering (DLS), in order to monitor their behavior for some application such as catalysis and chromatography.
2. Material and Methods
2.1. Materials
Ca(NO3)2·4H2O (Aldrich), (NH4)2HPO4 (Aldrich) and ammonia solution (Aldrich 25%) were used as received. Electrical resistivity of the used water was 18.1 M obtained by a Culligan Pharma System.
2.2. HAp Preparation
The synthesis of HAp was obtained by precipitation method according to the following reaction [12]:
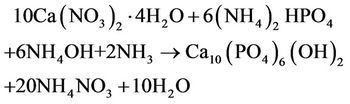
In order to avoid the risk of contamination, a 7.14 M ammonia solution, maintained at 80˚C to prevent the carbonation, was drop-wise added into a 1 M Ca(NO3)2 water solution to reach a pH value equal to 11. When a 0.6 M (NH4)2HPO4 water solution was drop-wise added a white precipitate occurred. The stirred solution was first maintained at 80˚C for 1 h, and then at 37˚C for 24 h. The obtained precipitate was under vacuum filtered on Millipore membrane (0.1 μm, VCTP) and washed several times with water to remove residues of ammonia and nitrate ions, whose presence was qualitatively detected by using respectively concentrated hydrochloric acid and the brown ring test. Then, the sample was dried at 50˚C in a vacuum oven.
Six aliquots of the obtained powder were treated at different temperatures (150˚C, 300˚C, 500˚C, 700˚C and 900˚C) for 1 hour.
2.3. Characterization Techniques
Transmission Electron Microscopy micrographs were acquired by using a JEM-2100 (JEOL, Japan) operating at 200 kV accelerating voltage. A HAp aliquot was dispersed in isopropanol and ultrasound treated for 20 min to ensure a homogeneous dispersion. A small drop was deposited on a 400 mesh carbon-coated copper grid, which was introduced into the TEM chamber analysis after the complete solvent evaporation.
X-ray diffraction patterns were recorded at room temperature with a Philips PW 1050/39 diffractometer in the Bragg-Brentano geometry using a Ni filtered Cu Kα radiation (λ = 1.54056 Å). The X-ray generator worked at a power of 40 kV and a current of 30 mA. The instrument resolution (divergent and antiscatter slits of 0.5˚) was determined using standards free from the effects of reduced crystallite size and lattice defects. Powder patterns were analysed according to the Rietveld method [13] using the MAUD software [14].
Nitrogen absorption-desorption isotherms were Registered at 77 K using a Quantachrome Nova 2200 MultiStation High Speed Gas Sorption Analyser. Samples were outgassed for 3 h at room temperature in the degas station. Adsorbed nitrogen volumes were normalized to standard temperature and pressure. The specific surface area (SBET) was calculated according to the standard BET method [15] in the relative absorption pressure (P/P0) range from 0.045 to 0.250.
31P Magic Angle Spinning Nuclear Magnetic Resonance (31P MAS NMR) spectra were obtained at room temperature through a Bruker Avance II 400 MHz (9.4 T) spectrometer operating at 161.98 MHz for the 31P nucleus with a MAS rate of 5 kHz, 32 scans, a repetition delay of 8 sec and a pulse length of 6.25 µs. 10 mg of each sample were placed in a 4 mm zirconia rotor with KEL-F cap. The chemical shifts were referred to an 85% solution of phosphoric acid (H3PO4), external standard.
Dynamic Light Scattering measurements were carried out by using a Brookhaven Instrument equipped with a BI-9000AT Digital Autocorrelator. The light source was a He-Ne 632.8 nm laser working at a power of 75 mW. The detector was a photomultiplier tube. The source and the detector were mounted on a turntable and the measurements were performed at 90 Å. Data were acquired for 5 min and were directly obtained as electric field self-correlation function, g(τ), versus the decay time, τ, by using the software supplied by Brookhaven Inc..
3. Results and Discussion
3.1. Powder Characterization
In order to evaluate the particle size and morphology, a TEM investigation was performed. Some TEM micrographs are reported in Figure 1.
A TEM data summary including shape and size of the particles is reported in Table 1.
Some aggregate of needle-shape particles randomly oriented were detected in the as-prepared sample and in the samples treated at 150˚C and 300˚C. Samples treated at 500˚C and at 700˚C are constituted by aggregated rod-like particles. This aggregation was attributed to Van der Waals interaction by Martin et al. [16]. The morphology of the HAp treated at 900˚C is different from the others. Two different particle morphologies are observed, the first one has an irregular rod-like shape and size around 56 nm width and ~220 nm length. The second one has a hexagonal-like shape and sizes around 65 nm width and ~80 nm length.
The possible nano-needle nucleation and growth to the consecutive nano-rod and hexagonal transformation could be attributed to the relative specific surface energies, which determine the OH-quantity, associated with the different facets of HA crystal [17]. The particles morphology changes in uniaxial direction (facets with less OH-concentration) on increasing the temperature. Nevertheless this phenomenon is not clear yet, further theoretic studies will be needed to deeply understand the complex growth mechanism.
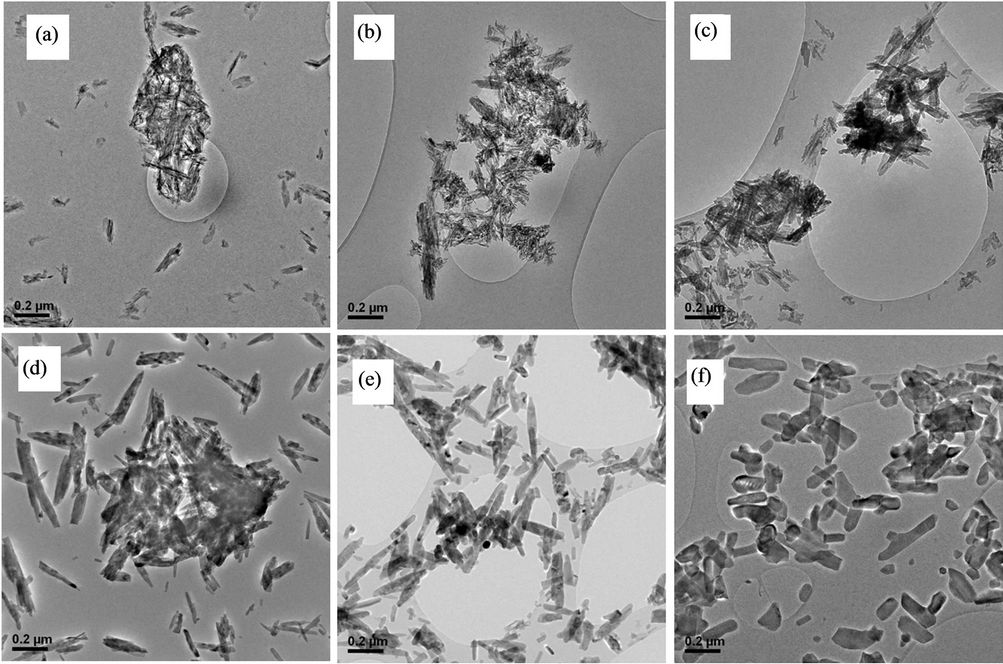
Figure 1. TEM micrographs of the (a) as-prepared HA and of samples treated at (b) 150, (c) 300, (d) 500, (e) 700, (f) 900˚C.
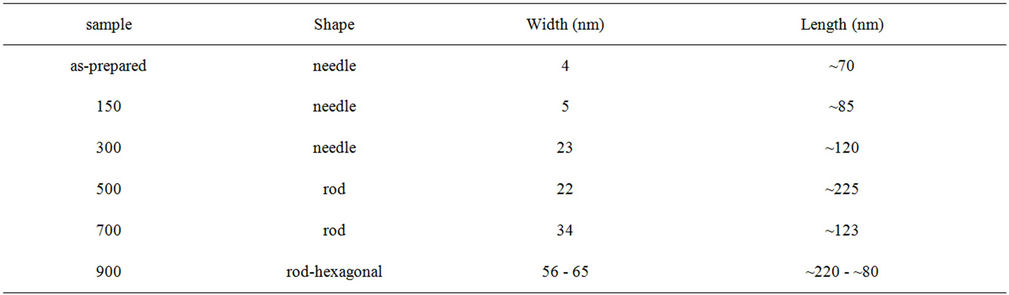
Table 1. TEM data summary.
The investigation of crystalline structure was carried out by XRD technique. Diffraction patterns of all HAp samples treated at different temperature, are shown in Figure 2. The bar sequence of the hexagonal hydroxylapatite diffraction pattern is shown at the bottom, as reference. The residues of sample treated at 900˚C, that obtained the best Rietveld fit, are reported at the top. The agreement between computed and experimental data is fairly good in every pattern.
The pattern of the as-prepared sample is reproduced by the hexagonal structure (space group P63/m, lattice parameters a = b = 9.430, c = 6.891 Å, α = β = 90˚, γ = 120˚). The absence of the characteristic peaks, given by impurities or secondary phases, indicates that the HA highly pure crystalline phase has formed at 80˚C. However, the peak profile is very broad thus accounting for both the nanocrystalline condition of materials and lattice large disorder. The mean particle size, D, and the lattice disorder, ε, resulted, respectively 316(2) Å, and 1.5 × 10⁻³.
The XRD patterns of the aliquots treated at 150, 300, 500, 700, and 900˚C were also described by the hexagonal HA
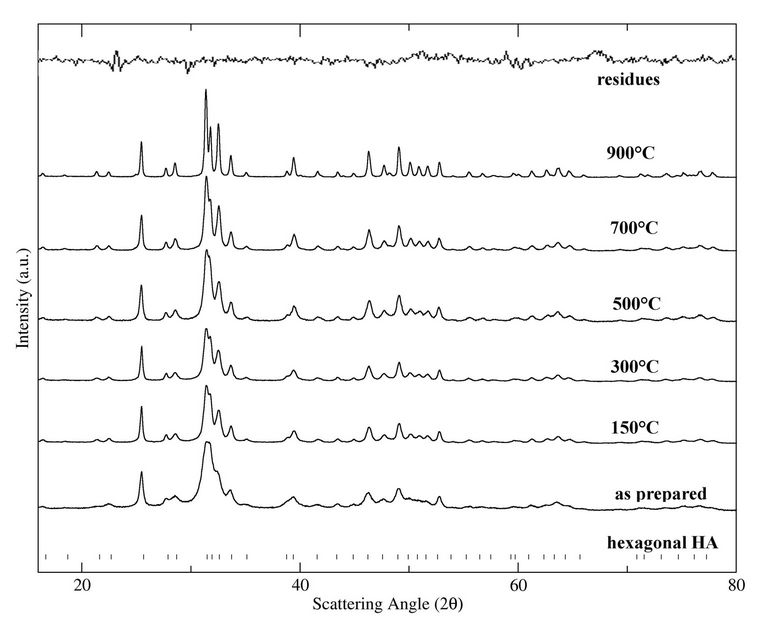
Figure 2. XRD patterns (dots) and Rietveld fits (full lines) of the HAp samples treated at different temperature. The bar sequence of reference diffraction pattern and a curve of residuals are shown along the bottom and top, respectively.
phase. The peak broadening of the HAp samples decreases on increasing the temperature, indicating that the crystallinity increases. The cell parameters a, b and c, the average crystallite size, D, and the lattice disorder, ε, calculated using the Rietveld method [13], are reported in Table 2. The lattice parameters and the related cell volume of the HA phase do not appreciably change with the treatment temperature. The average crystallite size, D, corresponding to the average coherent diffraction domain, was calculated after separating strain from size effects according to the Rietveld approach [13] using the isotropic model, which can be regarded as a first approximation for a volume weighted average size of crystallites, regardless their shape and texture. It is known that the assumption of isotropic size and strain may be questionable when dealing with HA-materials. In particular, the (002) peak at d = 3.44 (2θ = 25.85˚) appears sharper than the others. This confirms the existence of texture along this direction [18]. Nevertheless, this approach can be used to estimate the influence of temperature. In order to visualize this effect, the increase of the average crystallite size of the HAp phase is reported in Figure 3(a) as function of temperature.
In the temperature range 80˚C - 500˚C the growth rate is about 7 Å/˚C. Around 500˚C the D value suddenly increases thus confirming that high temperature is necessary to obtain bigger and more ordered crystals. This result is further confirmed by the lattice disorder parameter, whose value slightly decreases as expected after an initial increase that accounts for the displacement and the broadening of diffraction peaks. The fraction of crystalline phase (Xc) was evaluated according to the literature approach reported by Pang and Bao [11] by means of the following equation:
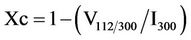
where I300 is the intensity of the (300) diffraction peak and V112/300 is the intensity of the hollow between (112) and (300) diffraction peaks. Values are reported in Table 2.
The Xc value increases from 0.28 to 0.99 indicating a strong temperature dependence of the crystallinity, as shown in Figure 3(b).
The trend of Xc differs from the dependence law of D. This indicates that the temperature sensitivity of the crystallinity is higher than the one of the crystalline domain sizes. These results suggest that the HA nanocrystals are poorly organized to form bigger structure, but their organization and regularity improve on increasing the temperature according to the TEM results.
The knowledge about the surface area could give some basic informations on catalysis. For this reason the nitrogen adsorption-desorption isotherms were carried out.
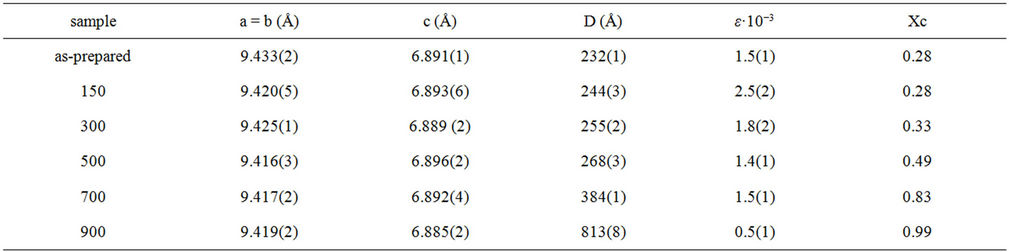
Table 2. Cell parameters a, b and c, average crystallite size (D), lattice disorder (ε) of the HA phase and fraction of crystalline phase (Xc).
 (a) (b)
Figure 3. (a) Average crystallite size, D, of the HA phase as function of temperature and (b) fraction of crystalline phase Xc (the dashed line are a guide for eyes).
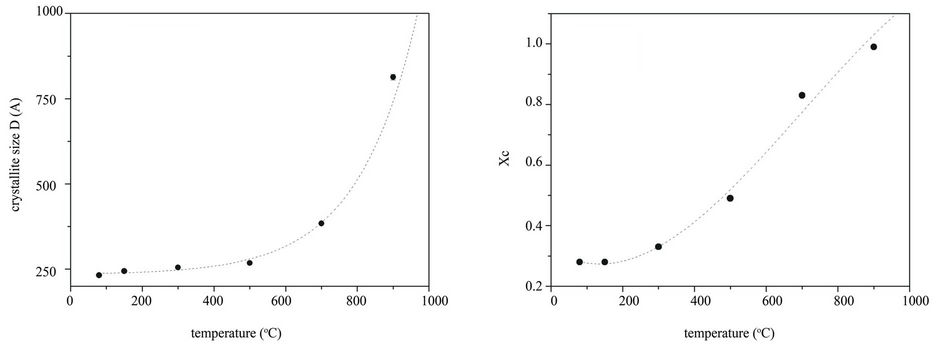
The profile of isotherms of all samples treated up 900˚C are similar. An example of, N2 adsorption and desorption isotherms of HAp samples treated at 150, 700 and 900˚C are reported in Figure 4(a).
All isotherms show a slow increase in the adsorbed amount of N2. According to the IUPAC classification, the observed N2 adsorption isotherms can be identified as type III with an H1 type hysteresis loop [19], characterized by a low surface area. When the relative pressure increases, multilayer absorption occurs until all empty spaces are filled up. The obtained BET specific surface area (SBET), calculated in the 0.045 - 0.250 relative pressure range, are reported as function of the temperature in Figure 4(b). The SBET value decreases with temperature. This result is consistent with the particle size increase, even if after 500˚C the more rapid surface area decrease could be attributed to the variation of crystal morphology.
The 31P MAS NMR spectra were acquired on all samples. As an example, 31P MAS NMR spectra of HAp samples treated at 150 and 900˚C are compared in Figure 5.
The spectrum of the sample treated at 150˚C (lower spectrum in Figure 5) shows the typical HA peak at 2.5 ppm together with an additional broad foot. It indicates the presence of nanoscopic particles with a low degree of crystallinity [20]. The corresponding peak of the sample treated at 900˚C (upper spectrum in Figure 1) differs from the previous in narrow line-width and for the absence of the broad foot indicating an increase of particles size and crystallinity.
3.2. Dispersion Characterization
The possibility to obtain stable dispersion of nanosized crystals is useful in some applications such as catalysis or chromatography. Since some authors have reported the role of isopropanol to obtain a stable dispersion [21,22], the HAp were dispersed both in water and in isopropanol (0,01 M) in order to obtain information about their behaviour.
A fast precipitation occurs in all samples dispersed in water, while particles dispersed in isopropanol are well maintained in suspension. The DLS investigation was carried out on the powder dispersed in isopropanol. DLS
 (a) (b)
Figure 4. (a) N2 adsorption isotherms of samples treated at 150, 700 and 900˚C; (b) SBET of the HAp samples as function of temperature.
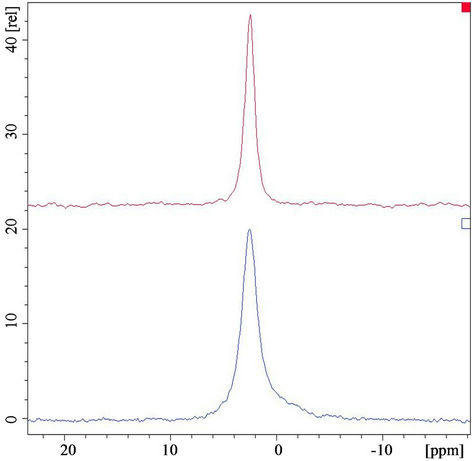
Figure 5. 31P MAS NMR spectra of the HAp treated at 150˚C (lower spectrum) and at 900˚C (upper spectrum).
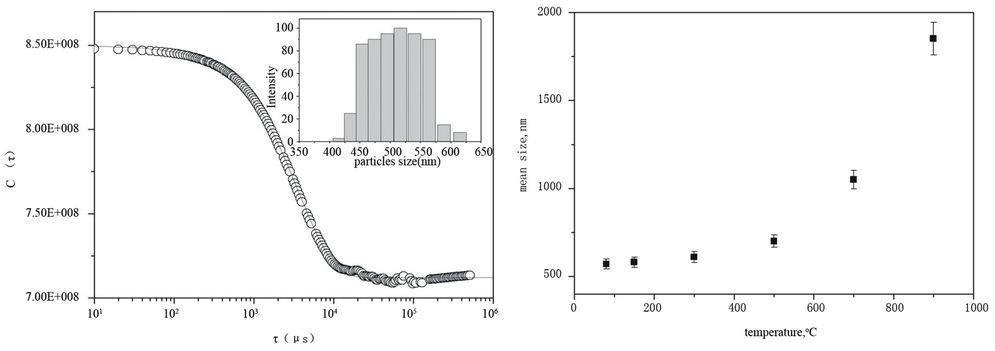
data had a good statistic and reproducibility. An example of, the un-normalized electric field self-correlation function C(τ) as a function of the decay time, τ, of the as-prepared HAp dispersed in isopropanol is reported in Figure 6(a).
Data indicate that the signal is self-correlated up to 0.5 msec and the correlation is completely lost around 50 msec, thus, indicating that the diffusing unity have large size. The self-correlation function computed using the Cumulant analysis [23] did not satisfactorily reproduce the experimental data suggesting that the particles in suspension are polydisperse. A more appropriate data analysis related to a polydisperse sample model was done using the CONTIN method [24]. The computed selfcorrelation function, reported as a continuous line in the Figure 6(a), well reproduced the experimental data. The histogram of particle size distribution, evaluated by applying this approach, is reported in the inset of the Figure 6(a). The mean hydrodynamic diameter value is 571 nm. This value is strongly higher than the ones by TEM and XRD. This finding can not be explained by considering the solvation sphere of each particle. It suggests the formation of agglomerates in suspension.
The same approach of data analysis was used for all the other samples. The trend of the mean size as function of temperature is reported in Figure 6(b). The mean value lies in the range of 571 to 2870 nm and increases with the temperature according to results obtained by other techniques.
The measurements have been repeated two weeks later. The obtained mean particle size was in the same range indicating that the dispersion was stable over that period of time.
Considering that the stability of a dispersion is the results of a delicate balance of attractive and repulsive forces, it appears that in the samples treated at higher temperature the solvent causes the coalescence of particles making bigger aggregates which cause surface free energy minimization: the repulsive forces were screened thus promoting the coalescence and hence the formation of big, polydispersed aggregates. This mechanism more likely occurs in water than in isopropanol because of the relative strength of hydrogen’s bonds causing the building of super-aggregates which precipitate immediately in the dispersion.
4. Conclusions
The HA nanopowders were prepared by precipitation and were systematically investigated as a function of temperature from 80˚C up to 900˚C. High purity HAp are
 (a) (b)
Figure 6. (a) The correlation function C(τ) of as-prepared HAp dispersed in isopropanol. The solid line represents the best fit obtained using the CONTIN method [22]. In the inset the histogram of particles distribution. (b) Mean dimension of HA aggregates as function of temperature.
obtained at low temperature and HA structure is maintained up to 900˚C. The HAp with lower crystallinity show needle-like shape particles with a low surface area value, whereas the HAp with higher crystallinity have rod shape particles. The increase in crystalline size with temperature takes place by the growth of the particles in uniaxial direction (facets with less OH-concentration).
The use of isopropanol to obtain a stable HAp dispersion was successfully demonstrated. The stabilization was attributed to relative surface energies of HAp facets, to the balance of attractive and repulsive forces and to the relative strength of hydrogen’s bonds of the medium. Furthermore, the stability of dispersion could allow to create nanoparticles layers with determined surface.
5. Acknowledgements
The authors would like to thank MIUR for supporting this research through the PRIN 2009 prot. 2009WXXLY2_004 “Application of microwaves irradiation on some inorganic syntheses and on bioactive compound and essential oils extraction”. 31P MAS NMR, and TEM experimental data were provided by Centro Grandi ApparecchiatureUniNetLab-Universita` di Palermo funded by P.O.R. Sicilia 2000-2006, Misura 3.15 Azione C Quota Regionale. A.Z. acknowledges the MIUR and INSTM fellowship for his work on “TEM analysis on nanostructured composites”, and Dr. Oriana Giovanna Guarino.
REFERENCES
- S. Koutsopoulos, “Synthesis and Characterization of Hydroxyapatite Crystals: A Review Study on the Analytical Methods,” Journal of Biomedical Materials Research Part A, Vol. 62, No. 4, 2002, pp. 600-612.
- W. W. Thein-Han and R. D. K. Misra, “Biomimetic Chitosan-Nanohydroxyapatite Composite Scaffolds for Bone Tissue Engineering,” Acta Biomaterialia, Vol. 5, No. 4, 2009, pp. 1182-1197. doi:10.1016/j.actbio.2008.11.025
- C. Tsioptsias, I. Tsivintzelis, L. Papadopoulou and C. Panayiotou, “A Novel Method for Producing Tissue Engineering Scaffolds from Chitin, Chitin-Hydroxyapatite, and Cellulose,” Materials Science and Engineering C, Vol. 29, No. 1, 2009, pp. 159-164.
- Y. Torrent-Burgués, J. Gómez-Morales, A. López-Macipe, and Y. A. Rodríguez-Clemente, “Continuous Precipitation of Hydroxyapatite from Ca/Citrate/Phosphate Solutions Using Microwave Heating,” Crystal Research and Technology, Vol. 34, No. 5-6, 1999, pp. 757-762.
- M. H. Fathi and A. Hanifi, “Evaluation and Characterization of Nanostructure Hydroxyapatite Powder Prepared by Simple Sol-Gel Method,” Materials Letters, Vol. 61, No. 8, 2007, pp. 3978-3983.
- Z. H. Zhou, P. L. Zhou, S. P. Yang, X. B. Yu and L. Z. Yang, “Controllable Synthesis of Hydroxyapatite Nanocrystals via a Dendrimer-Assisted Hydrothermal Process,” Yang, Materials Research Bulletin, Vol. 42, No. 9, 2007, pp. 1611-1618.
- X. Zhang and K. S. Vecchio, “Hydrothermal Synthesis of Hydroxyapatite Rods,” Journal of Crystal Growth, Vol. 308, No. 1, 2007, pp. 133-140.
- S. Kannan, J. H. G. Rocha, S. Agathopoulos and J. M. F. Ferreira, “Fluorine-Substituted Hydroxyapatite Scaffolds Hydrothermally Grown from Aragonitic Cuttlefish Bones,” Acta Biomaterialia, Vol. 3, No. 2, 2007, pp. 243-249. doi:10.1016/j.actbio.2006.09.006
- A. Wang, D. Liu, H. Yin, H. Wu, Y. Wada, M. Ren, T. Jiang, X. Cheng and Y. Xu, “Size-Controlled Synthesis of Hydroxyapatite Nanorods by Chemical Precipitation in the Presence of Organic Modifiers,” Materials Science and Engineering: C, Vol. 27, No. 4, 2007, pp. 865-869.
- A. Banerjee, A. Bandyopadhyay and S. Bose, “Hydroxyapatite Nanopowders: Synthesis, Densification and CellMaterials Interaction,” Materials Science and Engineering: C, Vol. 27, No. 4, 2007, pp. 729-735.
- Y. X. Pang and X. Bao, “Influence of Temperature, Ripening Time and Calcination on the Morphology and Crystallinity of Hydroxyapatite Nanoparticles,” Journal of the European Ceramic Society, Vol. 23, No. 10, 2003. pp. 1697-1704.
- H. Yu, H. Zhang, X. Wang, Z. Gu, X. Li and F. Deng, “Local Structure of Hydroxy-Peroxy Apatite: A Combined XRD, FT-IR, Raman, SEM, and Solid-State NMR Study,” Journal of Physics and Chemistry of Solids, Vol. 68, No. 10, 2007, pp. 1863-1871.
- R. A. Young, “The Rietveld Method,” University Press, Oxford, 1993.
- L. Lutterotti and S. Gialanella, “X-Ray Diffraction Characterization of Heavily Deformed Metallic Specimens,” Acta Materialia, Vol. 46, No. 1, 1998, pp. 101-110.
- S. Brunauer, P. H. Emmett and E. Teller, “Adsorption of Gases in Multimolecular Layers,” Journal of the American Chemical Society, Vol. 60, No. 2, 1938, pp. 309-319.
- C. L. Martin, G. Delette and D. Bouvard, “Discrete Element Simulations of the Compaction of Aggregated Ceramic Powders,” Journal of the American Chemical Society, Vol 89, No. 11, 2006, pp. 3379-3387.
- K. P. Sanosh, M. C. Chu, A. Balakrishnan, Y. J. Lee, T. N. Kim and S. J. Cho, “Synthesis of Nano Hydroxyapatite Powder That Simulate Teeth Particle Morphology and Composition,” Current Applied Physics, Vol. 9, No. 6, 2009, pp.1459-1462.
- I. Zizak, O. Paris, P. Roschger, S. Bernstorff, H. Amenitsch, K. Klaushofer and P. Fratzl, “Investigation of Bone and Cartilage By Synchrotron Scanning-SAXS and -WAXD with Micrometer Spatial Resolution,” Journal of Applied Crystallography, Vol 33, No. 1, 2000, pp. 820-823. doi:10.1107/S0021889800001321
- IUPAC, “Manual of Symbols and Terminology, Appendix 2, Part 1, Colloid and Surface Chemistry,” Pure and Applied Chemistry, Vol. 31, No. 4, 1972, pp. 578-638.
- C. Jäger, T. Welzel, W. Meyer-Zaika and M. Epple, “A Solid-State NMR Investigation of the Structure of Nanocrystalline Hydroxyapatite,” Magnetic Resonance in Chemistry, Vol. 44, No. 6, 2006, pp. 573-580. doi:10.1002/mrc.1774
- A. Zanotto, R. Matassa, M. L. Saladino, M. Berrettoni, M. Giorgetti, S. Zamponi and E. Caponetti, “Cobalt Hexacyanoferrate—Poly(Methyl Methacrylate) Composite: Synthesis and Characterization,” Materials Chemistry and Physics, Vol. 120, No. 1, 2010, pp. 118-122. doi:10.1016/j.matchemphys.2009.10.032
- E. Fratini, M. G. Page, R. Giorgi, H. Cölfen, P. Baglioni, B. Demé and T. Zembo, “Competitive Surface Adsorption of Solvent Molecules and Compactness of Agglomeration in Calcium Hydroxide,” Nanoparticles Langmuir, Vol. 23, No. 5, 2007, pp. 2330-2338. doi:10.1021/la062023i
- D. E. Koppel, “Analysis of Macromolecular Polydispersity in Intensity Correlation Spectroscopy: The Method of Cumulants,” Journal of Chemical Physics, Vol. 57, No. 11, 1972, pp. 4814-4821.
- B. J. Berne and R. Pecora, “Dynamic Light Scattering,” Wiley, New York, 1976.
NOTES
*Corresponding author.