American Journal of Plant Sciences
Vol.4 No.8A(2013), Article ID:35898,10 pages DOI:10.4236/ajps.2013.48A002
Comparison of Positions of QTLs Conferring Resistance to Xanthomonas campestris pv. campestris in Brassica oleracea*
![]()
1Niigata University, Niigata, Japan; 2Sher-e-Bangla Agricultural University, Dhaka, Bangladesh; 3Sylhet Agricultural University, Sylhet, Bangladesh; 4Bangladesh Agricultural Research Institute, Gazipur, Bangladesh.
Email: #okazaki@agr.niigata-u.ac.jp
Copyright © 2013 Nazmoon Naher Tonu et al. This is an open access article distributed under the Creative Commons Attribution License, which permits unrestricted use, distribution, and reproduction in any medium, provided the original work is properly cited.
Received May 27th, 2013; revised June 27th, 2013; accepted July 17th, 2013
Keywords: Black Rot; Disease Resistance; QTL; Xanthomonas campestris pv. campestris
ABSTRACT
Black rot, caused by Xanthomonas campestris pv. campestris (Xcc) is possibly the most important disease of Brassica worldwide. To compare chromosomal positions of Xcc resistance loci in Brassica oleracea between the present and published studies and to develop marker assisted selection (MAS) to resistance against Xcc race 1, we constructed a B. oleracea map, including pW, pX and BoCL markers that were closely linked to previously reported Xcc resistance QTLs. We also analyzed Xcc resistance QTLs by improving our previously reported map derived from the cross of a susceptible double-haploid line (GC P09) with a resistant double-haploid line (Reiho P01). In the nine linkage groups obtained (C1-C9), the major QTL, XccBo(Reiho)2, was derived from Reiho with a maximum LOD score (7.7) in C8. The QTL (LOD 4.4) located in C9, XccBo(GC)1 was derived from the susceptible GC. The other QTL (LOD 4.4), XccBo(Reiho)1, was found in C5. Based on common markers, it was possible to compare our finding Xcc resistance QTLs with the B. oleraceaXcc loci reported by previous authors; XccBo(Reiho)1 and XccBo(GC)1 may be identical to the Xcc resistance QTLs reported previously or a different member contained in the same resistance gene cluster. Our map includes public SSR markers linked to Xcc resistance genes that will promote pyramiding Xcc resistance genes in B. oleracea. The present study will also contribute to a better understanding of genetic control of Xcc resistance.
1. Introduction
Black rot, caused by the bacterium Xanthomonas campestris pv. campestris (Pam.) Dowson (Xcc), is the most destructive disease in crucifer crops [1]. Xcc enters leaves not only through insect, or mechanically wounded tissue [2]but also through hydathodes at leaf margins and spreads through vascular tissue, clogging vessels and producing V-shaped chlorotic lesions [3]. Such symptoms lead to a systemic infection in susceptible plants so that crop quality and yield substantially decrease. Crop debris and cruciferous weed are potential inoculum sources in field [4]. The pathogen can be retained in seeds via vessels and causes severe incidence in descent seedlings; consequently, Xcc is difficult to prevent by agricultural practices such as seed treatment, crop rotation and use of agrochemicals. Thus, utilization of Xcc resistant cultivars is one of the most effective approaches to minimize crop loss from infection of the pathogen.
Nine races of Xcc have been identified to date from pathogenicity tests based on the interaction between differential cultivars and races [5-9]. [7] reported that the appearance of race 1 and 4 was predominant worldwide and other races, 2, 3, 5 and 6, were rare. Races 1 and 4 are the most important races in B. oleracea crops. Therefore, resistance to both of these two races is a minimum requirement to be of value in controlling black rot [10].
Screening for Xcc resistance was performed in Brassica species and related species [11-14] and extensive screening using more than 100 genotypes was done by [8]. As a result, resistance to Xcc has been identified in genotypes of B. rapa (A genome), B. nigra (B), B. oleracea (C), B. carinata (BC), B. juncea (AB), and B. napus (AC). Some genotypes of B. nigra, B. carinata and B. juncea with B genome revealed the highest level of resistance to races 1, 3 and 4, indicating the existence of R1, R3 and R4 resistance genes that were postulated based on the gene-for gene model [8]. In addition, the high level resistance of race 4, conferred by the R4 gene, was found in B. rapa and B. napus with A genome. In B. oleracea, resistance to race 3 and race 5 is common, but resistance to race 1 is very rare. Overall single R genes corresponding to AVR genes (avirulence gene) in each race are considered to confer the high level of qualitative resistance in Brassica species, and those R genes are dominant. Inheritance of such race-specific resistance genes was confirmed by the phenotypic segregations in the F2 progenies derived from crossing between susceptible and resistant genotypes; the observed ratio (Resistance:Susceptibility) fits to the 3:1 ratio expected in segregation of a single dominant gene [15].
On the other hand, [11] found that the Japanese cabbage cultivar, Early Fuji, had a high level of resistance to Xcc. and he showed that this resistance was controlled by one or two dominant genes. [16] found that resistance of cabbage cultivars BI-16, derived from Early Fuji, was quantitative under oligogenic control; they postulated one major recessive resistance gene, f, the expression of which in heterozygous conditions was influenced by one recessive and one dominant modifier genes. [15] also reported that the resistance of BI-16 to race 1 was quantitative and recessive. [17] identified the two Xcc resistance QTLs on LG2 and another two QTLs on LG1 and LG9, respectively, in the mapping population derived from the cross of the resistant cabbage and the susceptible broccoli. [18] also identified QTLs on C2, C4, and C5. [19] detected the two significant QTLs controlling resistance to Xcc on LG2 and LG9. Those results indicate that resistance to Xcc was under oligogenic control. Comparison of the QTLs identified by previous authors is, however, quite difficult because no anchor markers can align the linkage maps contracted by different authors, and furthermore, some of the linkage maps do not follow the international nomenclature established for the C genome of B. oleracea.
In our previous paper [19], the total length of the linkage map constructed was 320 cM, which is not long enough to analyze locations of QTLs at a genome-wide level. The objectives of this study, therefore, were 1) to analyze Xcc resistance QTLs by using an improved F2 population map of B. oleracea plants, and 2) to do a comparative analysis between our mapped QTL positions and the positions of QTLs on the previously published maps by incorporating common markers in our developed map.
2. Materials and Methods
2.1. Plant Materials
A doubled hybrid (DH) broccoli line (P09) of B. oleracea subsp. Italica cv. Green Comet (GC) (Takii Seed Co. Ltd., Japan) was crossed as the female parent to a DH line P01 of B. oleracea subsp. capitata cv. Reiho (Ishii seed company, Japan). The “GC P09” was susceptible to X. campestris pv. campestris diseases, whereas the Reiho P01 was tolerant. We used the F2 population produced in the study of [19] to construct our linkage the In summary, seeds of F2 were produced by bud-selfing of a F1 plant and F2 plants selected for QTL analysis were self-pollinated to produce F3 lines. Marathon F1 (B. oleracea), Tokyo Cross Hybrid Turnip (B. rapa), Seven Top Turnip (B. rapa), and Florid Broad Leaf (B. juncea) were collected from Twilley Seed Co., Inc., SC, US) and used for identification of the race of Xcc. Marathon F1 was used as a susceptible check.
2.2. Inoculation Test and Identification of the Race of Xcc
The strain that was used for this study, X. campestris pv. campestris strain (isolate no. 03-01967), was the same as the report of [19]. Inoculum of the bacterium was cultured in Yeast Dextrose Calcium Carbonate (YDC) agar plate for 48 h at 28˚C, and then bacterial cells were scraped from plates and adjusted to a concentration of 108 CFU/ml (0.2OD A600 nm) with 0.85% NaCl solution. V-shaped lesion area (cm2) was measured two weeks after inoculation according to the equation of (lesion width × length) × 1/2.
The seedlings and plants were grown in a greenhouse at the agricultural field of Niigata University. Approximately 50-day old plants were used for the inoculation test. Leaves were inoculated by cutting the mid vein near the leaf margins 1.0 cm in width using a nail cutter that had been dipped in the bacterial suspension [20]. For every inoculation, the nail cutter was dipped into the bacterial suspension. Twelve plants from each F3 line were tested. The three youngest fully expanded leaves were inoculated per plant. The mean DLA of the 12 seedlings per F3 line was used as representative of DLA for each F2 plant.
Identification of race was according to the following criteria; race 0 infected all of four differential cultivars, race 1 infects Marathon F1, Tokyo Cross Hybrid Turnip, and Seven Top Turnip but not Florid Broad Leaf, race 2 infects Marathon F1, Tokyo Cross Hybrid Turnip, and Florid Broad Leaf but not Seven Top Turnip, race 3 infects Marathon F1 and Seven Top Turnip but not Tokyo Cross Hybrid Turnip and Florid Broad Leaf, race 4 infects only Marathon F1 [5,7].
2.3. DNA Polymorphism and QTL Analysis
The sample set of Genomic DNA of the parents and 94 F2 individuals used in the study of [19] was also used for the linkage construction. DNA of each sample was amplified by the GenomiPhi V2 DNA Amplification kit (GE Healthcare). Ten µl PCR cocktail containing 10 ng genomic DNA, 0.2 µM each primer and 1× EmeraldAmp Max PCR Master Mix (Takara Bio. Inc., Japan) were used for CAPS (Cleaved Amplified Polymorphic Sequences) and SSR (Simple Sequence Repeat) analyses. Standard three step PCR was performed. Annealing temperature and extension time for PCR were set according to the primer sequence and gene size. The primer sequences were taken from various reports listed in Table 1. For CAPS analysis, the amplicons were digested with one of four restriction enzymes (AluI, MspI, HinfI or MboI). DNA fragments obtained from restriction enzyme digestion and PCR were separated on 8% - 15% polyacrylamide gel according to fragment size [30]. The gel was subsequently stained with a Gelstar solution (0.1
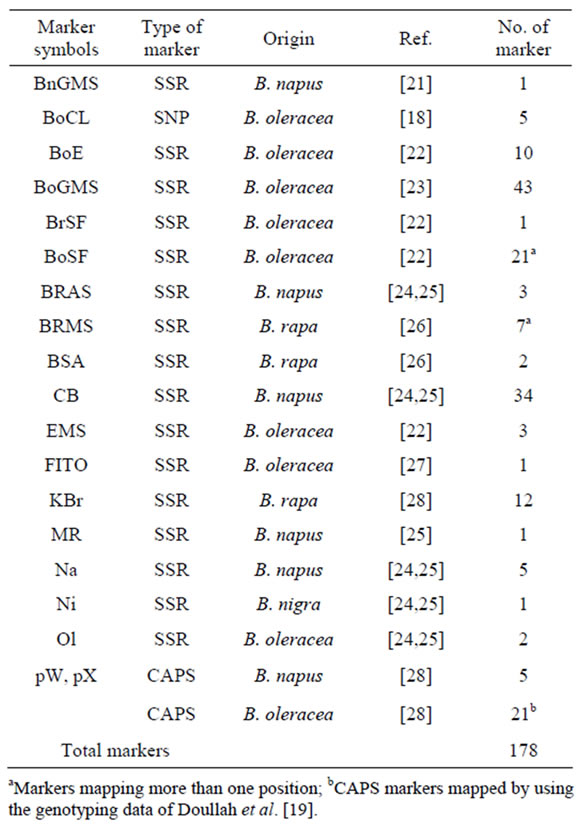
Table 1. List of DNA markers used in this study.
aMarkers mapping more than one position; bCAPS markers mapped by using the genotyping data of Doullah et al. [19].
µl/10ml) (Takara Bio. Inc., Japan).
Linkage analysis was performed using Ant Map programe, version 1.2 [31]. The QTL detection for X. campestris pv. campestris resistance was analyzed using a QTL Cartographer software version 2.5 [32] in which composite interval mapping(CIM). CIMs were performed at LOD threshold values which were estimated by means of a permutation test with 1000 permutations with QTL Cartographer.
2.4. Alignment of Different Maps
Previous studies identified four Xcc resistance QTLs [17] and self-incompatibility locus [33] in the cabbage BI-16× broccoli OSU Cr-7 mapping population, of which linkage map was constructed using WG, TG, and EC RFLP markers. Those markers were renamed as pW and pX according to the NCBI DNA data base. In order to correlate all the linkage groups of the BI-16×OSU Cr-7 map to the international nomenclature established for the C genome, we aligned the BI-16×OSU Cr-7 map to the consensus map constructed by [29]. After that, common pW and pX markers were used as anchor markers for map position comparisons of Xcc resistance QTLs. DNA sequences of the pW/pX RFLP markers were collected from NCBI DNA data base, and then, by using those DNA sequences, we did BLAST search at the Brassica oleracea Genomics Project web site, Bolbase, to obtain coding sequences or genomic sequences corresponding to the RFLP markers. From the identified DNA sequences, we designed primer sets by which the chromosomal regions specifically associated with the pW/pX markers were detected (Table 2). For comparison of positions of QTLs identified by [18] and our map, the primer sets were designed based on the sequence of the EST-SNP markers that [18] described. By using the primer set, we amplified the chromosomal region identified by EST-SNP markers and, thereafter, detected the polymorphism by CAPS or PCR-SSCP analysis.
3. Results
For race identification, the lesions on the susceptible differential cultivars and GC P09, enlarged towards the midrib, resulting in typical chlorotic V-shaped lesions (Figure 1). The V-shaped lesion was regarded as a triangle shape to calculate disease leaf area (DLA). The lesion on the resistant cultivars and the parent, Reiho P01, was restricted in the portion of leaves that was inoculated by nail cutter with the bacteria suspension after 15 days of inoculation; indicating typically resistant to black rot disease. As a result, among the differential cultivars, only Florida broad leaf (mustard) was found to be resistant to the race (isolate no. 03-01967). This type of reaction

Table 2. List of the primer sequences by which the chromosomal regions mapped by pW, PX and BoCL markers were detected.
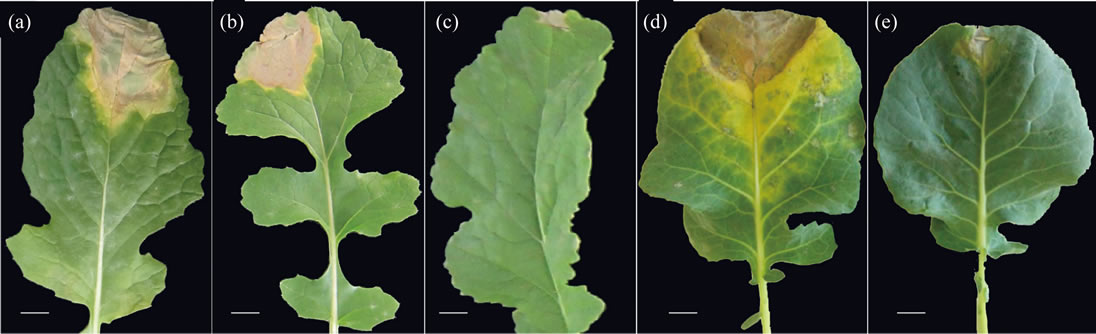
Figure 1. Black rot disease symptoms produced on differential cultivars and the parent used in QTL analysis. (a) Tokyo Cross Hybrid Turnip; (b) Seven Top Turnip; (c) Florida Broad Leaf; (d) GCP09; (e) Reiho P01. Bar = 1 cm.
between the differential cultivars and the isolates (see Materials and Methods) revealed that the race used in this study was race 1 (Table 3).
In the present study, the inoculation data was cited from [19] who reported that DLA of the F3 lines showed a continuous distribution pattern, with some F3 lines showing lower DLA values than the resistant parent (Figure 2). This time the genotyping of each F2 plant at the Xcc-resistance QTL (XccBo(Reiho)2) was newly conducted to analyze association between phenotypic and genotypic data of F2 plants (Details given later).
In this study, 94 F2 individuals were used for the linkage construction. A total 181 markers were distributed in 9 linkage groups covering 1099.4 cM, and the average interval between markers was 6.1 cM. The linkage map included 155 SSR and 26 CAPS markers (Table 4). To align our map to the internationally accepted Brassica map, we used pW, pX, CB, BRMS, BoGMS and BoSF, markers reported by [22-24,26,29,34].
QTL analysis was performed using the appropriate significance threshold calculated in the permutation test (1000 iterations) and we detected three significant QTLs (Table 5, Figure 3). These results indicated that Xcc resistance was controlled by an oligogenic system. Three QTLs for Xcc resistance were detected in C5, C8, and C9. The largest QTL effect (LOD of 7.7) for Xcc resistance was detected between the loci EMS1010 and CB10419 on C8 and was closely linked to marker BoGMS0971. This QTL, which explained 34% of the total phenotypic variation, was named XccBo(Reiho)2. The QTL located in C9 came from the susceptible broccoli parent (Table 5), and therefore this Xcc locus was named XccBo(GC)1. Despite high susceptibility of the susceptible parent GC P09 to Xcc, this Xcc locus accounted for 17.9% of the variation, suggesting that there may be epistatic genes that interact with XccBo(GC)1 in other regions of the genome. The other minor QTLs found in C5, which came from the resistant parent, accounted for 6.6% of the variation, named XccBo(Reiho)1. Genotyping at the BoGMS0971 marker that was closely linked to the major QTL indicated that higher resistance was associated with the homozygous Reiho genotype versus the homozygous GC genotype, with the heterozygotes having varying resistance levels (Figure 2).
For comparison of the positions of Xcc resistance QTLs identified by different authors [17,18], we first compared the linkage map (I) of [17] with the linkage map (II) of [33] who mapped self-incompatibility locus.
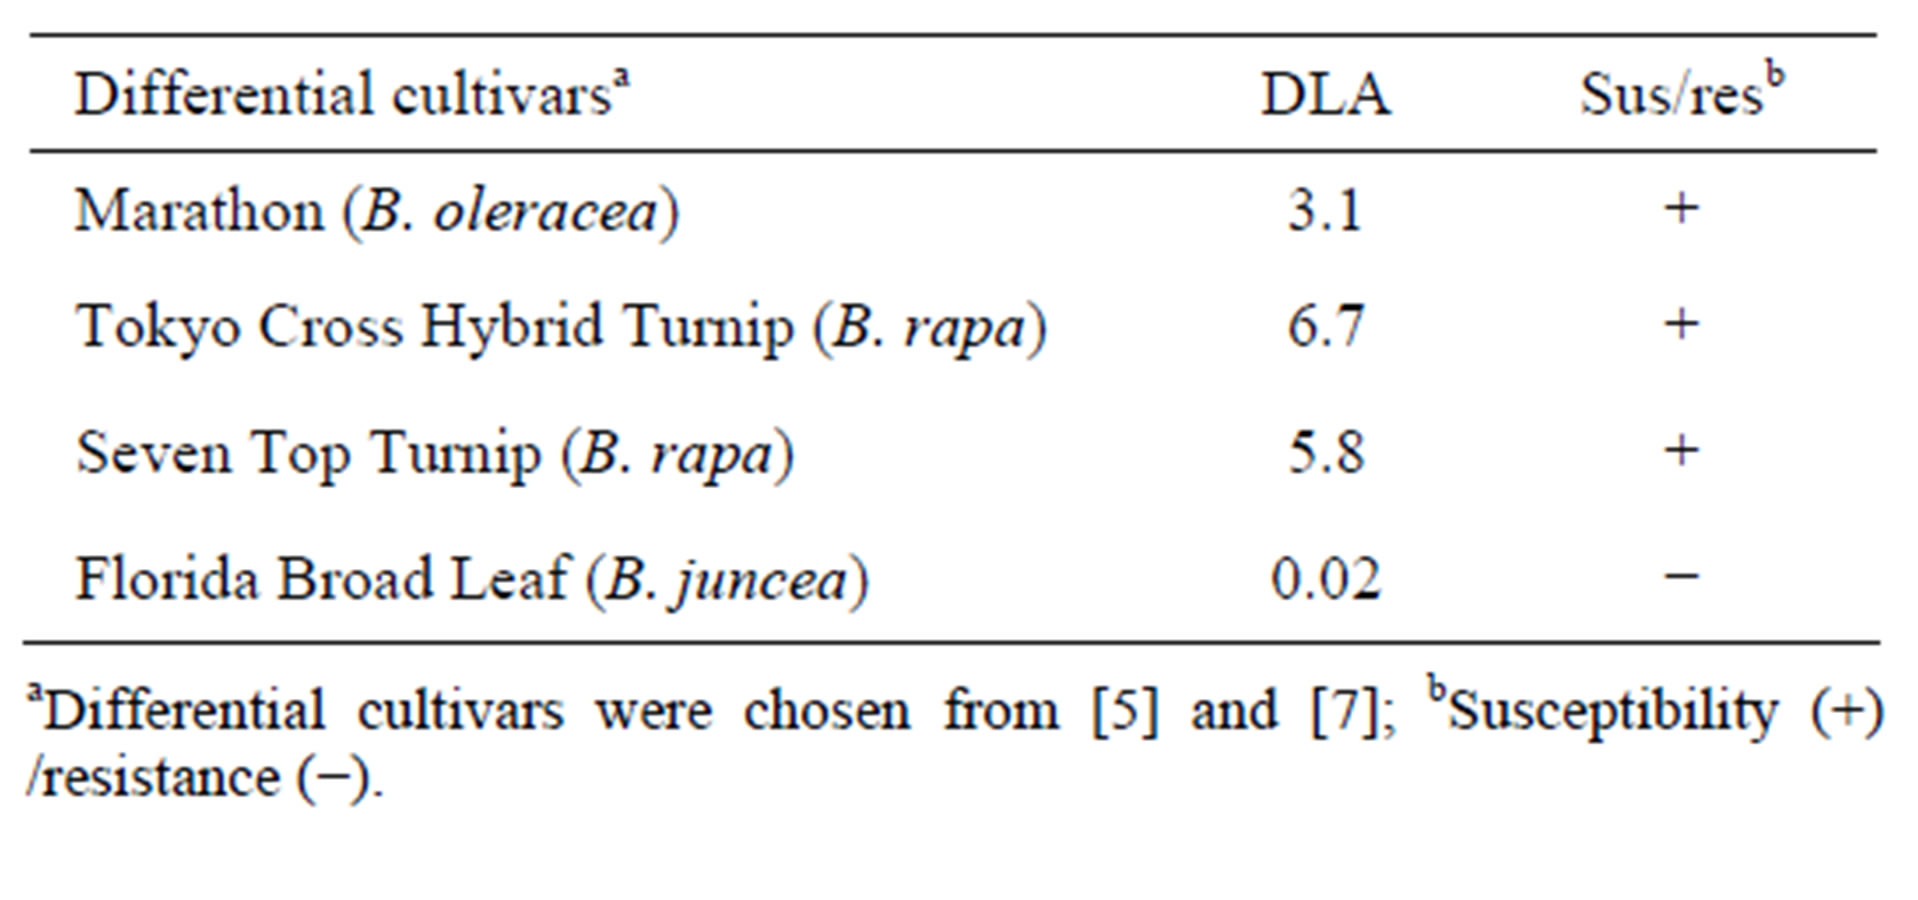
Table 3. Race identification by using differential cultivars.
aDifferential cultivars were chosen from [5] and [7]; bSusceptibility (+) /resistance (−).
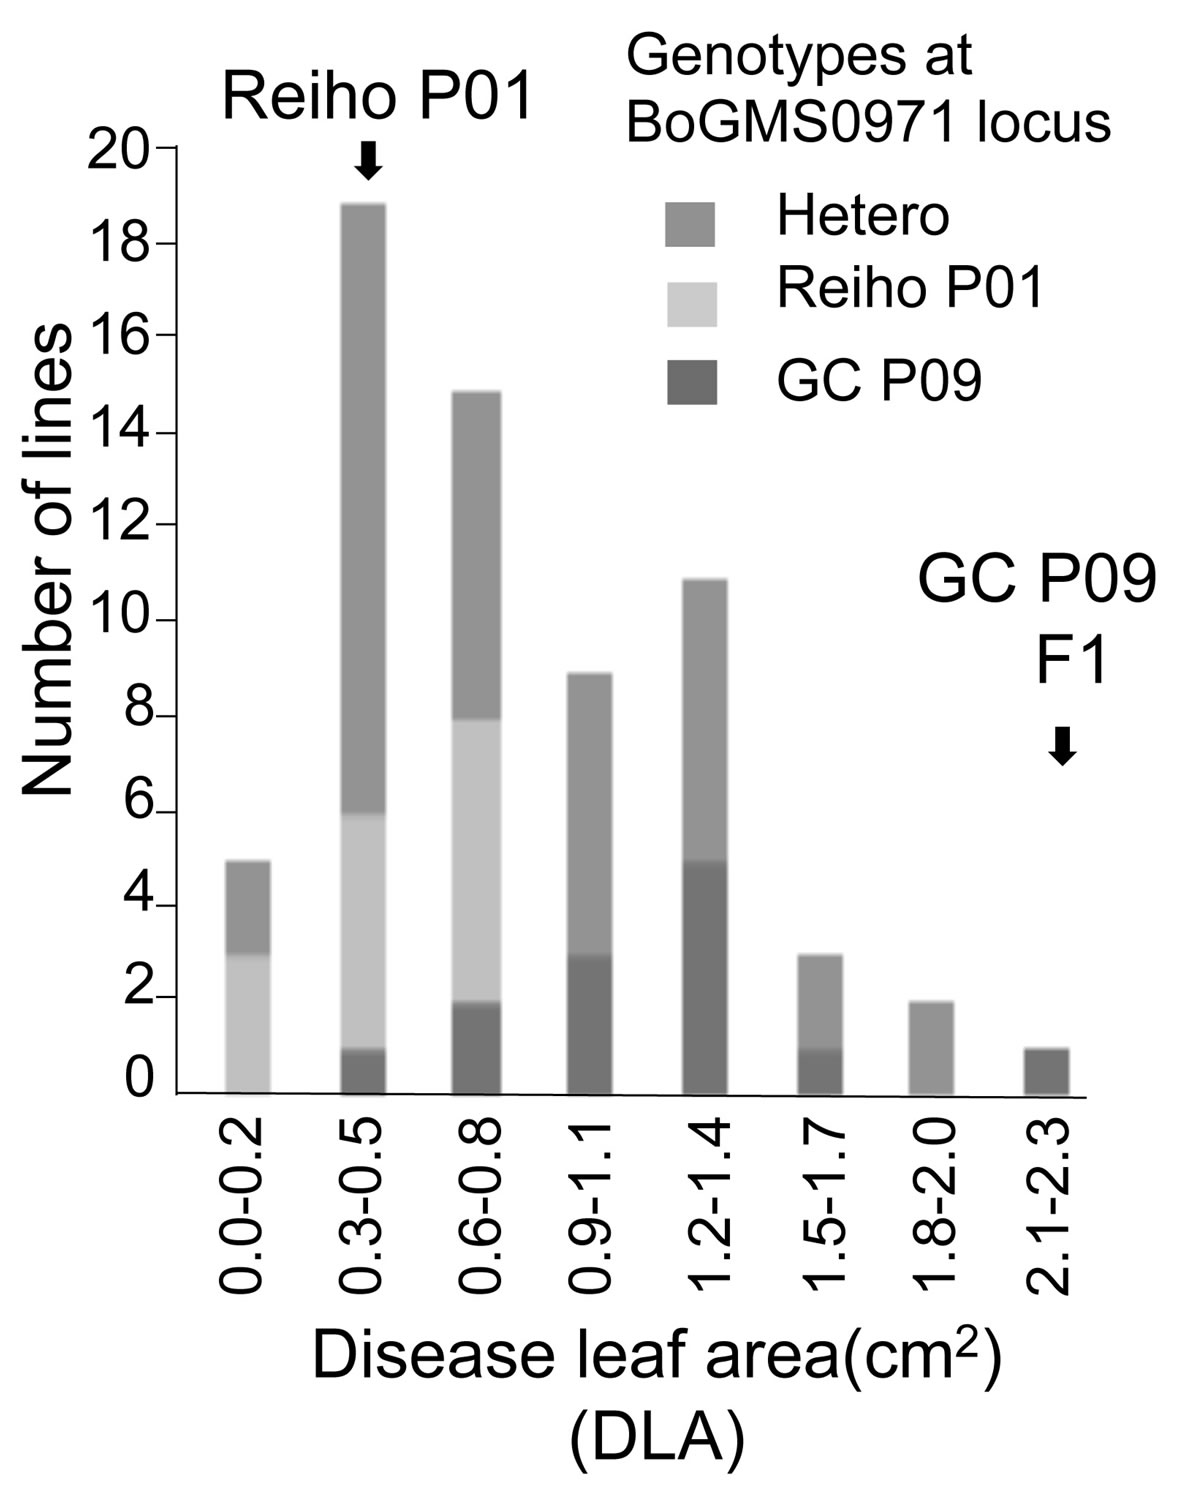
Figure 2. Genotyping data at BoGMS0971 locus in the mapping population that Doullah et al. (2010) described previously. Frequency distribution data of mean diseased leaf area (DLA) of black rot disease in the F3 lines. Arrows indicate values obtained for parental (Reiho P01 and GC P09) and F1 plants. The mapping population were genotyped at the BoGMS0971 locus. F2 plants homozygous for the ‘Reiho’ BoGMS0971 locus, homozygous for the ‘GC’ BoGMS0971 locus, or heterozygous at the BoGMS0971 locus are indicated by light gray, gray, or medium gray bars, respectively.

Table 4. Characteristics of B. oleracea linkage map.
Although they used the same mapping population (BI-16×OSU Cr-7), the constructed linkage group numbering differed; the LG2 in linkage map (I) corresponded to LG2 and LG9 in linkage map (II), and LG9 in linkage map (I) to the upper portion of LG1 in linkage map (II) (Table 6). Next, for assigning positions of Xcc resistance QTLs identified by [17] to the consensus map constructed by [29], common pW and pX markers in the two linkage maps were used as anchor markers (Figure 4). As a result, LG1 and LG9, that had the major QTLs in BI-16×OSU Cr-7 mapping population, were assigned to the lower portion of C3 and the bottom distal end of C9, respectively. The two minor Xcc resistance QTLs on LG2 corresponded to C5 and C6, respectively. The markers, pW164 (WG3C5) and pW114 (TG4D2), that were closely linked to one of the Xcc resistance QTLs identified in LG2 by [17] were mapped to the central portion of C5 in our map, where XccBo(Reiho)1 located. Similarly, the markers, pW143 (WG8A9) and pX117 (EC2D9), that were closely linked to the QTL identified in LG9 were mapped to the distal end of C9 in our map where XccBo(GC)1 was located. The BoCL6244s marker closely linked to the QTL-3 mapped by [18] was mapped in the central region of C5 in our map. The two Xcc resistance QTLs on C3 and C9 were detected by [19] who used the same mapping population used for our study. In the present study, we did not detect significant QTLs on the bottom distal end of C3, although there was a LOD peak (LOD = 2.1) in the same region of C3 where [19] found the Xcc resistance QTL.
4. Discussion
Previous studies reported that resistance to Xcc occurs with race-specific manner in cruciferous plants including common Brassica species and such interaction between Xcc and its host was controlled by a gene-for-gene relationship [6,15]. Single dominant genes that are highly resistant against Xcc races have been commonly found in B. nigra, B. rapa and their amphidiploid species, whereas a few sources of race-specific resistance have been identified in B. oleracea. On the other hand, non-differential resistance has been found in B. oleracea [8]; for instance, [15] reported that F1 plants obtained from the cross of resistant cabbage BI-16 × A12DHd were susceptible and the subsequent F2 plants showed quantitative resistance to Xcc races 1 and 3, indicating that resistance was mainly controlled by one recessive gene (xca6) or by linked genes. [16] found that resistance of BI-16 was quantitative under oligogenic control. In the GC P09 × Reiho P01 mapping population, appearance of susceptible phenotype in F1 plants and detection of multiple QTLs controlling resistance to Xcc ([19], this study)
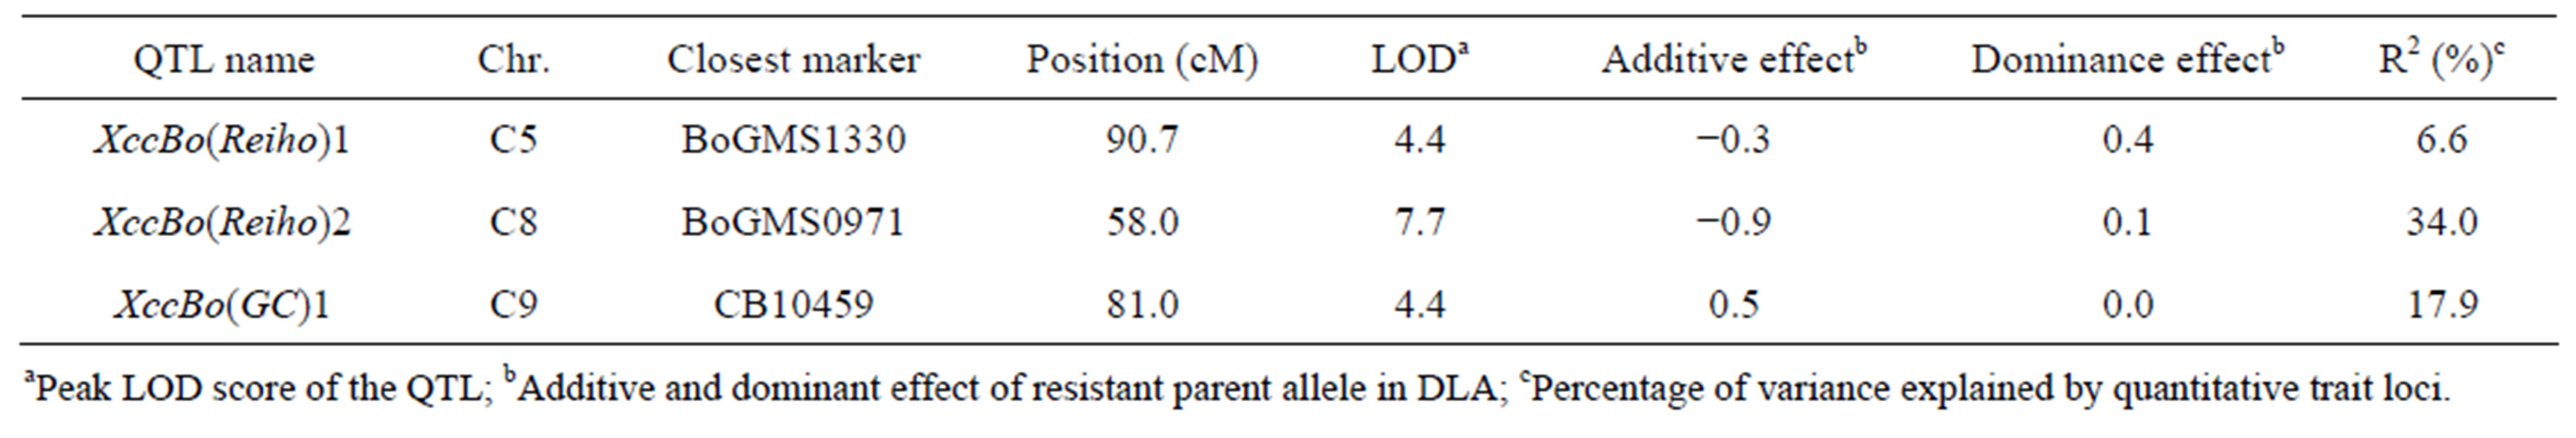
Table 5. Summary of QTLs significantly detected for black rot disease against Xcc race 1 using F2 populations derived from GC P09 × Reiho P01.
aPeak LOD score of the QTL; bAdditive and dominant effect of resistant parent allele in DLA; cPercentage of variance explained by quantitative trait loci.
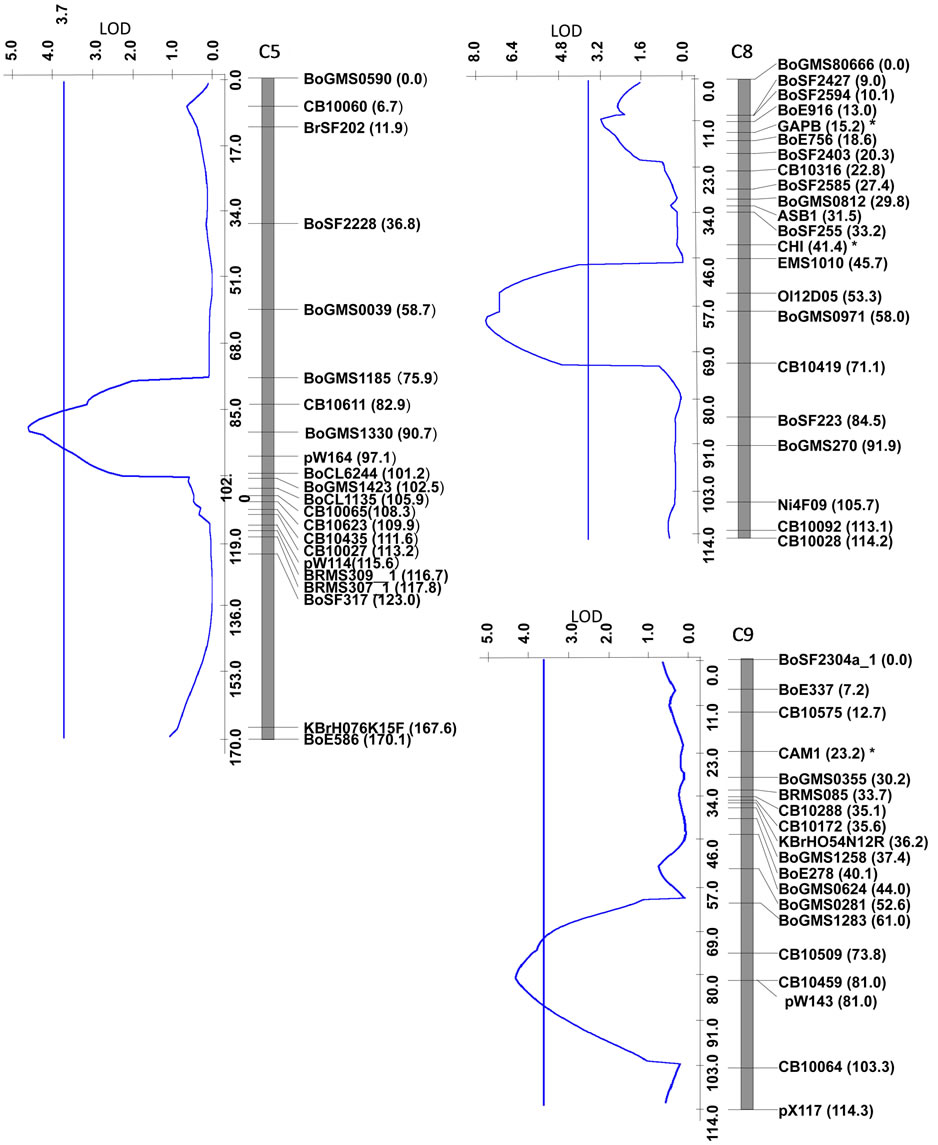
Figure 3. Linkage map developed in the segregating F2 population of broccoli GC (P09) × cabbage Reiho (P01), and LOD profiles for Xcc resistance. LOD score profiles and the threshold level (3.6) are shown by blue lines. Linkage groups (O5, O8, O9) that internationally agree with B. oleracea reference linkage group nomenclature are indicated at the top of each linkage group. Locus names are indicated on the right side of linkage groups, and map distances in centimorgans are shown in parentheses. CB, BoSF, BoE, BRMS, Ni, Ol, BoGMS, and KBrH markers are cited from various authors (Table 1). The CAPS markers shown by asterisks were mapped by using the data of Doullah et al. [19].
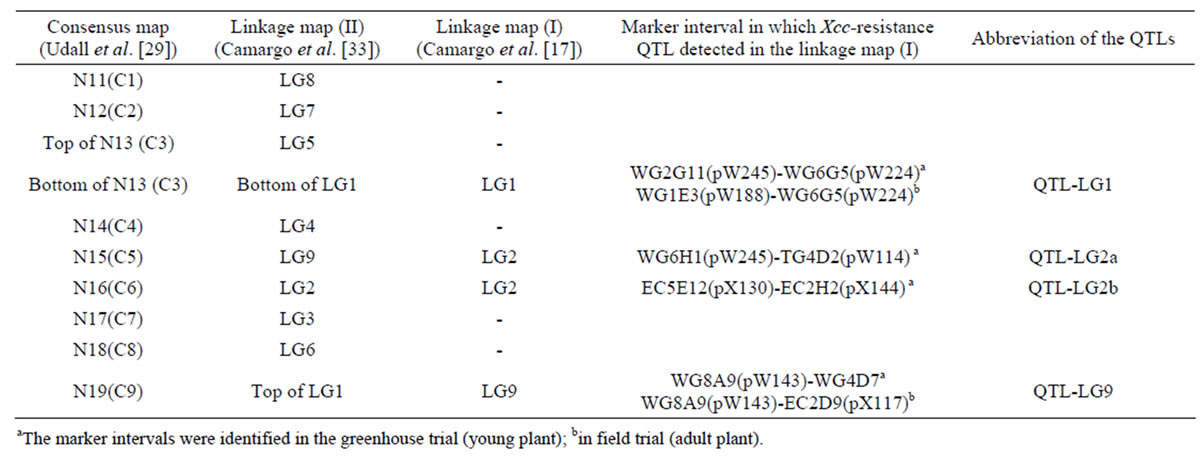
Table 6. Alignment of linkage maps for assigning positions of Xcc-resistance QTLs identified by Camargo et al. (1995) on the consensus map.
aThe marker intervals were identified in the greenhouse trial (young plant); bin field trial (adult plant).
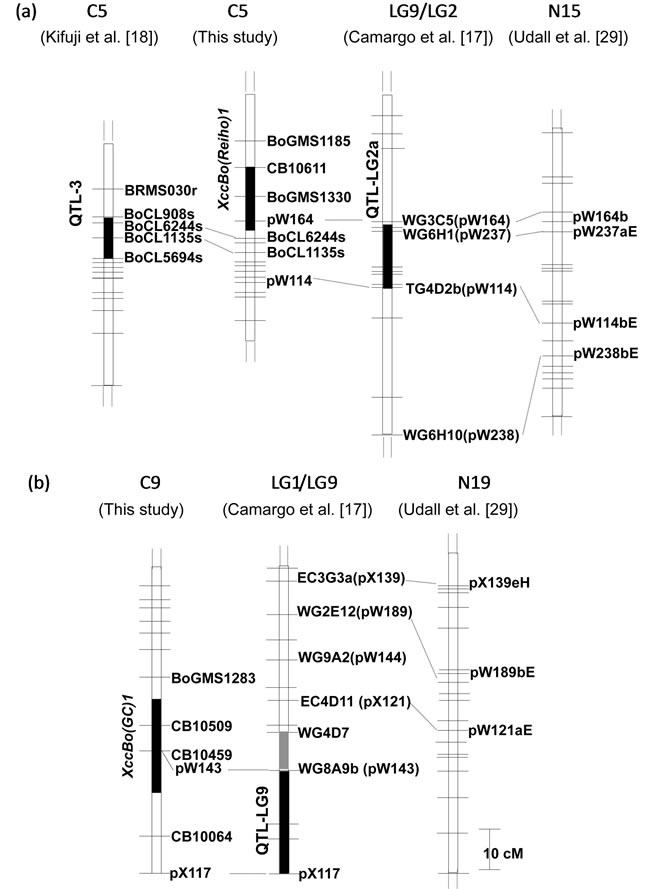
Figure 4. Comparison of chromosomal positions of Xcc resistance QTLs on C5 (a) and C9 (b). The filled vertical bars indicate the marker intervals where the Xcc resistance QTLs identified by Camargo et al. [17], Kifuji et al. [18] and this study. The gray and black vertical bars on LG1/LG9 represent QTLs identified by Camargo et al. [17] in the greenhouse and the field trials, respectively. The numbers at the top indicate B. oleracea reference linkage groups. Consensus map constructed by Udall et al. [29] (right) was aligned to identify linkage groups constructed by Camargo et al. [17]. Horizontal bars indicate the positions of markers including in each map and the marker names were omitted.
showed that the inheritance of resistance to Xcc was recessive and controlled in a quantitative manner.
Taken together, both single (qualitative) and multiple (quantitative) resistance genes must control resistance to Xcc in B. oleracea.
Our linkage map was constructed from the 94 F2 plants derived from the cross of GC P09 × Reiho P01 and comprises nine linkage groups, corresponding to the nine chromosomes of B. oleracea. The map length of 1099.4 cM was similar to the map length, 1112, 1048, and 1197.9 cM of [22,28,35], respectively, and longer than the map lengths, 891.4, 320.5, 928.7 cM of [18,19,27], respectively. In our map, the average interval between markers was 6.1 cM, indicating that the length and marker distribution of our map were suitable for QTL analysis of Xcc resistance. In our study, the QTL analysis that was performed using the appropriate significance threshold successfully detected several significant QTLs, indicating that Xcc resistance was controlled by an oligogenic system. We detected one major locus Xcc Bo(Reiho)2 on C8 that accounted for 34% of the variation. Alleles from Reiho at the XccBo(Reiho)2 locus act additively and contribute to resistance, as indicated by the negative value of the additive gene action. Genotyping at the BoGMS0971 marker that was closely linked to XccBo(Reiho)2 showed that the homozygous Reiho genotypes were resistant, whereas the homozygous GC genotypes tended to be susceptible, and the resistance level of the heterozygotes fluctuated (Figure 2). This result suggests that the Xcc resistance gene at the XccBo(Reiho)2 locus established stable expression in homozygous plants. We identified two smaller QTLs, XccBo(Reiho)1 and XccBo(GC)1, on C5 and C9, respectively. The resistance allele at XccBo(GC)1 locus on C9 comes from the susceptible parent. This secret gene effect could explain the fact that some plants exhibited transgressive segregation beyond the level of the resistant parent. In fact, the five most resistant F3 lines were derived from F2 plants which were either homozygous for broccoli alleles or heterozygous at this locus on C9. The disease resistance alleles coming from susceptible parents have been reported in QTL analyses of black rot [17] and clubroot [28] in B. oleracea and leaf blight in Zea mays [36].
[17] identified the four Xcc resistance QTLs in the BI-16×OSU Cr-7 map in which two QTLs on LG1 (abbreviation, QTL-LG1) and LG9 (QTL-LG9) were associated with both young and adult plant resistance and the two additional QTLs on LG2 (QTL-LG2a, QTL-LG2b) were associated only with young plant resistance. [18] detected the three Xcc resistance QTLs on C2, C4 and C5. Comparative map data with the common pW, pX and BoCL markers revealed that the central portion of C5 harboring XccBo(Reiho)1 corresponded to that of QTLLG2a identified by [17] as well as to that of QTL-3 identified by [18]. Furthermore, the bottom distal end of C9 harboring XccBo(GC)1 corresponded to that of QTLLG9 identified at the interval pX117 (EC2D9)-pW143 (WG8A9). The assignment of different linkage maps with the common markers suggests that our identified QTL, XccBo(Reiho)1, may be equivalent to QTL-LG2a and QTL-3 identified by [17] and [18], respectively, and furthermore, the XccBo(GC)1 may correlate to QTL-LG9 identified by [17]. The QTL-LG1 in the BI-16×OSU Cr- 7 map corresponded to the bottom distal end of C3 based on the location of pW125, pW181, pW245 and pW188 markers (data not shown). We also mapped pW188 on the distal end of C3 in our linkage map where one candidate QTL (LOD = 2.1) was detected. However, it is difficult to conclude whether the QTLs that are linked to the same molecular markers involve just one gene or are family members of clustered Xcc resistance genes. Microsynteny analysis in these regions in B. oleracea is needed to identify the relationship between these resistance loci.
Although we identified the XccBo(Reiho)2 on C8, previous authors did not find any Xcc resistance QTLs on C8 [17-19]. The discrepancy in positions of the detected QTLs might be due to differences of races used, inoculation methods, and plant materials. In addition, the magnitude of QTL effects could change in response to different environmental conditions. The upper part of C5, one of middle part of C8 and the distal end of C8 shared conserved regions with Arabidopsis thaliana chromosome 1 [37,38]. In addition, it is known that the large conserved regions are duplicated in C5 and C8 [38,39]. This indicates that XccBo(Reiho)1 on C5 and XccBo(Reiho)2 on C8 might be homologous loci. The diploid Brassica genome was formed by the whole-genome triplication followed by multiple chromosome rearrangements via insertions, deletions, and translocations. Through this process, disease resistance genes were located on various chromosomal regions and furthermore, clustering of disease resistance genes occurred as a result of long-term host-parasite co-evolution [40]. The QTL regions conferring Xcc resistance to B. oleracea plants might have originated from common chromosomal regions existing in the progenitor diploid species.
Screening genetic resources of B. oleracea revealed that resistance to race 3 and race 5 is common, but resistance to race 1 is very rare [8]. Therefore, our finding three QTLs that conferred resistance to race 1 is important for resistant breeding in B. oleracea. Pyramiding those QTLs, one novel major QTL on C8 and the other two QTLs that might coincide with previously mapped QTLs, will promote Xcc resistance breeding in B. oleracea, and the markers closely linked to the QTLs will be useful in MAS for improving resistance to black rot across environments.
REFERENCES
- P. H. Williams, “Black Rot: A Counting Threat to World Crucifers,” Plant Disease, Vol. 64, 1980, pp. 736-742. doi:10.1094/PD-64-736
- A. M. Shelton and J. E. Hunter, “Evaluation of the Potential of the Flea Bettle Phyllotreta cruciferae to Transmit Xanthomonas campestris pv. campestris, Casual Agent of Black Rot of Crucifers,” Canadian Journal of Plant Pathology, Vol. 7, 1985, pp. 308-310. doi:10.1080/07060668509501696
- A. A. Cook, J. C. Walker and R. H. Larson, “Studies on the Disease Cycle of Black Rot of Crucifers,” Phytopathology, Vol. 42, 1952, pp. 162-167.
- N. W. Schaad and J. C. Dianese, “Cruciferous Weeds as Sources of Inoculum of Xanthomonas campestris in Black Rot of Crucifers,” Phytopathology, Vol. 71, 1981, pp. 1215-1220. doi:10.1094/Phyto-71-1215
- S. Kamoun, H. V. Kamdar, E. Tola and C. I. Kado, “Incompatible Interactions between Crucifers and Xanthomonas campestris Involve a Vascular Hypersensitive Response: Role of the Hrpx Locus,” Molecular Plant-Microbe Interactions, Vol. 5, No. 1, 1992, pp. 22-23. doi:10.1094/MPMI-5-022
- A. Ignatov, Y. Kuginuki and K. Hida, “Race-Specific Reaction of Resistance to Black Rot in Brassica Oleracea,” European Journal of Plant Pathology, Vol. 104, No. 8, 1998, pp. 821-827. doi:10.1023/A:1008642829156
- J. G. Vicente, J. Conway,S. J. Roberts and J. D. Taylor, “Identification and Origin of Xanthomonas campestris pv. campestris Races and Related Pathovers,” Phytopathology, Vol. 91, No. 5, 2001, pp. 492-499. doi:10.1094/PHYTO.2001.91.5.492
- J. D. Taylor, J. Conway, S. J. Roberts, D. Astley and J. G. Vicente, “Sources and Origin of Resistance to Xanthomonas campestris pv. campestris in Brassica Genomes,” Phytopathology, Vol. 92, No. 1, 2002, pp. 105-111. doi:10.1094/PHYTO.2002.92.1.105
- E. Fargier and C. Manceau, “Pathogenicity Assays Restrict the Species Xanthomonas campestris into Three Pathovars and Reveal Nine Races Within Xanthomonas campestris pv. campestris,” Plant Pathology, Vol. 56, No. 5, 2007, pp. 805-818. doi:10.1111/j.1365-3059.2007.01648.x
- P. Soengas, P. Hand, J. G. Vicente, J. Pole and D. A. C. Pink, “Identification of Quantitative Trait Loci for Resistance to Xanthomonas campestris pv. Campestris in Brassica Rapa,” Theoritical applied Genetics. Vol. 114, No. 4, 2007, pp. 637-645.
- D. C. Bain, “Reaction of Brassica Seedlings to Black Rot,” Phytopathology, Vol. 42, No. 6, 1952, pp. 497-500.
- R. Sharma, V. Swarup and S. S.Chatterjee, “Resistance to Black Rot Disease (Xanthomonas campestris (Pam.) Dowson, in Cauliflower,” Scientia Horticulturae, Vol. 7, No. 1, 1977, pp. 1-7. doi:10.1016/0304-4238(77)90037-1
- M. E. Ferreira, J. S. Dias, A. Mengistu and P. W. Williams, “Screening of Portuguese Cole Landraces (Brassica oleracea L.) with Leptosphaeri amaculans and Xanthomonas campestris pv. Campestris,” Euphytica, Vol. 65, No. 3, 1993, pp. 219-228. doi:10.1007/BF00023086
- A. L. Westman, S. Kresovich and M. H. Dickson, “Regional Variation in Brassica nigra and Other Weedy Crucifers for Disease Reaction to Alternaria brassicicola and Xanthomonas campestris pv. campestris,” Euphytica, Vol. 106, No. 3, 1999, pp. 253-259. doi:10.1023/A:1003544025146
- J. G. Vicente, J. D. Taylor, A. G. Sharp, I. A. P. Parkin, D. J. Lydiate and G. J. King, “Inheritance of Race-Specific Resistance to Xanthomonas campestris pv. campestris in Brassica Genomes,” Phytopathology, Vol. 92, No. 10, 2002, pp. 1134-1141. doi:10.1094/PHYTO.2002.92.10.1134
- P. H. Williams, T. Staub and J. C. Sutton, “Inheritance of Resistance in Cabbage to Black Rot,” Phytopathology, Vol. 62, 1972, pp. 247-249. doi:10.1094/Phyto-62-247
- L. E. A. Camargo, P. H. Williams and T. C. Osborn, “Mapping of Quantitative Trait Loci Controlling Resistance of Brassica oleracea to Xanthomonas campestris pv. campestris in the Field and Greenhouse,” Phytopathology, Vol. 85, No. 2, 1995, pp. 1296-1300. doi:10.1094/Phyto-85-1296
- Y. Kifuji, H. Hanzawa, Y. Terasawa, Ashutosh and T. Nishio, “QTL Analysis of Black Rot Resistance in Cabbage Using Newly Developed EST-SNP Markers,” Euphytica, Vol. 190, No. 2, 2013, pp. 289-295. doi:10.1007/s10681-012-0847-1
- M. A. U. Doullah, G. M. Mohsin, K. Ishikawa, H. Hori and K. Okazaki, “Construction of a Linkage Map and QTL Analysis for Black Rot Resistance in Brassica oleracea L,” International Journal of Natural Sciences, Vol. 1, No. 1, 2011, pp. 1-6. doi:10.3329/ijns.v1i1.8591
- K. Ohata, K. Seruzawa, K. Azegami and A. Shirata, “Possibility of Seed Transmission of Xanthomonas campestris pv. vitians, the Pathogen of Bacterial Spot of Lettuce,” Bulletin of the National Institute of Agricultural Sciences Series C. Plant Pathology and Entomology, Vol. 36, 1982, pp. 81-88.
- X. Cheng, J. Xu, S. Xia, J. Gu, Y. Yang, J. Fu, X. Qian, S. Zhang, J. Wu and K. Liu, “Development and Genetic Mapping of Microsattelite Markers from Genome Survey Sequences in Brassica napus,” Vol. 118, No. 6, 2009, pp. 1121-1131.
- W. Wang, S. Huang, Y. Liu, Z. Fang,L. Yang, W. Hua, S. Yuan, S. Liu, J. Sun, M. Zhuang, Y. Zhang and A. Zeng, “Construction and Analysis of a High-Density Genetic Linkage Map in Cabbage (Brassica oleracea L. var. Capitata),” BMC Genomics, Vol. 13, 2012, p. 523. doi:10.1186/1471-2164-13-523
- H. Li, X. Chen, Y. Yang, J. Xu, J. Gu, J. Fu, X. Qian, S. Zhang, J. Wu and K. Liu, “Development and Genetic Mapping of Microsatellite Markers from Whole Genome Shotgun Sequences in Brassica Oleracea,” Molecular Breeding, Vol. 28, No. 4, 2011, pp. 585-596. doi:10.1007/s11032-010-9509-y
- J. Piquemal, E. Cinquin, F. Couton,C. Rondeau, E. Seignoret, I. Doucet, D. Perret, M. J. Villeger, P. Vincourt and P. Blanchard, “Construction of an Oilseed Rape (Brassica napus L.) Genetic Map with SSR Markers,” Theoretical and Applied Genetics, Vol. 111, No. 8, 2005, pp. 1514-1523. doi:10.1007/s00122-005-0080-6
- M. Radoev, H. C. Becker and W. Ecke, “Genetic Analysis of Heterosis for Yield and Yield Components in Rapeseed (Brassica napus L.) by Quantitative Trait Locus Mapping,” Genetics, Vol. 179, No. 3, 2008, pp. 1547- 1558. doi:10.1534/genetics.108.089680
- K. Suwabe, H. Tsukazaki, H. Iketani, K. Hatakeyama, M. Kondo, M. Fujimura, T. Nunome, H. Fukuoka, M. Hirai and S. Matsumoto, “Simple Sequence Repeat-Based Comparative Genomics Between Brassica rapa and Arabidopsis thaliana: The Genetic Origin of Club Root Resistance,” Genetics, Vol. 170, No. 1, 2006, pp. 309-319. doi:10.1534/genetics.104.038968
- F. L. Iniguez-Luy, L. Lukens, M. W. Farnham, R. M. Amasino and T. C. Osborn, “Development of Public Immortal Mapping Populations, Molecular Markers and Linkage Maps for Rapid Cycling Brassica rapa and B. oleracea,” Theoretical and Applied Genetics, Vol. 120, No. 1, 2009, pp. 31-43. doi:10.1007/s00122-009-1157-4
- T. Nagaoka, M. A. U. Doullah, S. Matsumoto, S. Kawasaki, T. Ishikawa, H. Hori and K. Okazaki, “Identification of QTLs That Control Club Root Resistance in Brassica oleracea and Comparative Analysis of Club Root Resistance Genes between B. rapa and B. oleracea,” Theoritical and Applied Genetics, Vol. 120, No. 7, 2010, pp. 1335-1346.
- J. A. Udall, P. A. Quijada and T. C. Osborn, “Detection of Chromosomal Rearrangements Derived from Homologous Recombination in Four Mapping Populations of Brassica napus L.,” Genetics, Vol. 169, No. 2, 2005, pp. 967-979. doi:10.1534/genetics.104.033209
- S. Kikuchi, S. Taketa, M. Ichii and S. Kawasaki, “Efficient Fine Mapping of the Naked Caryopsis Gene (Nud) by HEGS (High Efficiency Genome Scanning)/AFLP in Barley,” Theoretical and Applied Genetics, Vol. 108, No. 1, 2004, pp. 73-78. doi:10.1007/s00122-003-1413-y
- H. Iwata and S. Ninomiya, “Antmap: Constructing Genetic Linkage Maps Using an Ant Colony Optimization,” Algorithm, Vol. 56, No. 4, 2006, pp. 371-377.
- C. J. Basten, B. S. Weir and Z. B. Zeng, “QTL Cartographer: A Reference Manual and Tutorial for QTL Mapping,” North Caroline State University, Raleigh, 2005.
- L. E. A. Camargo, L. Savides, G. Jung, J. Nienhuis and T. C. Osborn, “Location of the Self-Incompatibility Locus in an RFLP and RAPD Map of Brassica oleracea,” Journal of Heredity, Vol. 88, No. 1, 1997, pp. 57-60. doi:10.1093/oxfordjournals.jhered.a023057
- J. Wang, D. J. Lydiate, I. A. P. Parkin, C. Falentin, R. Delourme, P. W. C.Carion and G. J. King, “Integration of Linkage Maps for the Amphidiploid Brassica napus and Comparative Mapping With Arabidopsis and Brassica rapa,” BMC Genomics, Vol. 12, 2011, p. 101. doi:10.1186/1471-2164-12-101
- B. S. Landry, N. Hubert, R. Crete, M. Chang, S. E. Lincoln and T. Ethos, “A Genetic Map of Brassica oleracea Based on RFLP Markers Detected with Expressed DNA Sequences and Mapping of Resistance Genes to Race 2 of Plasmodiophora brassicae (Woronin),” Genome, Vol. 35, No. 3, 1992, pp. 409-419. doi:10.1139/g92-061
- A. W. Schechert, H. G. Welz and H. H. Geiger, “QTL for Resistance to Setosphaeria turcica in Tropical African Maize,” Crop Science, Vol. 39, No. 2, 1999, pp. 514-523. doi:10.2135/cropsci1999.0011183X003900020036x
- L. Lukens, F. Zou, D. Lydiate, I. Parkin and T. Osborn, “Comparison of a Brassica oleracea genetic Map with the Genome of Arabidopsis thaliana,” Genetics, Vol. 164, No. 1, 2003, pp. 359-372.
- I. A. P. Parkin, S. M. Gulden, A. G. Sharpe, L. Lukens and M. Trick, “Segmental Structure of the Brassica napus Genome Based on Comparative Analysis with Arabidopsis Thaliana,” Genetics, Vol. 171, No. 2, 2005, pp. 765- 781. doi:10.1534/genetics.105.042093
- J. D. Carlier , C. S. Alabaça, N. H. Sousa, P. S. Coelho, A. A. Monteiro, A. H. Paterson and J. M. Leitão, “Physical Mapping in a Triplicated Genome: Mapping the Downy Mildew Resistance Locus Pp523 in Brassica oleracea L.,” G3 (Bethesda), Vol. 1, No. 7, 2011, pp. 593-601.
- E. B. Holub, “Organization of Resistance Genes in Arabidopsis,” In: I. R. Crute, E. B. Holub and J. J. Burdon, Eds., The Gene-for-Gene Relationship in Plant-Parasite Interactions, CAB Int. ,Wallingford, 1997, pp. 5-26.
NOTES
*This research was supported by the grant from the Ministry of Education, Culture, Sports, Science and Technology, Government of Japan (MonbukagakushoMEXT).
#Corresponding author.