American Journal of Plant Sciences
Vol.3 No.12(2012), Article ID:25483,8 pages DOI:10.4236/ajps.2012.312203
Genetic Distance Estimated by RAPD Markers and Performance of Topcross Hybrids in Popcorn
![]()
1Laboratory of Molecular Biology, Universidade Paranaense, Umuarama, Brazil; 2Agronomy Department, Universidade Estadual de Londrina, Londrina, Brazil; 3Instituto Agronômico do Paraná, Londrina, Brazil; 4Biology Department, Universidade Estadual de Londrina, Londrina, Brazil.
Email: *silviahulse@unipar.br
Received September 10th, 2012; revised October 16th, 2012; accepted November 26th, 2012
Keywords: Zea mays L.; Heterotic Groups; Molecular Markers; Testers; Expansion Volume; Yield
ABSTRACT
The purpose of this study was to investigate the diversity of 14 popcorn populations and a broad genetic base tester using molecular RAPD markers and to estimate the correlation between the genetic distances and the performance of topcross hybrids. For the evaluation of populations and hybrids resulting from topcrosses, the reduced model of Gardner was used. A genetic distance matrix was generated based on RAPD markers by Jaccard coefficient, and a dendrogram was constructed. In general, topcrosses performed better than the populations per se and evidenced heterosis occurrence in topcrosses. The trait grain weight is influenced by additive as much as by dominance effects. Genetic associations separated the populations in three groups, and RAPD showed to be a useful tool to determine the extension of genetic diversity in popcorn populations and to place genotypes in distinct heterotic groups. Correlations between genetic divergences, detected by RAPD, and the means observed in the topcross crosses were positive and non-significant for expansion volume, plant height, and female flowering, and were negative for grain weight.
1. Introduction
Heterosis exploitation in hybrid combinations has resulted in significant progress in plant breeding programs regarding grain yield increase. According to Ferreira et al. [1], the phenomenon of heterosis in F1 hybrids is mainly affected by the genetic diversity. It has been suggested that more genetically distant parents can result in a maximal heterosis expression. However, in maize, crosses between divergent parents can result in the break-up of the harmonic function of the alleles [2].
Prediction studies on the combining ability indicate that the heterosis degree of some important species and agronomic traits is related to genetic divergence. Considering costliness and time-consuming evaluation of hybrid heterosis in the field, the use of genetic markers to predict the best heterotic combinations is an interesting alternative. DNA molecular markers have been used due to some advantages, i.e., besides identifying great polymorphism, there is no interaction with the environment and markers can be evaluated at any development stage [3]. To identify superior agronomic traits in this germplasm type, molecular markers were used in studies of genetic diversity [4] and in the mapping of genes/QTLs that control important traits such as expansion volume [5].
Among the molecular markers, RAPD (Random Amplified Polymorphic DNA) are currently used due to their capacity to detect a high level of polymorphism in plants based on the exploration of wide genome regions [3]. In maize, this low-cost technique allows simple and fast polymorphism detection. However, some results obtained by different research techniques are contradictory regarding genetic divergence and heterosis. Smith et al. [6] demonstrated that RFLP analysis can be used to predict superior hybrid combinations. Lanza et al. [7] and Bruel et al. [8] managed to assign maize lines to heterotic groups and predict the best hybrid combinations with RAPD markers. On the other hand, some researchers found no correlation between the genetic distance estimated by molecular markers and the hybrid heterosis. Chen et al. [9] and Shieh & Thseng [2] observed no positive response between RAPD genetic diversity and hybrid performance.
Thus, the aim of this study was to estimate heterosis of agronomic traits, access genetic diversity in popcorn populations using RAPD markers and investigate how RAPD genetic distances and the mean performance of topcross hybrids are related.
2. Material and Methods
Fourteen popcorn populations were used: nine derived from local varieties in three stratified mass selection cycles, selected on farms in the north of the state of Paraná (UEL MP, UEL YY, UEL SI, UEL MPS, UEL BG, UEL PAG, UEL PAP, UEL ZP and UEL PP); two composites of the Embrapa Milho and Sorgo, Sete Lagoas, MG (CMS 42 and CMS 43); and three commercial populations (RS 20/FEPAGRO-RS, Capitão and Japonesa).
The topcross hybrids were obtained in the growing season 1997/1998, in the Experimental Area of the Instituto Agronômico de Paraná (IAPAR). 14 populations were sown separately as female rows and the tester, as male rows. The tester consisted of a seed mixture of equal shares [10] of all 14 populations, sown twice (7 days apart), alternating three male with two female rows. The female rows and the tester were sown in 10-m rows, 0.9m apart, with five plants per meter. The female rows were detasseled before male flowering began.
The populations and topcross hybrids were evaluated in the growing season 1999/2000 in a random block design, with 3 replications and 28 treatments (14 topcross hybrids and 14 populations. The corn was sown in experimental plots of two four-meter rows, 0.9 m apart, with five plants per meter on the Experimental Farm of Universidade Estadual de Londrina (UEL), PR, in November, 1999.
The following traits were evaluated: total grain weight per plot (GW, in kg·plot–1), corrected to a standard moisture of 13.5% and ideal stand (ST) of 40 plants, adjusted to t·ha–1 using the methodology of covariance correction [11]; expansion volume (EV, in mL·mL–1), evaluated in grains with 11% moisture, in microwaves [12]; plant height (PH, in meters), in three competitive plants per plot; and female flowering (FF, in days).![]()
SAS 8.0 program [13] was used for data analysis. The effect estimates of varieties (vj), variety heterosis (hj), general combining ability (gi) and analyses of variance of topcrosses were performed according to the methodology proposed by Chaves & Miranda Filho [10], based on the reduced model of Gardner [14]:
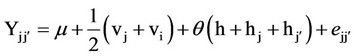
where: m = mean of the n parental varieties; vj and vj’ = variety effect; q = 0 for varieties (j = ) and 1 for hybrids (j ≠
 ); h = mean heterosis; hj and
  = variety heterosis; ejj = error adjusted to the treatment mean.
Seeds were germinated on moist paper towel to obtain DNA. After seven days, each population was represented by a bulk of young leaves from 30 plants. The leaf tissue was ground in liquid nitrogen and the genomic DNA extracted using the extraction protocol described by Ferreira & Grattapaglia [15]. Thereafter, the material was quantified in a Dyna-Quant fluorometer (Hofer-Pharmacia) and diluted to a final concentration of 10 ng·ml–1. RAPD reactions were carried out in a 15 µl final volume, containing 1 × PCR buffer (75 mM Tris-HCl pH 9.0, 50 mM KCl, 20 mM MgCl2 and 20 mM (NH4)2SO4), 0.1 mM of each dNTP, 0.5 mM of primer, 0.7 unit of Taq DNA polymerase (Biotools), and 20 ng DNA and double- distilled water to complete the volume. Twenty-four preselected decanucleotide primers were used (Table 1) (Operon Technologies, California, USA). The amplifications were performed in a PT-100 model (MJ Research) thermocycler, programmed to an initial stage of 3 minutes at 94˚C, 47 1-minute cycles at 94˚C (denaturation), 1.45 minutes at 38˚C (annealing), 2 minutes at 72˚C (polymerization), and a final extension stage of 6 minutes at 72˚C. After amplification, the total volume was inserted into agarose gel (1.2%) and stained with ethidium bromide (0.5 mg/ml). The amplified fragments were separated by electrophoresis in TAE buffer (0.04 M Tris-

Table 1. Used primers and their respective base sequences.
acetate and 0.01 M EDTA pH 7.5) at 100 volts for 3 hours, and visualized under UV light. Gel images were captured using a photographic documentation system for later analysis.
Based on gel evaluation, a similarity matrix was constructed where each band was considered a single trait, and its presence in a plant was designated as 1 (one) and the absence 0 (zero). Genetic associations among the samples were evaluated using the program NTSYS-pc 2.1 [16]. Genetic similarity (GS) was estimated based on Jaccard similarity coefficient, using the expression GSij = , where a = number of coincidences of type (1-1), b = number of discordances of type 1-0 and c = number of discordances of type 0-1. Genetic distances (GD) were estimated by DG = 1 − GS. The distances were represented in a simplified form by a dendrogram obtained by UPGMA clustering. The bootstrap procedure was applied to calculate the variance of genetic similarities based on the markers using the program DBOOT 1.1 [17]. The relationship between Jaccard genetic distances and topcross means was evaluated by Pearson correlation, using the Genes Program [18]. The correlation significance was verified by t test.
3. Results and Discussion
Significant differences were detected among the treatments and variety effect for the evaluated traits (GW, PH, FF), aside from EV (Table 2). The observed significances of mean heterosis ( )for GW, EV, PH, and FF indicate that the gene frequency variance among the varieties is great and dominance in at least part of the loci. The coefficients of variation (CV%) ranged from 1.91% for FF and 15.67% for GW, which is considered low based on the limits proposed by Scapim et al. [19] and indicates good experimental accuracy. For hj, , only GW and FF at 1% probability presented significant effects, indicating that the dominance components contributed to the increase of their mean and that there are more diversity among the studied genotypes and differences in the potential of these populations for the use in breeding programs.
On average, topcrosses performed better than the populations per se, making heterosis evident in topcrosses for GW (Table 3). Some breeders believe that the performance of topcross populations is harmed by a number of undesirable traits in crosses introduced by the tester alleles [20]. Theoretically, a tester contributes with 50% of the alleles, and only the other 50% represents the evaluated genotypes [21]. In this study, the tester discriminated topcrosses efficiently, making the identification of superior genotypes possible.
The genetic diversity evaluated by DNA molecular markers was analyzed by 24 RAPD primers, generating a total of 218 bands (Figure 1). 162 of them (74.3%) were polymorphic, and 56 (25.7%) monomorphic. The found polymorphism was similar to some results in the literature. Munhoz et al. [22] evaluated genetic diversity with RAPD markers in popcorn cultivars and found 62% polymorphism, whereas Rinaldi et al. [23] verified 75.6% polymorphism in popcorn populations based on 26 RAPD primers. These variations can be the result of genetic differences between the plant material and/or access type to distinct genome region by selected markers [24]. The bootstrap method showed that 218 bands were sufficient to access the existing genetic variation in 14 populations (coefficient of variation = 5.5) (Figure 2). Analyses of genetic diversity involving maize lines showed that 150 polymorphic RAPD bands are sufficient for a stable dendrogram [7,25].
The values of RAPD genetic distances and the dendrogram separated the 14 populations and the tester into three distinct groups (Figure 3). Group I consisted of UEL MP, UEL SI, UEL MPS, and UEL BG populations, all of the popcorn breeding program of UEL. Group II contained UEL PAG, UEL PAP, UEL ZP, UEL PP, Capitão, CMS 42, and CMS 43 and UEL YY populations, which are composites of UEL, except for CMS 42 and CMS 43 composites, developed by Embrapa Milho e
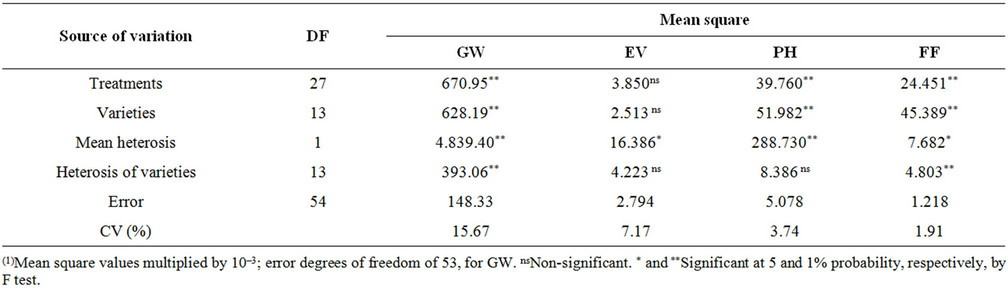
Table 2. Analysis of variance of popcorn topcrosses for grain weight (GW, in t·ha–1), expansion volume (EV, in mL·mL–1), plant height (PH, in meters) and female flowering (FF, in days)(1).
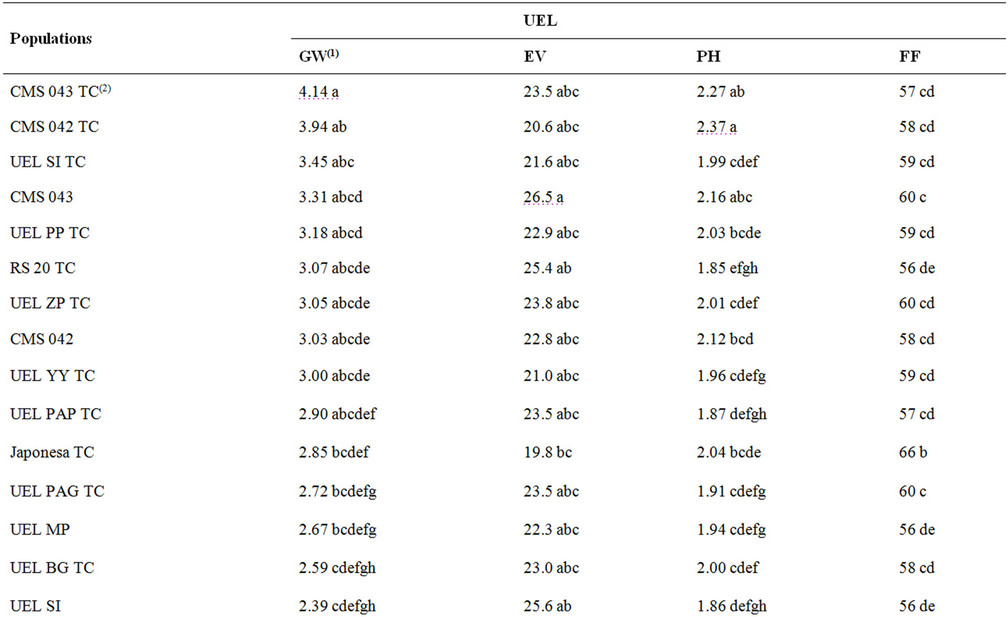
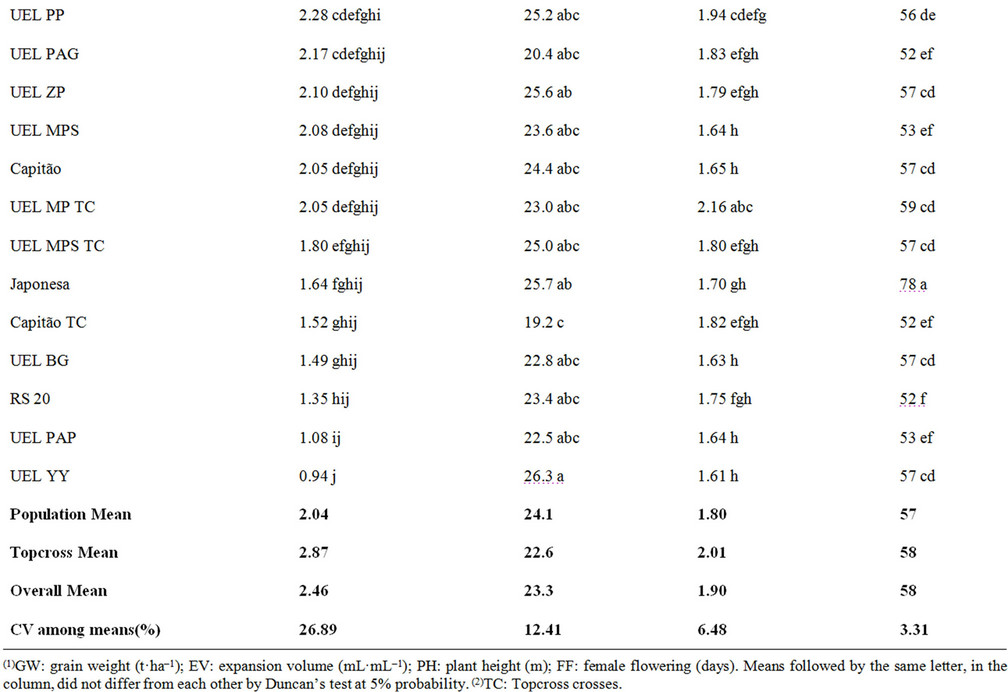
Table 3. Means of popcorn populations and respective topcross crosses of an experiment of UEL.
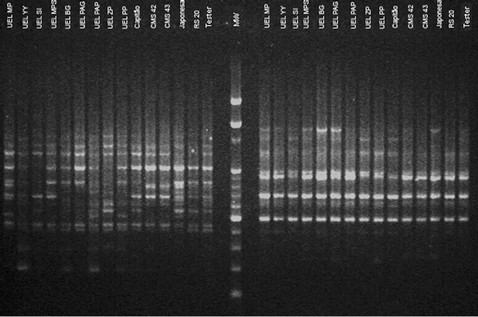
Figure 1. Obtained electrophoretic pattern based on RAPD OPAD-06 and OPAD-13 primers, respectively (MW-molecular weight).
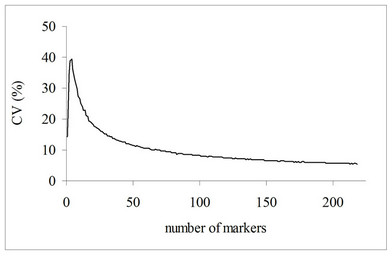
Figure 2. Coefficient of variation for the number of markers, estimated by 1000 bootstrap replicates (CV = 5.5%).
Sorgo, and the commercial population Capitão. Group III comprised the commercial composites Japonesa, RS 20 and the tester. For Seifert et al. [26], who analyzed the combining ability of popcorn populations, the Japonesa population belongs to a different heterotic group from other populations. In our study, data of RAPD markers confirmed this finding. Consequently, RAPD markers can be used to determine the extension of genetic diversity in popcorn populations, and to assign genotypes to distinct heterotic groups [7].
RAPD genetic distances based on Jaccard coefficient showed an 11% variation in UEL SI and UEL MPS populations, and up to 54% in UEL YY and Japonesa populations (Table 4). Therefore, these markers can be explored in popcorn breeding programs to detect genetic variability of the populations.
The mean genetic distance between the tester and the populations was 40%; the shortest distance from the tester to RS20 population was 25%, while the greatest, to UEL YY population, was 52%. The crosses obtained in the topcrosses for GW showed that the highest means in hybrid combinations with the tester were CMS 43 TC, CMS 42 TC, and UEL SI TC hybrids with 4.140, 3.940 and 3.450 t·ha–1, respectively. The hybrids with the best EV were RS 20 TC and UEL MPS TC at 25.4 and 25 mL·mL–1, respectively. No significant correlation was observed between RAPD genetic distances and agronomic performance of topcross hybrids. The correlations were non-significant and positive for EV (r = 0.1051), PH (r = 0.0131) and FF (r = 0.0361), and negative for GW (r = –0.0304). RAPD markers were not efficient for an accurate estimation of the hybrid performance of popcorn populations used here. The results reported here were not completely unexpected in light of the recent

Figure 3. Dendrogram based on RAPD markers, by UPGMA clustering of 14 popcorn populations and the tester based on the genetic similarities of Jaccard.
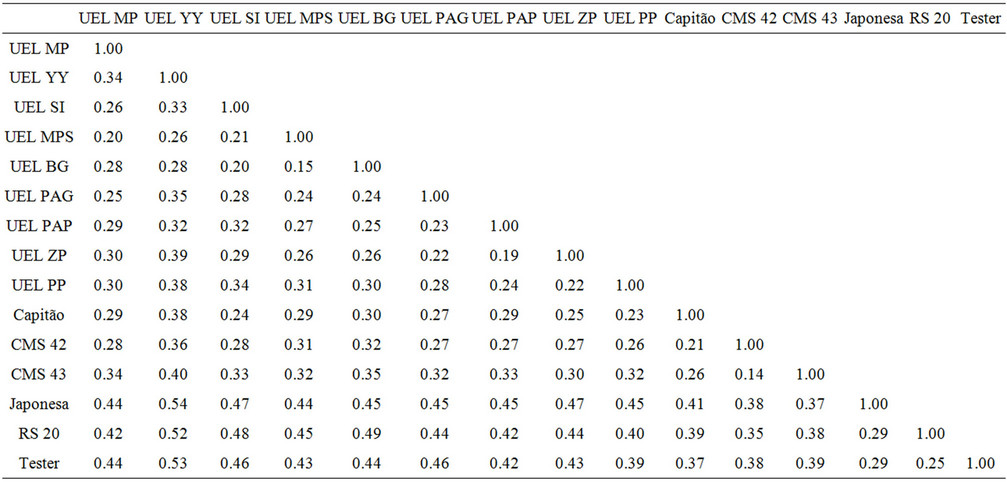
Table 4. Matrix of genetic distance between the 14 populations and the tester estimated by RAPD markers based on Jaccard coefficient.
studies that demonstrate the complex nature of the marker—heterosis relationship.
Our results corroborate those of other authors who found no consistent correlations either between the genetic distance generated by DNA markers and the hybrid performance or heterosis [2,27,28]. Lee et al. [29] observed that the maize lines separated in heterotic groups by RFLP analysis did not agree with the inbreeding degree among them, and that heterosis depends on the type of germplasm used.
The absence of significant associations may be explained by the fact that out of 218 amplified bands, 162 were polymorphic fragments from any part of the genome, including areas without selection pressure, as in the case of sequences that do not code for any important agronomic trait [30]. For the estimation, general heterosis must be differentiated from “functional” heterosis, since not all polymorphic fragments contribute to it. There is a considerable number of fragments located in non-coding genome regions, and the fragments might also be nonassociated with traits of economic importance [31]. An alternative would be to use a greater number of markers for better genome coverage or the use of pre-selected loci linked to the agronomic traits of interest.
In this study, the absence of correlation can also be explained by the fact that the hybrids had been evaluated at a single site, since the heterotic response of a gene pool does not depend on the genetic distance between the parents alone, but also on the adaptation to different environments in which the experiment is carried out. The results of this research suggest that monitoring the genotype-by-environment interaction through the hybrid performance evaluation at several locations and in different years. Besides, a higher number of parents and progenies should be evaluated, since this would increase the chances of finding significant and positive associations between heterosis and genetic divergence.
REFERENCES
- D. F. Ferreira, A. C. Oliveira, M. X. Santos and M. A. P. Ramalho, “Métodos de Avaliação da Divergência Gené- tica em Milho e Suas Relações com os Cruzamentos Dialélicos,” Pesquisa Agropecuária Brasileira, Vol. 30, 1995, pp. 1189-1194.
- G. J. Shieh and F. S. Thseng, “Genetic Diversity of Tainan-White Maize Inbred Lines and Prediction of Single Cross Hybrid Performance Using RAPD Markers,” Euphytica, Vol. 124, No. 3, 2002, pp. 307-313. doi:10.1023/A:1015753820623
- J. K. Williams, A. R. Kubelik, K. G. Livak, J. A. Rafalki and S. V. Tingey, “DNA Polimorphysm Amplified by Arbitrary Primers Are Useful as Genetic Markers,” Nucleic Acids Research, Vol. 18, No. 22, 1990, pp. 6531- 6535.
- A. Santacruz-Varela, M. P. Widrlechner, K. E. Ziegler, R. J. Salvador, M. J. Millard and P. K. Bretting, “Phylogenetic Relationships among North American Popcorns and Their Evolutionary Links to Mexican and South American Popcorns,” Crop Science, Vol. 44, 2004, pp. 1456- 1467. doi:10.2135/cropsci2004.1456
- R. Babu, S. K. Nair, A. Kumar, H. S. Rao, P. Verma, A. Gahalain, I. S. Singh and H. S. Gupta, “Mapping QTLs for Popping Ability in a Popcorn × Flint Corn Cross,” Theoretical and Applied Genetics, Vol. 112, No. 7, 2006, pp. 1392-1399. doi:10.1007/s00122-006-0242-1
- O. S. Smith, J. S. C. Smith, S. L. Bowen, R. A. Tenborg and S. J. Wall, “Similarities among a Group of Elite Maize Inbreds as Measured by Pedigree, F1 Grain Yield, Heterosis, and RFLPs,” Theoretical and Applied Genetics, Vol. 80, 1990, pp. 833-840.
- L. L. B. Lanza, C. L. Souza Jr., L. M. N. Ottoboni, M. L. C. Vieira and A. P. Souza, “Genetic Distance of Inbred Lines and Prediction of Maize Single-Cross Performance Using RAPD Markers,” Theoretical and Applied Genetics, Vol. 94, No. 8, 1997, pp. 1023-1030. doi:10.1007/s001220050510
- D. C. Bruel, V. Carpentieri-Pípolo, A. C. Gerage, N. S. Fonseca Jr., C. E. C. Prete, C. F. Ruas, P. M. Ruas, S. G. H. Souza and D. D. Garbuglio, “Genetic Distance Estimated by RAPD Markers and Its Relationship with Hybrid Performance in Maize,” Pesquisa Agropecuária Brasileira, Vol. 41, No. 10, 2006, pp. 1491-1498. doi:10.1590/S0100-204X2006001000006
- S. Chen, K. K. Hwu and C. Chen, “Prediction of Heterosis with Genetic Diversity among Maize (Zea mays L.) Inbred Lines Revealed by Random Amplified Polymorphic DNA,” Journal of Agricultural Research of China, Vol. 45, 1996, pp. 147-155.
- L. J. Chaves, J. B. and M. Filho, “Predicting Variety Composite Means without Diallel Crossing,” Brazilian Journal of Genetics, Vol. 20, No. 3, 1997, pp. 501-506. doi:10.1590/S0100-84551997000300023
- R. Vencovsky and P. Barriga, “Genética Biométrica no Fitomelhoramento,” Sociedade Brasileira de Genética, Ribeirão Preto, 1992. p. 486.
- S. Gökmen, “Effects of Moisture Content and Popping Method on Popping Characteristics of Popcorn,” Journal of Food Engineering, Vol. 65, No. 3, 2004, pp. 357-362. doi:10.1016/j.jfoodeng.2004.01.034
- SAS Institute, “SAS/STAT User’s Guide,” SAS Institute, Cary, 1996.
- C. O. Gardner, “Simplified Methods for Estimating Constants and Computing Sums of Square for a Diallel Cross Analysis,” Fitotecnia Latinoamericana, Vol. 4, 1967, pp. 1-12.
- M.E. Ferreira and D. Grattapaglia, “Introdução ao Uso de Marcadores Moleculares em Análise Genética,” 3rd Edition, EMBRAPA-CENARGEM, Brasília, 1998, p. 220.
- F. J. Rohlf, “NTSYS-pc Numerical Taxonomy and Multivariate Analysis System Version 2.1,” Owner Manual, 2000.
- A. S. G. Coelho, “DBOOT—Avaliação dos Erros Associados a Estimativas de Distâncias/Similaridades Genéticas Através do Procedimento de Bootstrap com Número Variável de Marcadores, Versão 1.1,” Departamento de Biologia Geral, Instituto de Ciências Biológicas, Universidade Federal de Goiás, Goiânia, 2001.
- C. D. Cruz, “Programa GENES: Aplicativo Computacional em Genética e Estatística versão Windows,” Viçosa-MG. UFV, 2001, p. 442.
- C. A. Scapim, C. G. P. Carvalho and C. D. Cruz, “Uma Proposta de Classificação dos Coeficientes de Variação Para a Cultura do Milho,” Pesquisa Agropecuária Brasileira, Vol. 30, 1995, pp. 683-686.
- E. D. Souza, “Divergência Genética e Avaliação de Fam- ílias S1 e Top Crosses de Milho, Utilizando-Se Caracteres Agronômicos e Marcadores RAPD,” Tese (Doutorado), Universidade Federal de Lavras, Lavras, 2000, p. 88.
- R. J. B. Pinto, C. A. Scapim, A. Ferreira Neto, C. A. P. Pacheco, M. Royer, M. V. Pedroni, R. K. Salvadori and R. M. Silva, “Analysis of Testers with Broad and Narrow Genetic Base for Topcrosses in Popcorn Breeding,” Crop Breeding and Applied Biotechnology, Vol. 4, No. 2, 2004, pp. 152-162.
- R. E. F. Munhoz, A. J. Prioli, A. T. Amaral Júnior, C. A. Scapim and G. A. Simon, “Genetic Distances between Popcorn Populations Based on Molecular Markers and Correlations with Heterosis Estimates Made by Diallel Analysis of Hybrids,” Genetics and Molecular Research, Vol. 8, No. 3, 2009, pp. 951-962. doi:10.4238/vol8-3gmr592
- D. A. Rinaldi, V. Carpentieri-Pípolo, C. F. Ruas, N. S. Fonseca Jr., A. C. Gerage, A. Souza, S. G. H Souza and D. D. Garbuglio, “Correlação Entre Heterose e Divergência Genética Obtida por Avaliações de Cruzamentos Dialélicos e Marcadores Moleculares de RAPD em Populações de Milho Pipoca,” Bragantia, Vol. 66, 2007, pp. 183-192. doi:10.1590/S0006-87052007000200002
- G. L. Sun, M. William, J. Liu, K. J. Kasha and K. P. Pauls, “Microsatellite and RAPD Polymosphisms in Ontario Corn Hybridos Are Related to the Commercial Sources and Maturity Ratings,” Molecular Breeding, Vol. 7, No. 1, 2001, pp. 13-24. doi:10.1023/A:1009680506508
- I. Pejic, P. Ajmore-Marsan, M. Morgante, V. Kozumplick, P. Castiglioni, G. Taramino and M. Motto, “Comparative Analysis of Genetic Similarity among Maize Inbred Lines Detected by RFLPs, RAPDs, SSRs, and AFLPs,” Theoretical and Applied Genetics, Vol. 97, No. 8, 1998, pp. 1248-1255. doi:10.1007/s001220051017
- A. L. Seifert, V. Carpentieri-Pípolo, J. M. Ferreira and A. C. Gerage, “Análise Combinatória de Populações de Milho Pipoca em Topcrosses,” Pesquisa Agropecuária Brasileira, Vol. 41, No. 5, 2006, pp. 771-778. doi:10.1590/S0100-204X2006000500008
- A. Menkir, M. O. Olowolafe, I. Ingelbrecht, I. Fawole, B. Badu-Apraku and B. I. Vroh, “Assesment of Testcross Performance and Genetic Diversity of Yellow Endormperm Maize Lines Derived from Adapted × Exotic Backcrosses,” Theoretical and Applied Genetics, Vol. 113, No. 1, 2006, pp. 90-99. doi:10.1007/s00122-006-0275-5
- Z. Pajih, U. Erih, S. M. Drinih, J. Srdih and M. Filipovih, “Genetic Divergence Estimated by RAPD Markers and Its Relationship with Hybrid Performance in Popcorn,” Cereal Research Communications, Vol. 38, No. 2, 2010, pp. 184-192. doi:10.1556/CRC.38.2010.2.4
- M. Lee, E. B. Godshalk, K. R. Lamkey and W. W. Woodman, “Association of Restriction Fragment Length Polymorphisms among Maize Inbreds with Agronomic Performance of Their Crosses,” Crop Science, Vol. 29, No. 4, 1989, pp. 1067-1071. doi:10.2135/cropsci1989.0011183X002900040050x
- T. A. Joyce, M. T. Abbertton, T. P. T. Michaelson-Yates and J. W. Forster, “Relationships between Genetic Distance Measured by RAPD-PCR and Heterosis in Inbred Lines of White Clover (Trifolium repens L.),” Euphytica, Vol. 107, No. 3, 1999, pp. 159-165. doi:10.1023/A:1003646016780
- Q. Zhang, Z. Zhou, G. P. Yang, C. G. Xu, K. D. Liu and M. A. Saghai-Maroof, “Molecular Marker Heterozygosity and Hybrid Performance in Indica and Japonica Rice,” Theoretical and Applied Genetics, Vol. 93, No. 8, 1996, pp. 1218-1224.
NOTES
*Corresponding author.