American Journal of Plant Sciences
Vol.3 No.3(2012), Article ID:17907,9 pages DOI:10.4236/ajps.2012.33037
Molecular Diversity of Kenyan Lablab Bean (Lablab purpureus (L.) Sweet) Accessions Using Amplified Fragment Length Polymorphism Markers
![]()
1Biotechnology Programme, Kenya Agricultural Research Institute, Njoro, Kenya; 2Biochemistry Department, Egerton University, Njoro, Kenya; 3Tea Research Foundation, Kericho, Kenya; 4Agriculture and Biotechnology Department, Chepkoilel University College, Eldoret, Kenya.
Email: *fwachira@yahoo.com
Received October 21st, 2011; revised November 15th, 2011; accepted December 15th, 2011
Keywords: Lablab purpureus; molecular markers; AFLP; genetic diversity
ABSTRACT
Lablab purpureus (L.) Sweet is a multipurpose legume that combines use as human food and animal feed in addition to serving as a cover crop for soil conservation. In this work, molecular diversity in Lablab purpureus was assessed using amplified fragment length polymorphism markers on fifty Kenyan lablab accessions obtained from farmers’ fields and the Kenya National gene bank. One hundred and eighty polymorphic bands were revealed using fifteen selective primer pairs. The overall mean expected heterozygosity (He) for the five populations was 0.189. Estimates of components of molecular variance revealed that most of the genetic variation resided within populations (99%) and only 1% variance was among the populations, while Principal Coordinate Analysis showed an overlap between accessions from different geographic origins. The UPGMA cluster analysis generated from the distance matrix of the 50 assayed accessions, revealed low diversity among most of the accessions. The low diversity observed may be due to the narrow genetic base for breeding stocks, and extensive exchange of germplasm among smallholder farmers across the country. Results obtained from this study are discussed in light of the need to enhance the genetic management and improvement of this multipurpose crop species.
1. Introduction
Lablab bean, Lablab purpureus L. Sweet (2n = 22) belongs to the family Fabaceae and is one of the most ancient crops among cultivated plants. It is a legume species that grows in the tropic and the sub tropic regions of the world. It is presently grown throughout the tropical regions of Asia and Africa and it remains a minor crop in these regions [1]. The extent of production of Lablab in Kenya has not been well documented, despite relatively long existence of the bean in the country. An example is the Rongai cultivar, which is one of the oldest cultivars, believed to have originated from the Rongai area of Kenya [2].
Lablab purpureus is a drought resistant crop, which is also able to grow in a diverse range of environmental conditions. The species either is cultivated as a pure crop or intercropped with maize, finger millet, groundnut, or sorghum. It is used advantageously as a cover crop since its dense green cover protects the soil against desiccation and decreases erosion by wind or rain [3]. Lablab has the capability of being an outstanding resource for tropical agricultural systems and in improving human food and animal feedstuffs [4]. When used as human food it is eaten as green pods or mature seeds and the leaves as vegetables. It is also used as animal feed, where it is cut as hay or mixed with other feed as silage [5]. In spite of these qualities, Lablab has not been used extensively. Effort is being devoted to conducting more research to extend both technical and practical knowledge about the bean so that its full potential may be achieved. Most of the research on improving lablab as a food crop is currently in Asia and with limited work in Africa [6]. Progress in genetic improvement is dependent on the extent of genetic diversity of existing germplasm and breeding stocks [7]. It is therefore essential to determine this diversity. Though genetic diversity can be assayed using phenotypic traits, these are greatly influenced by the environment and do not correctly reflect genetic relatedness between accessions. Molecular markers have the potential to detect genetic diversity and to aid in the management of plant resources, and are now used to complement phenotypic and protein-based markers [8,9]. Different marker systems have been used to identify genetic diversity in Lablab purpureus. These include simple sequence repeats [10,11], gene specific primers and expressed sequence tags (EST) [12]; Random Amplified Polymorphic DNA (RAPDs) [13-16] and Amplified fragment length polymorphism (AFLP) [12,17-19]. AFLP markers are the choice markers for this study. AFLP technology was developed for the detection and evaluation of genetic variation in accession collections and in the screening of biodiversity [20,21]. The advantages of amplified fragment length polymorphism (AFLP) markers are that small DNA quantities are used and no prior information on the sequence is required. They are reproducible and less labour intensive as the Restriction fragment length polymorphism (RFLPs) markers. They use the polyacrylamide gel which allows for resolution of bands with very small base pair differences, and have high frequency of identifiable polymorphic bands. They have been reported to be a useful and robust tool for detecting genetic diversity within a collection of lablab bean and they provided a basis for determining genetic affinities [19]. This study set to assess the genetic diversity in Kenyan L. purpureus accessions based on AFLP markers.
2. Materials and Methods
2.1. Plant Material
Fifty lablab accessions (Table 1) were used in this study.
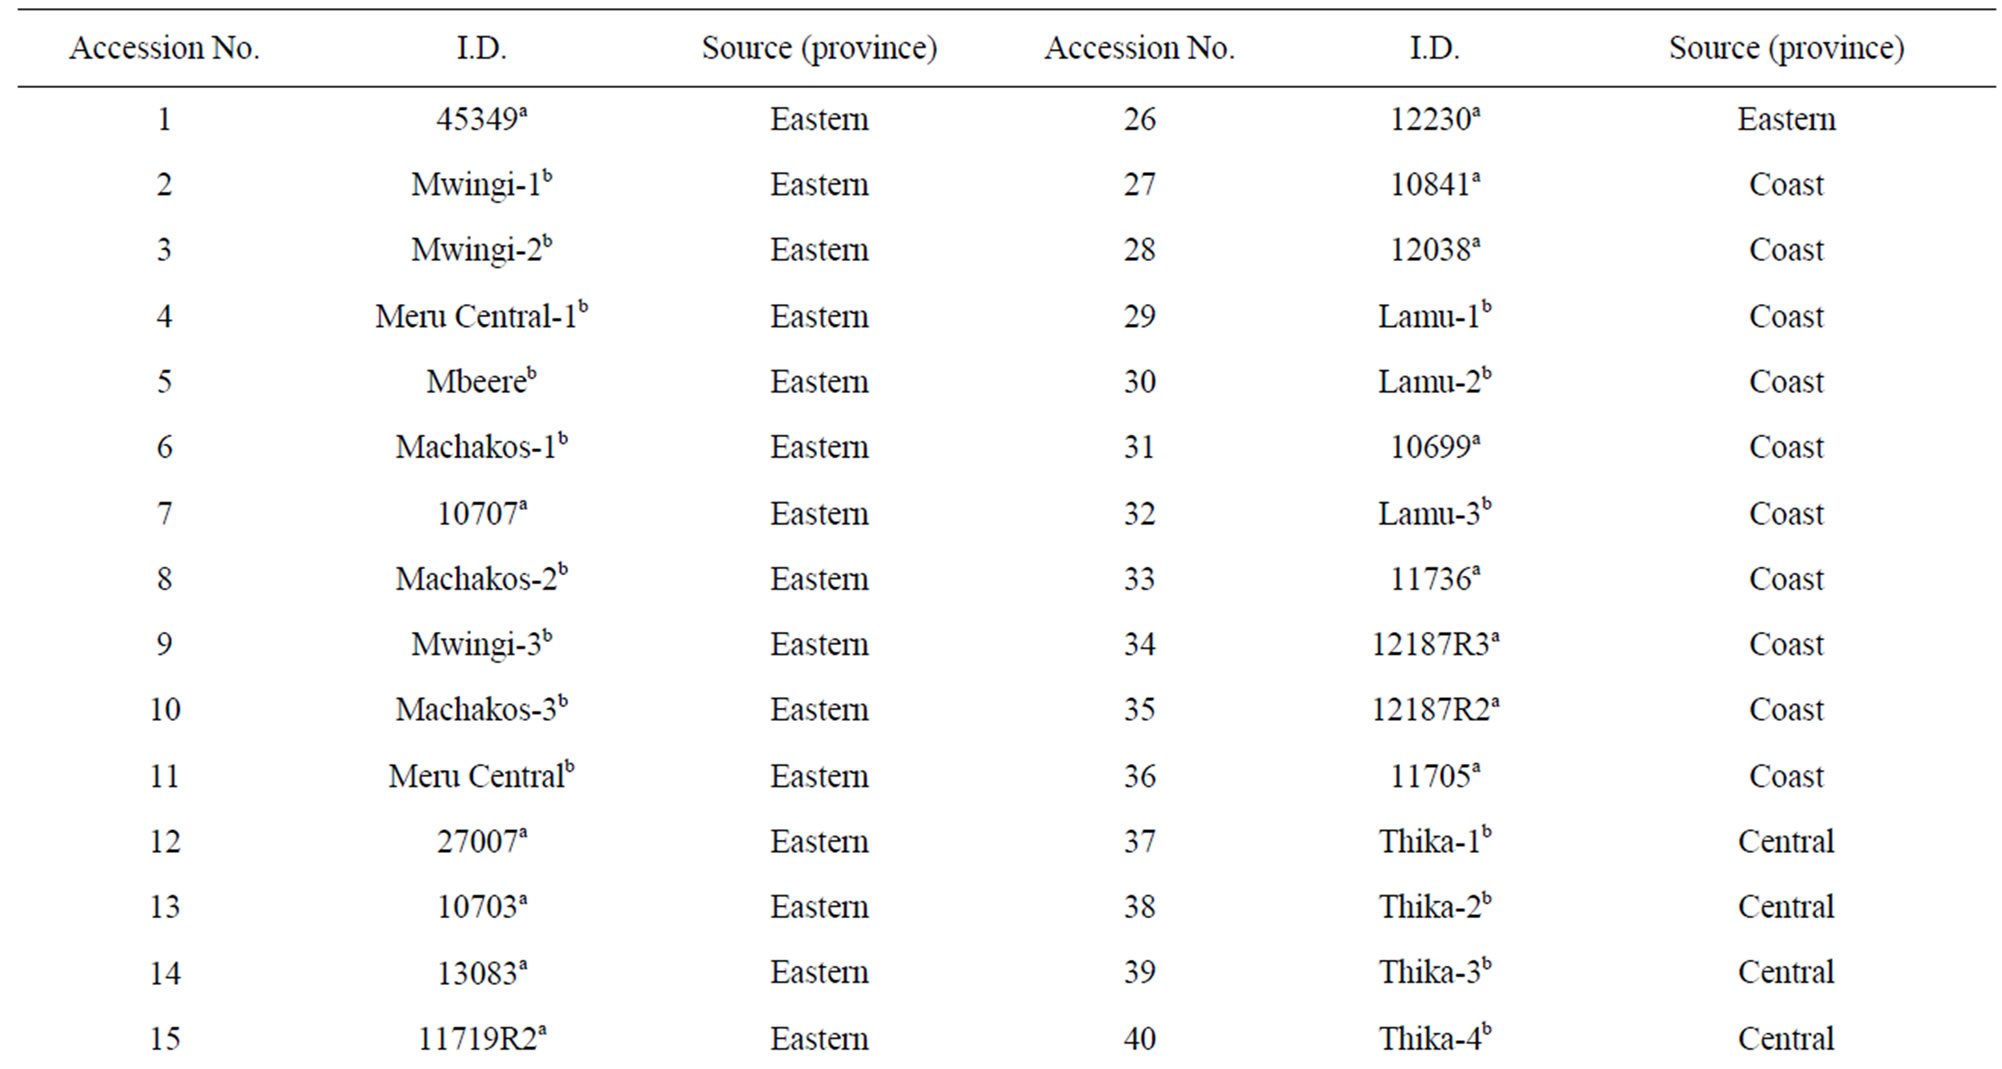
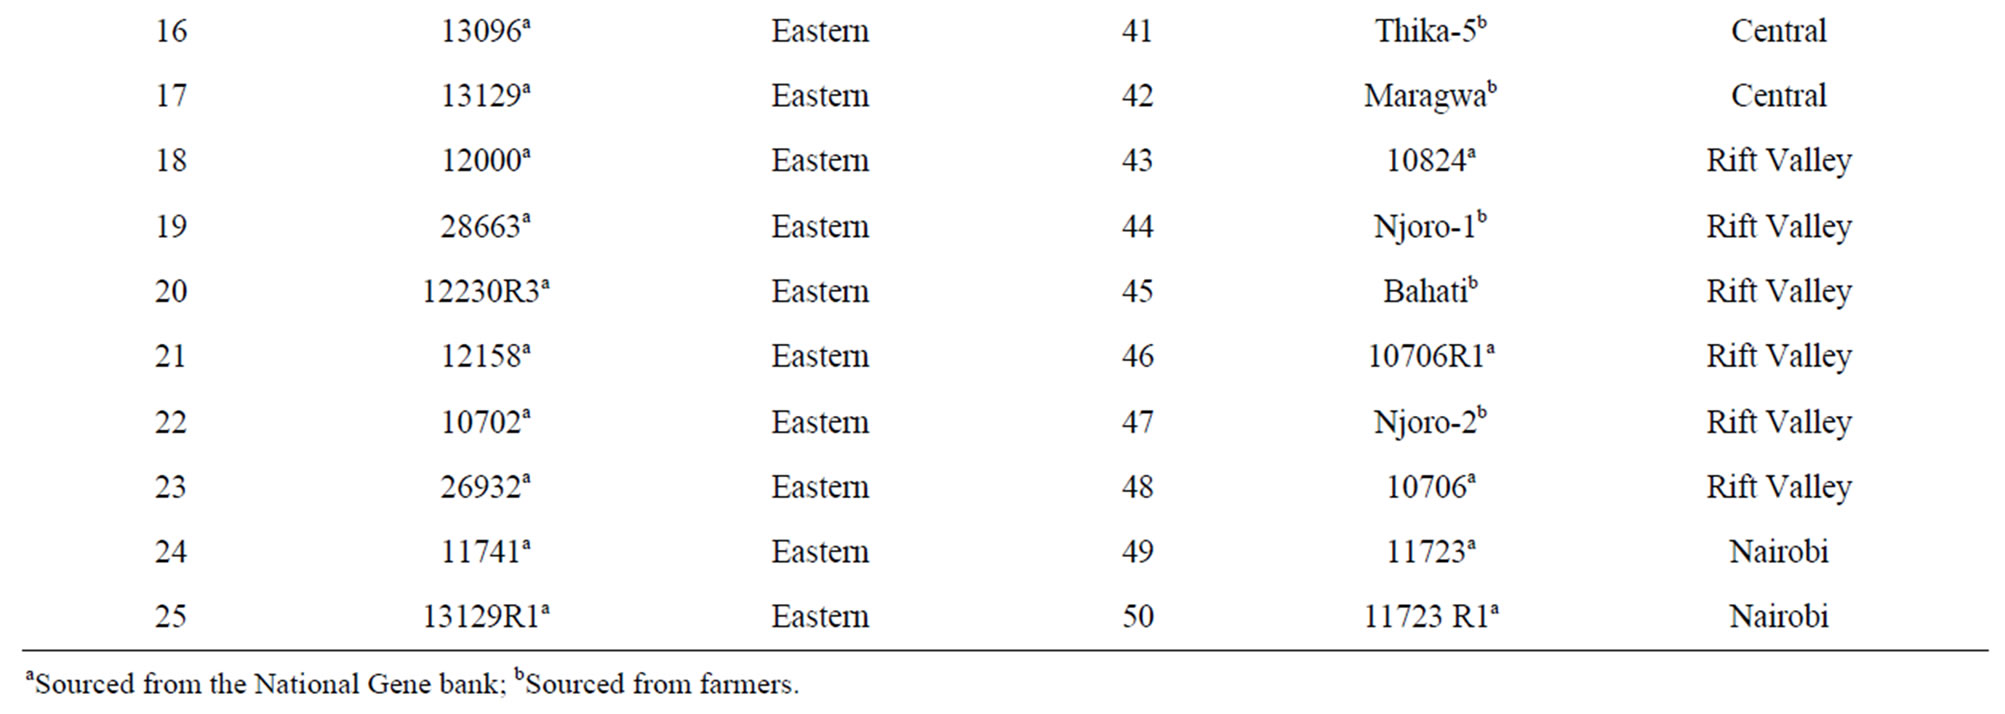
Table 1. Lablab accessions used for molecular characterization and the province of collection.
Twenty eight of the accessions were collected from the National Repository Centre at the Kenyan KARI-Muguga gene bank in Nairobi and the other 22 were collected from farmers’ fields in Eastern, Central, Nairobi, Coast, and Rift Valley provinces of Kenya. The seeds collected from the field were cleaned and dusted with actellic super powder (an insecticide) and stored at room temperature before they were planted in the green house. Young tender leaves were picked after two weeks of planting, and carried on ice to the laboratory.
2.2. DNA Extraction
A modification of the 2x Cetyltrimethylammoniumbromide (CTAB) method described by Gawel and Jarret [22] was used to isolate intact high molecular weight DNA required for AFLP. The leaf material (0.4 gm) was ground using a mortar and pestle in 3 ml of extraction buffer (2% CTAB, 100 mM Tris-Hydrochloric acid (HCl) pH 8.0, 1.4 M Sodium chloride (NaCl), 50mM EDTA, 2% Polyvinylpyrolidone (PVP) 10, 2% β-mercaptoethanol). The slurry was transferred to two, 1.5 ml microfuge tubes and incubated at 65˚C for 15 minutes in a water bath with constant shaking, then centrifuged at 13000 rpm for five minutes (Eppendorf 5415C, Germany). The supernatant was cleaned twice using chloroform: isoamyl alcohol, before the DNA was precipitated by addition of equal volume of ice-cold isopropanol. The DNA pellet was washed using 70% ethanol, and spun for one minute before air drying for one hour. The dried pellet was re-suspended in 50 µl of sterile distilled water. RNA was removed by adding two microliters of pancreatic ribonuclease A (RNase A) (10 mg/ml) and incubating the samples for one hour at 37˚C. DNA was checked for integrity and intactness on 0.8% agarose (Sigma, UK) gel in 1x TBE buffer (89.2 mM Tris, 89.0 mM Boric acid, 1.25 mM EDTA pH 8.0), by comparing the isolated DNA samples with uncut, unmethylated lambda (l) DNA standards of known concentrations. The samples were stored at −20˚C.
2.3. Amplified Fragment Length Polymorphism (AFLP) Analysis
The AFLP analysis was carried out according to the methods described by Zabeau [20] with modifications as described by Waugh [23] and IAEA technical manual [24]. EcoRI and MseIwere used as the rareand frequentcutter restriction enzymes, respectively. Pre-selective amplification was carried out using primers with one selective nucleotide, while selective amplification was with 15 primer pairs with 3 selective nucleotides [19] (Table 2). The pre-selectively amplified DNA was diluted by adding 100µl of T0.1E (10 mM TrisHCl pH 8.0, 0.1 mM EDTA) buffer) and used in the selective amplification step. Each selective PCR reaction (10 µl) consisted of the template DNA (2.5 ml), 1x PCR buffer, 0.75 ml EcoRI and 0.75 ml MseI selective primers (50 ng/ml), 2 ml of 2 mM each dNTP and 0.05 ml of 5 U/ml Hotstart-Taq DNA polymerase (Promega). The selective amplifycation was carried out using a “touchdown” profile of 11 cycles of 94˚C for 30 secs; 65˚C for 30 secs (reducing by 0.7˚C each subsequent cycle to 56˚C); 72˚C for 1 min and a final step of 24 cycles of 94˚C for 30 secs; 56˚C for 30 secs; 72˚C for 1 min, then held at 4˚C, in the thermocycler (MyGenie 96, Bioneer Corporation).
The PCR products were mixed with 10 ml of formamide dye mix and denatured for 3 minutes at 95˚C, be-

Table 2. Preselective and selective primer combinations (selective bases on the 3’end) used in study.
fore they were separated on a 6% polyacrylamide gel. The gels were stained with silver nitrate for clear visualization on white light [25]. A 100bp molecular weight size standard (2-log DNA ladder, NEB) was run alongside the samples for sizing of the fragments.
2.4. Data Scoring and Analysis
Clear bands were scored twice manually in a binary form, as 1 (presence) and 0 (absence) of band. The band sizes were estimated by comparison with 100 bp molecular weight standard (2-log DNA ladder, NEB). Markers ambiguous in a few genotypes were treated as missing data and recorded as “.”.
Data analysis was carried out using Genetic Analysis in Excel (GenAlEx) version 6.2 software [26] which computed the expected heterozygosity, Shannon’s Index, Nei’s [27] genetic distance between pairs of populations, analysis of molecular variance (AMOVA), cluster analysis and principal coordinate analysis (PCoA). Populations were delineated based on source. A genetic identity distance matrix was derived and a dendogram based on the unbiased Nei’s genetic distances matrix [27] constructed using unweighted pair group method of arithmetic averages (UPGMA) [28] to reveal the level of genetic relatedness among the accessions using the POPGENE version 1.32 [29] software assuming Hardy-Weinberg equilibrium and no population structure. The UPGMA option constructed a tree by successive (agglomerative) clustering using an average-linkage method of clustering.
3. Results
3.1. Level of Polymorphism
The analysis of genetic variation in breeding materials is of fundamental interest to the plant breeders. It contributes to selection, monitoring of germplasm and prediction of potential genetic gain [30]. The AFLP technique used in this study provided a basis for detecting molecular diversity within and among the Kenyan populations of L. purpureus for the first time, thus determining genetic affinities. The fifteen primer pairs revealed a total of two hundred and twenty-seven different AFLP loci out of which one hundred and eighty were polymorphic. The primers differed in their ability to reveal positive amplicons, with the number of markers ranging from 11 - 21 per primer set. The percentage polymorphism ranged from 36.36% {E(ACC)/M(CAT)} to 100% {E(ACA)/ M(CAC) and E(ACA)/M(CGC)}, with 9 primer sets with percentage polymorphism of 80% and higher. Primer pair EcoRI + ACA/MseI + CACwas found to be the most informative primer set in a previous study on lablab [19] and had 100% polymorphic loci in our study. The number of bands obtained per accession was lower than that in a previous study of lablab [19], and other species, like beans [31], which may be attributed to the silver staining method and manual scoring method used in this study. The overall mean expected heterozygosity estimate (He) derived from the 180 polymorphic AFLP markers for the five populations was 0.189. The He and Shannon index were highest for the Eastern Province population (0.297 and 0.448) and lowest for the Nairobi population (0.055 and 0.081) (Table 3). Partitioning of the genetic diversity into population variance components revealed that overall, most genetic variation resided within populations (99%) and only 1% variance was among the populations (Table 4). A low value of ΦPT of 0.007 was observed showing only a very small extent of differentiation among the populations.
3.2. Genetic Relatedness of the Cultivars
The five populations exhibited a high level of unbiased genetic identity of greater than 0.89, with the Rift Valley and Eastern populations displaying the highest genetic identity of 0.967. Rift Valley and Nairobi populations had the least genetic identity of 0.893. The distance matrix was used to derive a dendogram of the populations using Nei’s [27] unbiased measures of genetic distance, and unweighted pair group method using arithmetic averages (UPGMA) (Figure 1). Nairobi population revealed the highest genetic distance from the other popu-
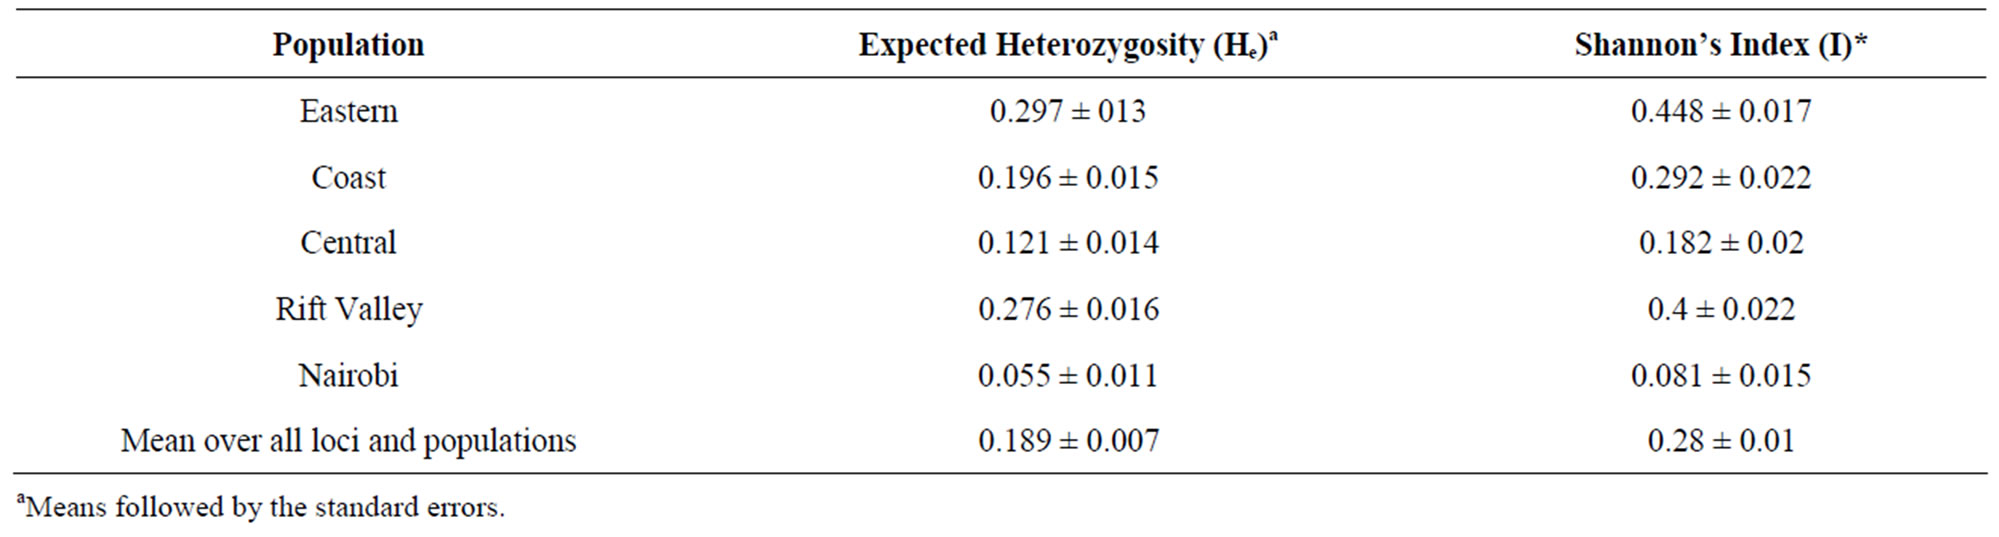
Table 3. Mean expected heterozygosity (He) and Shannon Index over Loci for five populations of L. purpureus in Kenya.
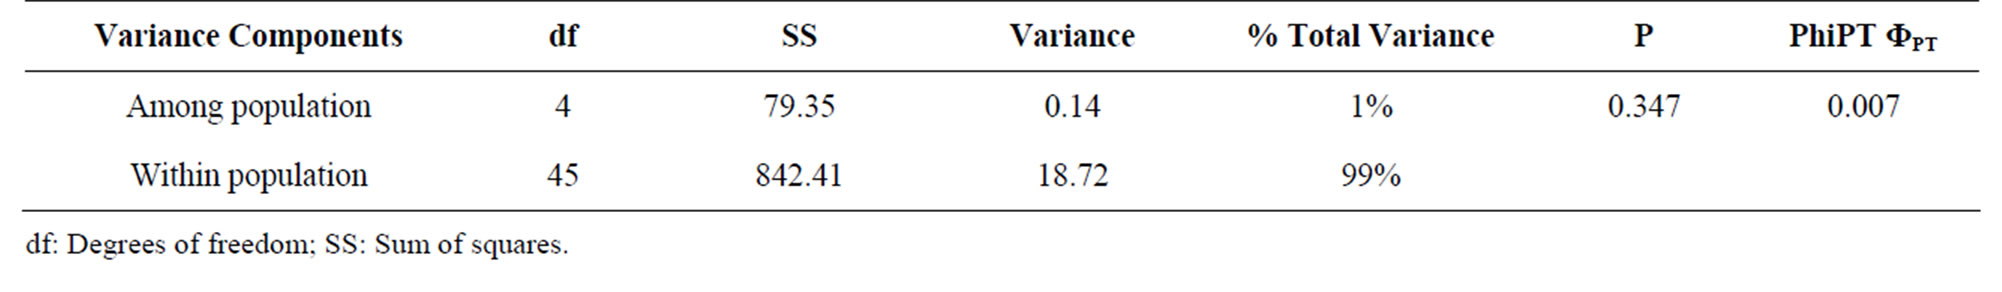
Table 4. Nested AMOVA for 50 accessions of L. purpureus and partitioning of the total diversity into population components.
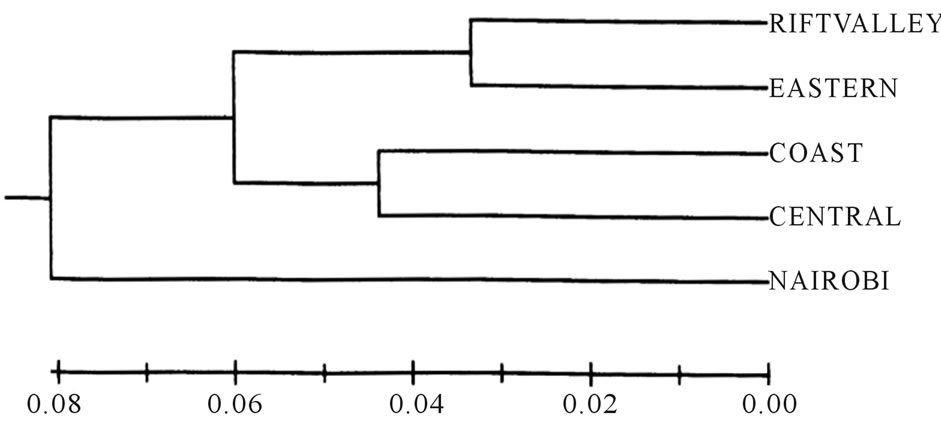
Figure 1. A dendogram of five populations of L. purpureus Kenyan accessions based on AFLP analysis of fifteen primers based on Nei’s (1978) unbiased measures of genetic distance.
lations and this population could be sampled for conservation because it may have germplasm with unique alleles. An unbiased Nei’s [27] genetic distance matrix was generated to establish the level of relatedness of the 50 L. purpureus accessions. The genetic distance values ranged from 0.07 to 0.89. The minimum genetic distance value of 0.07 was observed between the accessions 12038 and 10841, 10841 and Mwingi-1, Lamu-2 and Mwingi-2, and Meru Central-1 and Lamu-2. Accessions with genetic distance of 0.08 included 45349 and Mwingi-2, 10841 and Thika-1; between accession 11736 and Machakos-3 and Meru Central-2; 13129R1 and 11741, and Thika-1 and Lamu-2. The accessions that had the largest genetic distance (0.89) were Njoro-2 and Mwingi-3. Mwingi-3 also had large genetic distances of 0.88 with Meru Central-2, Lamu-3, and Thika-2; 0.86 with Lamu-1 and 10699; and 0.84 with Meru Central-1, 11719R2, 13096, 13129R1, Thika-5, 10824, and 11723R1.
Accessions collected from farmers’ fields exhibited a higher genetic distance of 0.89, between Njoro-2 and Mwingi-3, and least distance of 0.07, between Mwingi-2 and Lamu-2 and Meru Central-1 and Lamu-2. Those collected from the National gene bank had a range of genetic distance from 0.08 between accessions 45349 and 10841, to 0.84 between accessions 10824 and 10706R1. The black coloured accessions, which are the most widely cultivated accessions in Kenya, exhibited genetic distances ranging from 0.081 between Thika-1 and 45349, to 0.287 between Meru Central-1 and Thika-3.
A Principal Coordinate Analysis plot of the first two coordinates displayed the multidimensional relationship of the 50 accessions assayed in this study. The first principal coordinate accounted for 61.81% of the variance of the AFLP scored data, while the second accounted for 13.38% variance, respectively, giving a cumulative variance of 75.19%. The plot showed a high degree of overlap (clustering) of the accessions from different geographical origins, apart from four accessions (Figure 2).
To examine the relationship between the accessions further, the 50 accessions were subjected to cluster analysis using the distance matrix data (data not shown here) and the unweighted pair group method using arithmetic averages (UPGMA) linkage analysis. The dendogram resulting from the cluster analysis revealed three major groups (Figure 3). The groups constituted of the following accessions: Group one: Mwingi-3 and 10706R1 and group two: 12187R3 and 12000. Group three was the largest consisting of the rest of the accessions, subdivided into two subgroups. The subgroups consisted of Thika-3 in group 3a and the rest of the accessions in group 3b, which was further subdivided to two groups with accessions 13129 and 12230R3 in group 3b(i) and the other accessions in group 3b(ii). The grouping of the L. purpureus accessions did not exhibit any relationship to the geographical regions of origin, showing random dispersion of the accessions from the different regions. Accessions 10706R1 from the Rift Valley population and Mwingi-3 from the Eastern population were the most distant in the dendogram.
4. Discussion
Overall, this study revealed that L. purpureus accessions
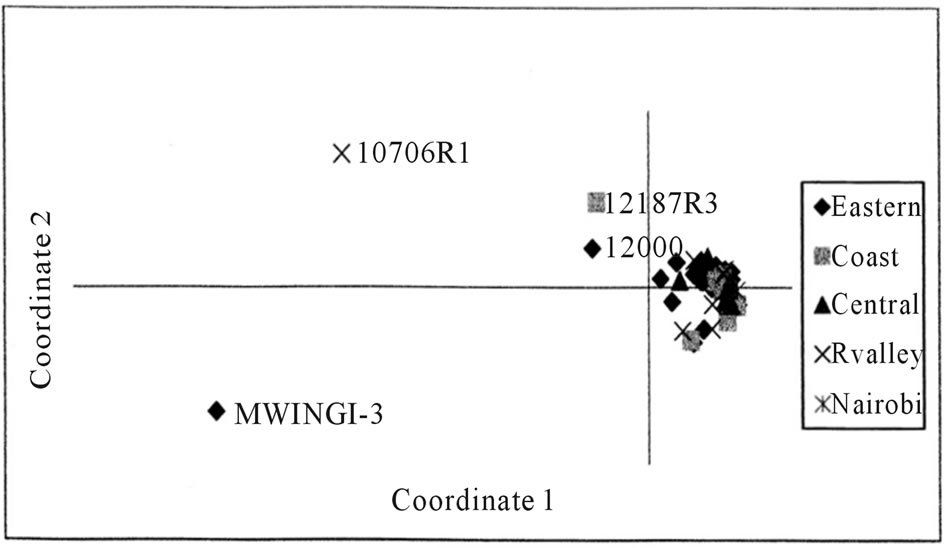
Figure 2. Principal coordinate analysis (PCA) plot of molecular genetic diversity of 50 L. purpureus accessions with 180 AFLP markers.

Figure 3. Relationship between 50 Kenyan L. purpureus accessions based on Nei’s (1978) genetic distance using UPGMA method.
studied are based on material of narrow genetic base (expected mean heterozygosity He = 0.189). The expected heterozygosity accounts for the frequency of the different types of alleles or loci in the population [32]. In most cultivated plant species, higher mean heterozygosity (He) have been reported. Some of the mean heterozygosity reported for plants are 0.30 in soyabean [33]; 0.32 in common beans using AFLP markers [34]; 0.361 in green beans using SSR markers [35]; 0.444 for mung bean using SSR markers [36], 0.361 in tea using AFLP markers [37], 0.313 in rice using SSR markers [38] and 0.37 in wheat with SSR markers [39].
Little genetic differentiation between the populations assayed in the Kenyan L. purpureus accessions was also revealed by the AMOVA results (with 99% of the total variation partitioned into within populations, and only 1% between populations). The low level of the species diversity may be attributed to self-pollinating nature of L. purpureus, though some out-crossing has also been reported [40]. The low diversity may also be caused by increased gene flow as a result of exchange of germplasm by farmers across the regions, which are geographically close to one other. Among the populations, the highest diversity was resident in Eastern population (He = 0.297) with the least in the Nairobi population (He = 0.055). Collection strategies within the country should thus focus on sampling from Eastern population, ensuring that as a wide ecological amplitude of the cultivation area as is possible, is covered to capture as many loci as possible, in contrast to collecting from many different populations. The Nairobi population was the most distinct on the dendogram (Figure 1) and could also be sampled because it may have germplasm with unique alleles. This uniqueness may be explained by the fact that Nairobi is a commercial region and receives seed from all the parts of the country including from elsewhere outside the country. The inflow into Nairobi from other regions is much higher than to the other population regions and this population may access most alleles from within the country and as well as from outside since it is a point of entry into the country. There is thus need to also sample from Nairobi in order to capture the unique alleles that are not present in the other populations.
The Kenyan L. purpureus revealed that the existing variations in cultivated forms had no geographic basis, since clustering of the accessions was not dependent on the geographical area of collection. Moderate genetic diversity was also displayed for the landraces from Africa and Asia [19]. This may be attributed to the movement of accessions between the regions and continuous selection from a narrow genetic base. The low diversity within the Kenyan L. purpureus accessions was also displayed in the principal coordinate analysis (PCoA) plot (Figure 2) with a tight cluster of points. A PCoA plot for L. purpureus accessions from UAS Bangalore and from Southern states of India also revealed a tight cluster of points [12]. The diversity however was increased by including accessions from Africa indicating greater genetic diversity across the continents. Higher levels of genetic variation were nonetheless reported for cultivated and wild forms of lablab using random amplified polymerphic DNA (RAPDs) [13]. However, the differences observed in the study referred to were mainly between the cultivated and wild forms, with the cultivated genotypes showing only moderate dissimilarities. Great diversity for the wild forms of lablab has also been reported [19].
Due to the great diversity of the wild forms of L. purpureus noted in other studies, the wild and cultivated forms can be crossed to produce genetically diverse fertile hybrids in the Kenyan breeding program. Accessions with greater diversity from other continents and those in this study can be included in the breeding programs to expand the genetic base of this multipurpose crop.
In conclusion, molecular diversity analysis can identify lines that are genetically dissimilar. AFLP markers used in this study were a useful tool for detecting genetic diversity within the Kenyan lablab bean. However, the markers are dominant in nature, thus limiting the information available. Low genetic diversity was established in Kenyan L. purpureus and conservation efforts should be enhanced. Diversity analysis identified accessions Mwingi-3, 10706R1, 12000 and 12187R3, as more genetically distinct and these can be used to generate crosses and to identify novel alleles for genes of agronomic and biochemical importance. Following the moderate to low genetic diversity, there is need to diversify the genetic base of the Kenyan accessions by including the wild cultivars and exotic germplasm from other countries, like South Asia in the breeding programs to increase the genetic diversity and offer new potential for enhancing desired traits.
5. Acknowledgements
We thank Kirkhouse Trust UK and Kenya Agricultural Research Institute for funding this work.
REFERENCES
- L. M. Engle and N. C. Altoveris (Eds.), “Collection, Conservation and Utilization of Indigenous Vegetables,” Asian Vegetable Research and Development Centre (AVRDC), Shanhua, 2000, p. 142.
- D. G. Cameron, “Tropical and Subtropical Pasture Legumes,” Queensland Agricultural Journal, Vol. 114, No. 2, 1988, pp. 110-113.
- J. G. Mureithi, C. K. K. Gachene and J. L. W. Wamuongo, “Legume Cover Crops Research in Kenya: Experiences of the Legume Research Network Project,” KARI Technical Note Series, No. 12, 2003.
- B. C. Pengelly and S. N. Lisson, “Strategies for Using Improved Forages to Enhance Production in Bali Cattle,” In: K. Entwistle and D. R. Lindsay, Eds., Proceedings of a Workshop Australian Centre for International Agricultural Research (ACIAR), Bali, 4-7 February 2002, pp. 29-33.
- P. M. Maundu, G. W. Ngugi and C. H. S. Kabuye (Eds.), “Lablab purpureus,” In: Traditional Food Plants of Kenya, English Press Ltd., Nairobi, 1999, pp. 154-155.
- B. L. Maass, M. R. Knox, S. C. Venkatesha, T. A. Tefera, S. Ramme and B. C. Pengelly, “Lablab purpureus—A Crop Lost for Africa?” Tropical Plant Biology, Vol. 3, No. 3, 2010, pp. 123-135.
- S. McCouch, “Diversifying Selection in Plant Breeding,” PLoS Biology, Vol. 2, No. 10, 2004, pp. e347-e306. doi:10.1371/journal.pbio.0020347
- P. S. Virk, B. V. Ford-Lloyd, M. T. Jackson and H. J. Newbury, “Use of RAPD for the Study of Diversity within Plant Germplasm Collections,” Heredity, Vol. 74, No. 2, 1995, pp. 170-179. doi:10.1038/hdy.1995.25
- Z. P. Song, X. Xu, B. Wang, and J. K. Chen, “Genetic Diversity in the Northernmost Oryzarufipogon Populations Estimated by SSR Markers,” Theoretical and Applied Genetics, Vol. 107, 2003, pp. 1492-1499. doi:10.1007/s00122-003-1380-3
- M. L. Wang, A. G. Gillaspie, M. L. Newman, R. E. Dean, R. N. Pittman, J. B Morris and G. A. Pederson, “Transfer of Simple Sequence Repeat (SSR) Markers across the Legume Family for Germplasm Characterization and Evaluation,” Plant Genetic Resources, Vol. 2, No. 2, 2004, pp. 107-119. doi:10.1079/PGR200441
- M. L. Wang, J. B. Morris, N. A. Barkley, R. E. Dean, T. M. Jenkins and G. A. Pederson, “Evaluation of Genetic Diversity of the USDA Lablab purpureusgermplasm Collection Using Simple Sequence Repeat Markers,” Journal of Horticultural Science Biotechnology, Vol. 82, No. 4, 2007, pp. 571-578.
- S. C. Venkatesha, M. B. Gowda, P. Mahadevu, A. M. Rao, D.-J. Kim, T. H. N. Ellis and M. R. Knox, “Genetic Diversity within Lablab purpureus and the Application of Gene-Specific Markers from a Range of Legume Species,” Plant Genetic Resources: Characterization and Utilization, Vol. 5, No. 3, 2007, pp. 154-171. doi:10.1017/S1479262107835659
- C. J. Liu, “Genetic Diversity and Relationships among Lablab purpureus Genotypes Evaluated Using RAPD Markers,” Euphytica, Vol. 90, No. 1, 1996, pp. 115-119.
- N. Sultana, Y. Ozaki and H. Okubo, “The Use of RAPD Markers in Lablab Bean (Lablab purpureus (L.) Sweet) Phylogeny,” Bulletin of Institute of Tropical Agricultural Kyushu University, Vol. 23, 2000, pp. 45-51.
- Z. Tian, S. Wang, W. Wang and L. Liu, “Study on the Diversity of Germplasm Resources of Dolichos lablab (L.),” Natural Science Journal of Hainan University, Vol. 23, No. 1, 2005, pp. 53-60.
- B. N. Gnanesh, S. M. Reddi and R. K. Raja, “Genetic Diversity Analysis of Field Bean (Lablab purpureus (L.) Sweet) through RAPD Markers,” BARC Golden Jubilee &DAE-BRNS Life Sciences Symposium on Trends in Research and Technologies in Agriculture and Food Sciences at Bhabha Atomic Research Centre (BARC), Mumbai, 18-20 December 2006, p. 78.
- T. Tefera, M. Oluoch and B. L. Maass, “Identifying Vegetable Lablab Types by Participatory assessment: Panelists’ Perceptions of Morphological Traits and Organoleptic Taste Assessment,” The 13th Australian Society of Agronomy Conference, Perth, 11-14 September, 2006.
- P. Patil, S. C. Venkatesha, T. H. Ashok, T. K. S. Gowda, Byre and M. Gowda, “Genetic Diversity in Field Bean as Revealed with AFLP Markers,” Journal of Food Legumes, Vol. 22, No. 1, 2009, pp. 18-22.
- B. L. Maass, R. H. Jamnadass, J. Hanson and B. C. Pengelly, “Determining Sources of Diversity in Cultivated and wild Lablab purpureusrelated to Provenance of Accession by Using Amplified Fragment Length Polymorphism,” Genetic Resources and Crop Evolution, Vol. 52, No. 6, 2005, pp. 683-695. doi:10.1007/s10722-003-6019-3
- M. Zabeau, European Patent Application, No. 92402629.7, 1993.
- P. Vos, R. Hogers, M. Bleeker, M. Rijans, T. Van de Lee, M. Hornes, A. Frijters, J. Pt, J. Peleman, M. Kuiper and M. Zabeau, “AFLP: A New Technique for Fingerprinting,” Nuclei Acids Research, Vol. 23, No. 21, 1995, pp. 4407- 4414. doi:10.1093/nar/23.21.4407
- N. J. Gawel and R. L. Jarret, “A Modified CTAB DNA Extraction Procedure for Musa and Ipomea,” Plant Molecular Biology Reports, Vol. 9, No. 3, 1991, pp. 262-266. doi:10.1007/BF02672076
- R. Waugh, “Lab Protocols,” Plant Genome Analysis Group, Cell and Molecular Genetics Department, Scottish Crop Research Institute, Dundee, 1994, pp. 52-57.
- IAEA, “Mutant Accession Characterization Using Molecular Markers—A Manual,” International Atomic Energy Agency Training Course Series 19, Vienna, 2002, pp. 7.1- 7.7.
- CIMMYT, “Laboratory Protocols, CIMMYT Applied Molecular Genetics Laboratory,” 3rd Edition, Mexico City, 2005, pp. 41-47.
- R. Peakall and P. E. Smouse, “GENALEX 6: Genetic Analysis in Excel. Population Genetic Software for Teaching and Research,” Molecular Ecology Notes, Vol. 6, No. 1, 2006, pp. 288-295. doi:10.1111/j.1471-8286.2005.01155.x
- M. Nei, “Estimation of Average Heterozygosity and Genetic Distance from a Small Number of Individuals,” Genetics, Vol. 89, No. 3, 1978, pp. 583-590.
- P. H. A. Sneath and R. R. Sokal, “Numerical Taxonomy,” Freeman, San Francisco, 1973.
- F. C. Yeh, R. T. Yang, J. Boyle, Z. Ye and J. M. Xiyan, “PopGene32, Microsoft Windows-Based Freeware for Population Genetic Analysis,” Version 1.32, Molecular Biology and Biotechnology Centre, University of Alberta, Edmonton, 2000.
- B. K. Chakravarthi and R. Naravaneni, “SSR Marker Based DNA Fingerprinting and Diversity Study in Rice (Oryza sativa L.),” African Journal of Biotechnology, Vol. 5, No. 9, 2006, pp. 684-688.
- V. Kumar, S. Sharma, S. Kero, S. Sharma, A. K. Sharma, M. Kumar and K. V. Bhat, “Assessment of Genetic Diversity in Common Bean (Phaseolus vulgaris L.) Germplasm using Amplified Fragment Length Polymorphism (AFLP),” Scientia Horticulturae, Vol. 116, No. 2, 2008, pp. 138-143. doi:10.1016/j.scienta.2007.12.001
- S. A. Mohammadi and B. M. Prasanna, “Analysis of Genetic Diversity in Crop Plants—Salient Statistical Tools and Considerations,” Crop Science, Vol. 43, No. 4, 2003, pp. 1235-1248. doi:10.2135/cropsci2003.1235
- G. N. Ude, W. J. Kenworthy, J. M. Costa, P. B. Cregan and J. Alvernaz, “Genetic Diversity of Soybean Cultivars from China, Japan, North America, and North American Ancestral Lines Determined by Amplified Fragment Length Polymorphism,” Crop Science, Vol. 43, No. 5, 2003, pp. 1858-1867. doi:10.2135/cropsci2003.1858
- M. Maras, J. B. Šuštar-vozli, Javornik and V. Megli, “The Efficiency of AFLP and SSR Markers in Genetic Diversity Estimation and Gene Pool Classification of Common Bean (Phaseolus vulgaris L.),” Acta Agriculturae Slovenica, Vol. 91, No. 1, 2008, pp. 87-96. doi:10.2478/v10014-008-0009-2
- G. Sarıkamış, F. Yaşar, M. Bakır, K. Kazan and A. Ergül. “Genetic Characterization of Green Bean (Phaseolus vulgaris) Genotypes from Eastern Turkey,” Genetics and Molecular Research, Vol. 8, No. 3, 2009, pp. 880-887. doi:10.4238/vol8-3gmr605
- J. G. Gwag, J. W. Chung, H. K. Chung, J. H. Lee, K. H. Ma, A. Dixit, Y. J. Park, E. G. Cho, T. S Kim and S. H. Lee, “Characterization of New Microsatellite Markers in Mung Bean, Vigna radiata (L.),” Molecular Ecology Notes, Vol. 6, No. 4, 2006, pp. 1132-1134. doi:10.1111/j.1471-8286.2006.01461.x
- F. N. Wachira, J. Tanaka and Y. Takeda, “Genetic Variation and Differentiation in Tea (Camellia sinensis) Accession Revealed by RAPD and AFLP Variation,” Journal of Horticultural Science and Biotechnology, Vol. 76, 2001, pp. 557-563.
- Q. Cao, B. R. Lu, H. Xia, J. Rong, F. Sala, A. Spada and F. Grassi, “Genetic Diversity and Origin of Weedy Rice (Oryza sativa f. spontanea) Populations Found in NorthEastern China Revealed by Simple Sequence Repeat (SSR) Markers,” Annals of Botany, Vol. 98, No. 6, 2006, pp. 1241-1252. doi:10.1093/aob/mcl210
- P. Zhang, S. Dreisigacker, A. Buerkert, S. Alkhanjari, A. E. Melchinger and M. L. Warburton, “Genetic Diversity and Relationships of Wheat Landraces from Oman Investigated with SSR Markers,” Genetic Resources and Crop Evolution, Vol. 53, No. 7, 2006, pp. 1351-1360. doi:10.1007/s10722-005-4675-1
- J. B. Hacker and J. Hanson, “Crop Growth and Development: Reproduction,” In: D. S. Loch and J. E. Ferguson, Eds., Forage Seed Production 2: Tropical and Subtropical Species, Wallingford, CABIN Publishing, 1999, pp. 93-111.
NOTES
*Corresponding author.