Advances in Computed Tomography Vol.04 No.01(2015), Article ID:54417,9
pages
10.4236/act.2015.41002
The Inter- and Intraindividual Anatomical Relationship of the Femoral Anteversion and Distal Femoral Rotation. A Cadaveric Study on the Femoral Anteversion Angle, Posterior and Inferior Condylar Angle Using Computed Tomography
H. M. J. van der Linden-van der Zwaag1*, L. C. D. Konijn1, T. J. van der Steenhoven1, H. J. L. van der Heide1, M. C. de Ruiter2, R. G. H. H. Nelissen1
1Department of Orthopaedic Surgery, Leiden University Medical Center, Leiden, The Netherlands
2Department of Anatomy, Leiden University Medical Center, Leiden, The Netherlands
Email: *H.M.J.van_der_Linden@lumc.nl
Copyright © 2015 by authors and Scientific Research Publishing Inc.
This work is licensed under the Creative Commons Attribution International License (CC BY).
http://creativecommons.org/licenses/by/4.0/


Received 15 February 2015; accepted 28 February 2015; published 5 March 2015
ABSTRACT
Malrotation following Total Knee Arthroplasty (TKA) is directly related to poor outcome. Knowledge of the rotational axes (torsion) and angles is therefore important. The aim of the study was to determine whether an association existed between the Femoral Anteversion Angle (FAA) Posterior Condylar Angle (PCA) and the Inferior Condylar Angle (ICA) in individuals. A CT scan of 50 (25 paired) cadaver femora was made. The FAA, PCA and ICA were measured. Statistical analysis of comparative relationships between these different angles was examined by calculating Pearson correlation coefficients and a paired t-test. The mean FAA, PCA and ICA for the whole group were respectively 11.7˚ (range 0 - 32, SD 8.2), 5.18˚ (range 0 - 12, SD 2.4) and 4.4˚ (range 0 - 10, SD 2.1). A correlation of 0.82 (p = 0.01) of the FAA was found between left versus right. For the overall group a correlation coefficient between the PCA of the left and right femur was r = 0.59, p = 0.01. The Pearson correlation between the FAA and PCA in the whole group was r = 0.27, p = 0.06. In females this was r = 0.54 (p = 0.03). Although the difference of the mean ICA and PCA was very small (0.7˚), there was no correlation between these angles (r = 0.14, p = 0.23). In conclusion, one should be aware that, considering the weak correlation of the FAA and PCA, an individual rotational variation exists. Furthermore, no correlation was found between the PCA and ICA. Therefore, for now, this angle cannot be assumed to be helpful in TKA. A more individual approach in total knee arth- roplasty seems essential for future TKA.
Keywords:
Knee, Femoral Anteversion Angle, Posterior Condylar Angle, Inferior Condylar Angle, Computed Tomography

1. Introduction
Knowledge of the anatomy of the femur is essential in hip (THA) and knee arthroplasty (TKA). Since malrotation problems can only be objectivated in extreme cases (i.e. patella dislocations and hip dislocation), less severe malrotations usually go unnoticed, but these patients may have clinical symptoms. These symptoms might even necessitate revision surgery [1] -[5] . Recognition of not only the ideal coronal and sagittal plane position but also transverse plane position of a joint preoperatively might prevent less optimal prosthesis position. Thus knowledge on anatomic morphology is important and might be useful in determining the position of a prosthesis within a patient. In general, only weight bearing AP and lateral views of the knee are made, thus information on torsion of the distal femur of the knee with respect to the proximal femur cannot be determined and therefore the position of the femoral component of a TKA cannot be determined from plain radiographs of the knee (with or without weight bearing. During surgery, the three most common references for setting the rotational (sagittal) position of the femoral component are (a) the posterior femoral condyles (b) the epicondylar axis and (c) the whitesides line, which is the alignment of the AP axis as estimated from the trochlear groove (Siston et al., 2005). Neither one is superior. The PCA (Figure 3) is the most common used rotational reference for TKA [2] [3] [6] -[8] . The torsion of the distal femur differs inter- and intraindividual in many studies [2] [8] -[12] . Since most measurement are out-of-plane with respect to the conventional AP and lateral knee and hip radiographs, measurement of torsion of the femur has to done at CT scans. Contrary, the inferior condylar angle (ICA) (Figure 4) can be measured at a conventional radiograph. Thus if the ICA is highly correlated to the PCA one could have a tool to estimate the distal femoral rotation on a conventional AP radiograph. Thus, the aims of this study are 1) to see if there is a relation between femoral anteversion and either the posterior condylar axis or the inferior condylar axis, and 2) to see if the posterior condylar axis and the inferior condylar angle can be used interchangeably for alignment of a femoral component of a TKA.
2. Materials and Methods
At the Anatomy Department of the Leiden University Medical Center (LUMC), 50 Caucasian femora were available after use for medical education. Exclusion criteria were: signs of prior trauma or surgery (e.g. prosthesis of the hip, knee) or signs of osteoarthritis. In total 25 paired cadavers (11 men, 14 female) were studied. The average age at time of death was 79 years (men: mean 74 years; SD 11); (female: mean 84 years; SD 7). The whole group ranged from 57 to 94 years.
All soft tissues were removed before scanning. A multislice CT scan was made according to a standard protocol. The CT scans were made on a 64-slice scanner (Aquilion, Toshiba, Otawara, Japan), scanning parameters were beam collimation 64 × 0.5 mm and pitch 0.828; images were reconstructed using a standard kernel with 1 mm slice thickness and 1 mm reconstruction index. The labelled femora were scanned per pair and the data were separated into single femurs. The measurements were done at random using a three-dimensional software system (OsiriX version 3.5.1, California, USA) and the same workstation (Apple, Mac OS X, California, USA).
3. CT Measurements
For all anatomical measurements we used the in literature most common used/described and reproducible me- thods. The measurements were done twice by the same observer (LCDK) at two different occasions (3 weeks apart) in a random order. All measurements of the Femoral Anteversion Angle (FAA) (Figure 2) are based on
the ORTHODOC protocol [13] . The differences and/or correlation of the most commonly used proximal and distal femoral angles (FAA and PCA) were analysed (a) within individuals, (b) between right/left and (c) gender, while these are most important in arthroplasties. We also analyzed the ICA to see whether there is a relationship between the ICA and PCA/FAA.
Measurements of the PCA were done as an adapted version of the measurements recommended by Yoshioka et al. [12] . The same adapted method was applied for the inferior condylar angle using the Trans Epicondylar Line (TEL) and the most distal bony axes in AP view (Figure 2(b), Figure 3(b), Figure 4(b)).
Femoral Anteversion Angle Measurement
The FAA was defined as the angle between the line through the centre of the femoral neck and head (FHNL) and the Posterior Condylar Line (PCL). We used a 5-step procedure, as a guideline:
1. A three-dimensional-overview was made. A so called thick slice was used showing the view through the middle of the femoral head and the middle of the femoral neck. The centre of the femoral head was measured by drawing the longest line through the head, perpendicular at the femoral neck line. The middle of this line was used as the centre of the head. The proximal line was drawn by starting a line through centre of the femoral head. The line parallel to both collum borders was used as femoral neck axis. In an anteroposterior and axial view it was checked if the figure (and FHNL) was through the centre of the femoral neck and head (See black line in Figure 1).
2. The second image was from the distal femur. The guidelines to make this figure were to have a view of the PCL and the TEL. The PCL is the line drawn along the most posterior edge of both femoral condyles. The TEL is defined as the line between the femoral medial (most prominent point) and lateral epicondyles.
3. Both images were made using the “thick slice” option in Osirix. Using this option the outer margins of the femoral bone and consequently the maximum diameter of the bone was visible. The thickness of all slices was set on 40 mm.
4. The Osirix images were converted to DICOM-images and these two images were superimposed (Figure 2), making the FHNL and the PCL visible in one view and measurements could therefore be performed without changing the slides.
5. For final measurement of the FAA, the “dynamic angle” option in the Osirix software was used. The usage of this “dynamic angle” option allows the researcher to indicate two separate lines in different slides. Therefore, this option makes it possible to use the same baseline angle, which has been measured once, in different slices. The FAA was calculated by identifying the femoral head and neck centre. This FHNL was referenced to the PCL.
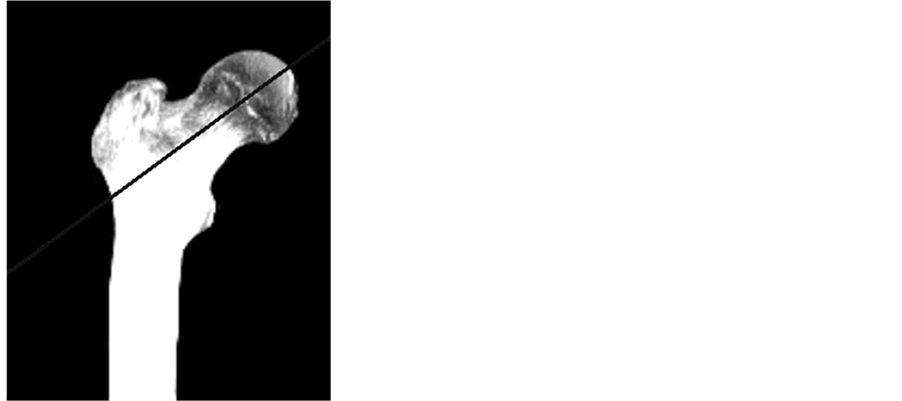
Figure 1. Step one in FAA measurement. CT thick slab image of the hip in coronal view to check whether the image is through the centre of the collum and centre of head. Black line: femoral head-neck axis.
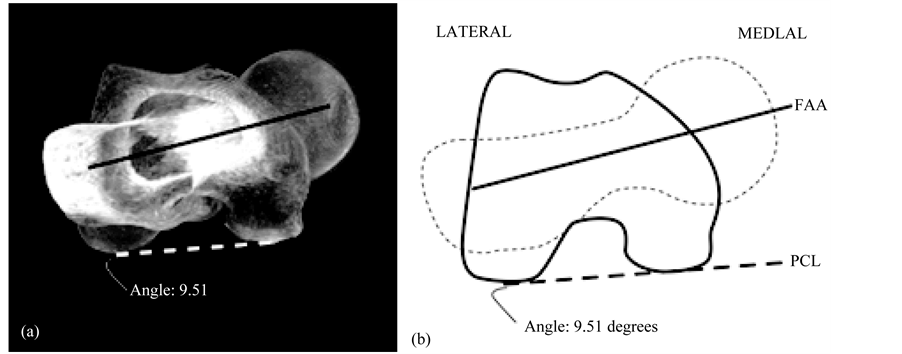
Figure 2. The two thick slab images of hip and knee projected over each other in the transverse plane. (a) The lines show the dynamic angle of femoral anteversion measurement. Black line: femoral head-neck axis. Dotted line: posterior condylar line; (b) Schematic drawing of the required situation.
Posterior Condylar Angle Measurement
The PCA is the angle between the posterior condylar line (PCL) and the anatomical or clinical transepicondylar axis (TEL) (Figure 3), in literature also called condylar twist angle (CTA) [14] .
The measurement of the PCA was done in a two-step procedure:
1. The PCA was measured on the figure of the distal femur used for measurement of the FAA, as described above. Using the “thick slap” option we optimised determination of the PCL.
2. The PCA was measured using the dynamic angle option (Figure 3). The PCA was noted positive when medially opened (external rotation).
Inferior Condylar Angle Measurement
The ICA is based on the inferior condylar line (ICL) and the TEL in the AP plane (Figure 4). This measurement is also performed in a two-step procedure.
1. An image in the coronal plane of the distal femur was made created. A thick slice was made of the figure showing the TEL and the most inferior borders of the femoral condyles. In the sagittal view was checked that the inferior borders of the condyles were visible.
2. The dynamic angle option was used. The ICA had a positive denominator if the angle opened medially (Figure 4).
4. Statistical Analysis
To estimate the reliability of the measurements the Intraclass Correlation Coefficient (ICC) and also the Standard Error of Measurements (SEM) were calculated. Descriptive analysis was performed to analyse the normal values and distributions of these angles, values are given as mean, standard deviation and range. Unpaired t-tests were applied to analyse the differences in these angles between males and females paired t-tests were used for comparison of the left to right difference. Correlation coefficients of the FAA, PCA and ICA (rho) were calculated for the whole group of femora and for gender (male and female) and side (left and right). To investigate if the PCA could be predicted, a regression model was build: both univariate and multivariate with FAA, ICA, gender and side as possible predictors. Statistical significance was set at a p-value of ≤0.05. All data were analysed using SPSS (SPSS for Windows Release 17.0; SPSS Inc., Chicago, Illinois).
5. Results
The descriptive values are displayed in Table 1. Important to note is the wide range in both ICA and PCA, although the mean is used in clinical practice, the difference from this mean value could reach more than 6 degrees. Although the mean value for PCA is used in clinical practice, we found that PCA can differ substantially with a range from 0 to 12 degrees. When we would use an arbitrary cut-off of plus or minus three degrees from
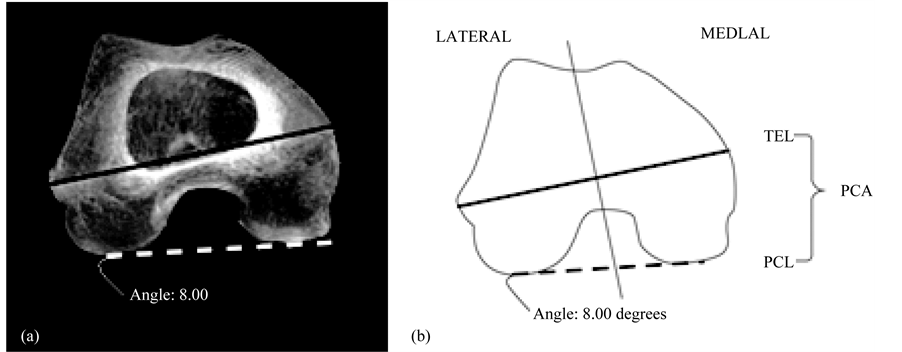
Figure 3. Computed tomography thick slab image of the knee in transverse view. (a) The lines show the dynamic angle of Posterior Condylar Angle measurement. Black line: anatomical transepicondylar axis. Dotted line: posterior condylar line; (b) Schematic drawing of the required situation.
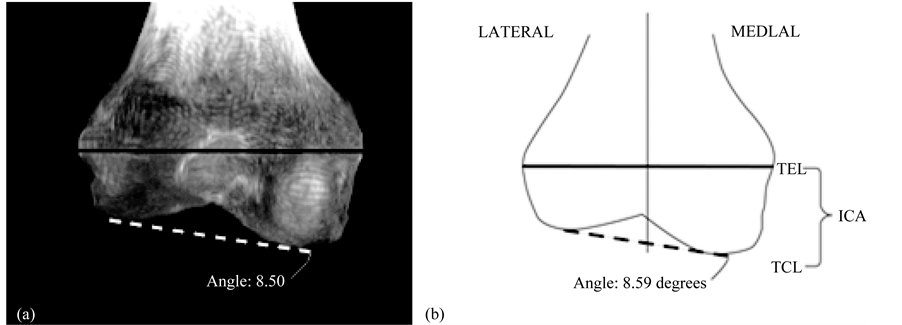
Fiureg 4. Computed tomography thick slab image of the knee in coronal view. (a) The lines show the dynamic angle of Inferior Condylar Angle measurement. Black line: anatomical transepicondylar axis. Dotted line: inferior condylar line; (b) Schematic drawing of the required situation.

Table 1. The measured angles of all femora.
FAA = Femoral Anteversion Angle; PCA = Posterior Condylar Angle; ICA = Inferior Condylar Angle. For all these angles the observed difference was not statistically significant for male versus female (FAA p = 0.46, PCA p = 0.74, ICA p = 0.15) and right versus left (FAA p = 0.71, PCA p = 0.40, ICA p = 0.47).
the mean value, 23% of the femora are outside this range. In Figure 5, a histogram is shown with the distribution of the deviation of the mean PCA.
6. Reliability
The Intraclass Correlation Coefficient of the two measurements of the FAA, PCA and ICA, were respectively 0.90, 0.91 and 0.93. Rating the ICC > 0.80 as good, the measurements are reliable. The SEM was low, namely for the FAA 0.94˚, for the PCA 0.79˚, and ICA 0.67˚.
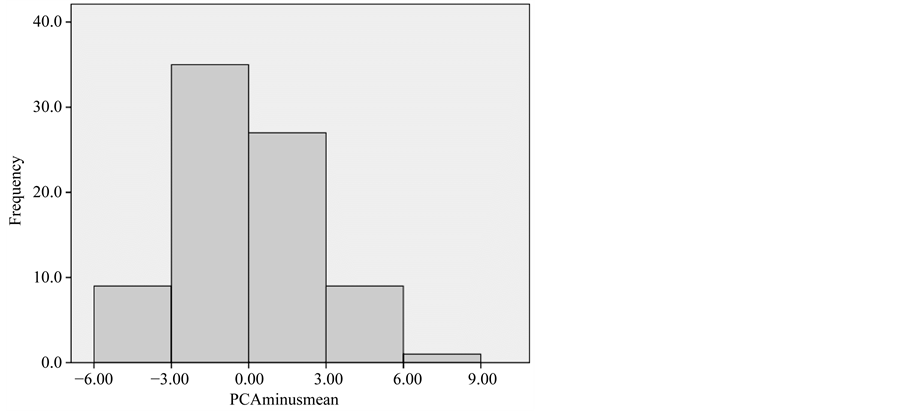
Figure 5. Histogram with the distribution of the deviation of the mean Posterior Condylar Angle.
7. Correlations
When we compare the FAA, PCA and ICA between males and females, only the ICA is different, 3.8˚ (SD 1.8) for females and 5.0˚ (SD 2.2) for males (p = 0.009). We found no difference in a paired t-test when comparing the left and right knee: the observed differences were 1.2˚ for the FAA (p = 0.27), 0.4˚ for the ICA (p = 0.30) and 0.4˚ (p = 0.30) for the PCA.
Though the mean difference between the ICA and PCA was very small, 0.3˚ (SD 2.9), there is no correlation between these two measurements; Rho is 0.14 (p = 0.23).
When comparing the correlation values of the FAA, PCA and ICA, only 3 correlations were found to be statistically significant;
1. For correlation measurements of the total group for the FAA, a strong correlation was found between the right and left FAA (r = 0.82; p = 0.01).
2. A weaker correlation was found for the right and left PCA (r = 0.59; p = 0.01) and not for the right and left ICA (r = 0.26, p = 0.11).
3. When the FAA compared to the PCA is subdivided in sexes, there is a moderate correlation for the female group only (r = 0.54; p = 0.01).
The other correlations were not statistically significant and very weak (Table 2). We used the FAA, ICA, gender and side as predictors for the PCA. It was not possible to predict the PCA with these mentioned factors as predictors.
8. Discussion
The aims of this study were 1) to see if there is a relation between femoral anteversion and either the posterior condylar axis or the inferior condylar axis, and 2) to see if the posterior condylar axis and the inferior condylar angle can be used interchangeably for alignment of a femoral component of an TKA.
Malrotation is one of the most important errors following TKA, and is directly related to poor outcome [1] - [5] . The aim of our study was therefore to analyse anatomical torsion differences of human femora using CT. There- fore the study was designed to determine whether an association existed between the FAA, PCA and the ICA and whether the ICA could be used as estimation for the PCA and FAA. Only a moderate correlation was found for the FAA and PCA in female, for all other combinations no significant correlation was found. Though the mean difference between the ICA and PCA was very small, we did not find a correlation between the ICA and PCA (r = 0.14) or FAA as well (r = 0.16).
Considering all potential anatomical measurements presented in literature, we used the most common used CT based method of Lee et al. As also shown by Sugano et al. 1998, there is no gold standard, they compared
Table 2. Correlations between the different angles (rho, *p < 0.05).
FAA = Femoral Anteversion Angle; PCA = Posterior Condylar Angle; ICA = Inferior Condylar Angle.
three CT measurement protocols and found different values. However, the ICC of all three angles in our used measured CT protocol was >0.80, thus they can be considered reliable measurements.
More than 60 papers have been published on measurements of the FAA from 1878 till now. Mikulicz et al. were the first describing measurements of the FAA [15] . Anatomic measurements, biplane radiography, axial tomography, ultrasonography, fluoroscopy and eventually multi-resonance imaging (MRI) and CT imaging have been used.
We only included published CT and MRI measurements to compare our results with (Table 3). We are aware of the fact that our measurements were only done by CT. However, we do believe that we could use the results of both MRI and CT for comparison of our results.
Especially gender differences in femoral anatomy are studied and discussed in literature [16] - [19] . Dargel et al. also concluded that implant design should focus interindividual variations in knee joint anatomy [17] .
Differences in FAA are common in literature, especially the range of this angle shows variability. Most of current researches are based on the axis through the femoral head-neck axis and a base-axis [20] - [23] . However, for this base-axis different reference lines are used. Toogood et al. use the transepicondylar axis of the distal femur [24] . Yoshioka et al. used the transverse functional axis of the distal femur which is referenced to the transepicondylar line (z-axis) as a reference to measure the values of FAA [12] . The lowest variability (i.e. Method 3.95% confidence limits of ±0.4˚) is shown when surgeons use the PCL as reference line [25] .
Therefore, this PCL was used for measurement of the FAA. The differences in measurement methods may reveal the differences in FAA noted in Table 3, showing a variability from 0˚ to 40˚ (Table 3), which demonstrates a large standard deviation and differences between observers and methods [20] [26] . We found comparable results for the FAA.
Femoral anteversion can influence the stresses on a TKA but alignment of the TKA components is not based on the FAA, solely on the mechanical axis and the rotational axis (PCA, etc.). Vice versa, an abnormal FAA is not corrected by adjustment of the TKA position but should, if necessary, be corrected extra-articularly.
Similar limitations in current literature on measurement exist for the distal femoral (PCA) measurements. The protocols differ in the listed studies. For example, Griffin et al. used the surgical TEL and used the cartilage surface of the knee [10] . Tanavalee et al. have made a comparison of the anatomical TEL and the surgical TEL, and there has been proven that the anatomical TEL is more reliable. Therefore, we used the anatomical TEL as a reference line to measure PCA and ICA [11] .
In perspective of the older knee joint, and more specific knees with osteoarthritis, there could be a difference in the PCL as reference line [10] . For example Aglietti et al. showed that posterior condyles can be worn off because of cartilage erosion [27] , influencing the PCL. However, macroscopically in our femora there was no cartilage loss on the posterior condylar region.
Analysis of the FAA, PCA and ICA showed a broad range of measurements and only a weak correlation between the proximal (FAA) and the distal femur (PCA). A more individual approach in total knee arthroplasty is getting more attention and our study results suggest that awareness of anatomical differences is needed to plan an individual arthroplasty.
When FAA and PCA were subdivided in sexes, we found only correlation in females (r = 0.54) compared to no correlation (r = 0.02) in males. The anatomical difference in varus/valgus alignment of the femur and shape of the pelvis between men and women, also reflecting probably a difference in shape of the femoral condyles in men and women and could be an explanation.
We did not find many correlations between all possible combinations of the FAA, PCA and ICA which were statistically significant. Thus an estimation of a easy to measure ICA line at the AP radiograph cannot be used to determine the epicondylar rotation. A wide range and variability was seen, supporting the hypothesis that considering sagittal alignment an individual, patient specific approach might be needed.
Table 3. English language literature review of FAA and PCA and ICA.
FAA = Femoral Anteversion Angle; PCA = Posterior Condylar Angle; ICA = Inferior Condylar Angle; Mean ± SD: Studies who split their results into gender (male vs female), this is noted in the table.
Based on our results, the ICA measured on a CT is not useful in estimating the PCA and thereby gives no information on the distal femoral rotation. Others found lack of correlation between PCA and ICA (called DCA in their study) as well [28] .
Along with this a new development is the usage of computer assisted orthopaedic surgery or/and preoperative MRI or CT planning combined with special patient specific manufactured intra-operative saw molds [29] .
These methods tend to to enhance visibility of surgical anatomy and improve accuracy by means of robotic de- vices or navigation systems [30] .
Nevertheless, there is no complete uniformity about the accuracy of these methods [31] . For example, it has been shown that individual sagittal position of the femoral component using a Computer Assisted Orthopaedic Surgery system differs significantly from the position on the postoperative CT scan [32] . However, debate exists on the value of CAOS for improvement of TKA placement.
It is possible that the morphology of the proximal femur determines the distal femur and vice versa [33] during growth, however, no (further) studies on this topic have been performed. Therefore it is of interest and probably important to examine the relationship of the distal femur to the hip for knee arthroplasty and other knee pathologies. This requires more time, technological and radiological effort.
9. Conclusion
Based on our results we conclude that the most frequently used proximal and distal femoral angles (FAA and PCA) differ within individuals, and between the right and left leg. There is only a correlation between FAA within individuals and in females there is a weak correlation of the FAA with the PCA. The ICA showed no correlation with the other measurements and was not useful to estimate the rotation of the distal femur. Current guidelines to determine rotation in TKR show great variation between individuals. Therefore, a more individual approach would be recommended to be implemented in these currently used guidelines.
Conflict of Interest
Each author certifies that he or she has no commercial associations (e.g. consultancies, stock ownership, equity interest, patient/licensing arrangement, etc.) that might pose a conflict of interest in connection with the submitted article.
References
- Soong, M., Rubash, H.E. and Macaulay, W. (2004) Dislocation after Total Hip Arthroplasty. Journal of the American Academy of Orthopaedic Surgeons, 12, 314-321.
- Berger, R.A., Rubash, H.E., Seel, M.J., Thompson, W.H. and Crossett, L.S. (1993) Determining the Rotational Alignment of the Femoral Component in Total Knee Arthroplasty Using the Epicondylar Axis. Clinical Orthopaedics and Related Research, No. 286, 40-47.
- Berger, R.A., Crossett, L.S., Jacobs, J.J. and Rubash, H.E. (1998) Malrotation Causing Patellofemoral Complications after Total Knee Arthroplasty. Clinical Orthopaedics and Related Research, No. 356, 144-153.
- Sikorski, J.M. (2008) Alignment in Total Knee Replacement. Journal of Bone and Joint Surgery (British Volume), 90, 1121-1127. http://dx.doi.org/10.1302/0301-620X.90B9.20793
- Miller, M.C., Berger, R.A., Petrella, A.J., Karmas, A. and Rubash, H.E. (2001) Optimizing Femoral Component Rotation in Total Knee Arthroplasty. Clinical Orthopaedics and Related Research, No. 392, 38-45.
- Laskin, R.S. (1995) Flexion Space Configuration in Total Knee Arthroplasty. Journal of Arthroplasty, 10, 657-660. http://dx.doi.org/10.1016/S0883-5403(05)80211-6
- Griffin, F.M., Insall, J.N. and Scuderi, G.R. (1998) The Posterior Condylar Angle in Osteoarthritic Knees. Journal of Arthroplasty, 13, 812-815. http://dx.doi.org/10.1016/S0883-5403(98)90036-5
- Poilvache, P.L., Insall, J.N., Scuderi, G.R. and Font-Rodriguez, D.E. (1996) Rotational Landmarks and Sizing of the Dis- tal Femur in Total Knee Arthroplasty. Clinical Orthopaedics and Related Research, No. 331, 35-46.
- Nagamine, R., Miura, H., Inoue, Y., Urabe, K., Matsuda, S., Okamoto, Y., Nishizawa, M. and Iwamoto, Y. (1998) Reliability of the Anteroposterior Axis and the Posterior Condylar Axis for Determining Rotational Alignment of the Femoral Component in Total Knee Arthroplasty. Journal of Orthopaedic Science, 3, 194-198. http://dx.doi.org/10.1007/s007760050041
- Griffin, F.M., Math, K., Scuderi, G.R., Insall, J.N. and Poilvache, P.L. (2000) Anatomy of the Epicondyles of the Distal Femur: MRI Analysis of Normal Knees. Journal of Arthroplasty, 15, 354-359. http://dx.doi.org/10.1016/S0883-5403(00)90739-3
- Tanavalee, A., Yuktanandana, P. and Ngarmukos, C. (2001) Surgical Epicondylar Axis vs Anatomical Epicondylar Axis for Rotational Alignment of the Femoral Component in Total Knee Arthroplasty. Journal of the Medical Association of Thailand, 84, S401-S408.
- Yoshioka, Y., Siu, D. and Cooke, T.D. (1987) The Anatomy and Functional Axes of the Femur. Journal of Bone and Joint Surgery, 69, 873-880.
- Lee, Y.S., Oh, S.H., Seon, J.K., Song, E.K. and Yoon, T.R. (2006) 3D Femoral Neck Anteversion Measurements Based on the Posterior Femoral Plane in ORTHODOC System. Medical and Biological Engineering and Computing, 44, 895-906. http://dx.doi.org/10.1007/s11517-006-0104-7
- Yoshino, N., Takai, S., Ohtsuki, Y. and Hirasawa, Y. (2001) Computed Tomography Measurement of the Surgical and Clinical Transepicondylar Axis of the Distal Femur in Osteoarthritic Knees. Journal of Arthroplasty, 16, 493-497. http://dx.doi.org/10.1054/arth.2001.23621
- Mikulicz, J. (1878) Ueber individuelle Formdifferenzem am Femur and an der Tibia des Menschen. Mit Berucksichtigung der Statik des Kniegelengs. Archiv fur Anatomie und Entwickelungsgeschichte, 117, 351-407.
- Chin, K.R., Dalury, D.F., Zurakowski, D. and Scott, R.D. (2002) Intraoperative Measurements of Male and Female Distal Femurs during Primary Total Knee Arthroplasty. Journal of Knee Surgery, 15, 213-217.
- Dargel, J., Michael, J.W., Feiser, J., Ivo, R. and Koebke, J. (2011) Human Knee Joint Anatomy Revisited: Morphometry in the Light of Sex-Specific Total Knee Arthroplasty. Journal of Arthroplasty, 26, 346-353. http://dx.doi.org/10.1016/j.arth.2009.12.019
- Conley, S., Rosenberg, A. and Crowninshield, R. (2007) The Female Knee: Anatomic Variations. Journal of the American Academy of Orthopaedic Surgeons, 15, S31-S36.
- Hitt, K., Shurman, J.R., Greene, K., McCarthy, J., Moskal, J., Hoeman, T. and Mont, M.A. (2003) Anthropometric Meas- urements of the Human Knee: Correlation to the Sizing of Current Knee Arthroplasty Systems. Journal of Bone and Joint Surgery, 85, 115-122.
- Hoiseth, A., Reikeras, O. and Fonstelien, E. (1989) Evaluation of Three Methods for Measurement of Femoral Neck Anteversion. Femoral Neck Anteversion, Definition, Measuring Methods and Errors. Acta Radiologica, 30, 69-73. http://dx.doi.org/10.3109/02841858909177461
- Miller, F., Merlo, M., Liang, Y., Kupcha, P., Jamison, J. and Harcke, H.T. (1993) Femoral Version and Neck Shaft Angle. Journal of Pediatric Orthopaedics, 13, 382-388. http://dx.doi.org/10.1097/01241398-199305000-00021
- Kuo, T.Y., Skedros, J.G. and Bloebaum, R.D. (2003) Measurement of Femoral Anteversion by Biplane Radiography and Computed Tomography Imaging: Comparison with an Anatomic Reference. Investigative Radiology, 38, 221-229. http://dx.doi.org/10.1097/01.RLI.0000059542.90854.EF
- Schneider, B., Laubenberger, J., Jemlich, S., Groene, K., Weber, H.M. and Langer, M. (1997) Measurement of Femoral Antetorsion and Tibial Torsion by Magnetic Resonance Imaging. British Journal of Radiology, 70, 575-579. http://dx.doi.org/10.1259/bjr.70.834.9227249
- Toogood, P.A., Skalak, A. and Cooperman, D.R. (2009) Proximal Femoral Anatomy in the Normal Human Population. Clinical Orthopaedics and Related Research, 467, 876-885. http://dx.doi.org/10.1007/s11999-008-0473-3
- Kirby, A.S., Wallace, W.A., Moulton, A. and Burwell, R.G. (1993) Comparison of Four Methods for Measuring Femoral Anteversion. Clinical Anatomy, 6, 280-288. http://dx.doi.org/10.1002/ca.980060504
- Ruwe, P.A., Gage, J.R., Ozonoff, M.B. and DeLuca, P.A. (1992) Clinical Determination of Femoral Anteversion. A Com- parison with Established Techniques. Journal of Bone and Joint Surgery, 74, 820-830.
- Aglietti, P., Sensi, L., Cuomo, P. and Ciardullo, A. (2008) Rotational Position of Femoral and Tibial Components in TKA Using the Femoral Transepicondylar Axis. Clinical Orthopaedics and Related Research, 466, 2751-2755. http://dx.doi.org/10.1007/s11999-008-0452-8
- Lustig, S., Lavoie, F., Selmi, T.A., Servien, E. and Neyret, P. (2008) Relationship between the Surgical Epicondylar Axis and the Articular Surface of the Distal Femur: An Anatomic Study. Knee Surgery, Sports Traumatology, Arthroscopy, 16, 674-682. http://dx.doi.org/10.1007/s00167-008-0551-9
- Spencer, B.A., Mont, M.A., McGrath, M.S., Boyd, B. and Mitrick, M.F. (2009) Initial Experience with Custom-Fit To- tal Knee Replacement: Intra-Operative Events and Long-Leg Coronal Alignment. International Orthopaedics, 33, 1571- 1575. http://dx.doi.org/10.1007/s00264-008-0693-x
- Pearle, A.D., Kendoff, D. and Musahl, V. (2009) Perspectives on Computer-Assisted Orthopaedic Surgery: Movement toward Quantitative Orthopaedic Surgery. Journal of Bone and Joint Surgery, 91, 7-12. http://dx.doi.org/10.2106/JBJS.H.01510
- Galaud, B., Beaufils, P., Michaut, M., Abadie, P., Fallet, L. and Boisrenoult, P. (2008) Distal Femoral Torsion: Comparison of CT Scan and Intra Operative Navigation Measurements during Total Knee Arthroplasty. A Report of 70 Cases. Revue de Chirurgie Orthopédique et Réparatrice de l’Appareil Moteur, 94, 573-579. http://dx.doi.org/10.1016/j.rco.2008.03.039
- van der Linden-van der Zwaag, H.M., Bos, J., van der Heide, H.J. and Nelissen, R.G. (2010) A Computed Tomography Based Study on Rotational Alignment Accuracy of the Femoral Component in Total Knee Arthroplasty Using Computer-Assisted Orthopaedic Surgery. International Orthopaedics, 35, 845-850.
- Wolff, J. (1969) Ueber die Bedeutung der Architectur der spongiosen Substanz fur die Frage vom Knochenwachsthum. Centralblatt fur die medicinischen Wissenschaften, 54, 849-851.
NOTES

*Corresponding author.