Advances in Computed Tomography
Vol. 2 No. 3 (2013) , Article ID: 36911 , 8 pages DOI:10.4236/act.2013.23015
Computer-Aided Design of X-Ray Microtomographic Scanners
National Research State University, Tomsk, Russia
Email: hailun@mail.ru
Copyright © 2013 V. I. Syryamkin et al. This is an open access article distributed under the Creative Commons Attribution License, which permits unrestricted use, distribution, and reproduction in any medium, provided the original work is properly cited.
Received January 11, 2013; revised February 16, 2013; accepted March 7, 2013
Keywords: Tomography; Microtomography; Non-Destructive Testing; Diagnosis; X-Ray Microtomographic Scanner; X-Ray Optical Systems; Mechatronic System; Computer-Aided Design
ABSTRACT
The article is to study the development of computer-aided design of X-ray microtomography—the device for investigating the structure and construction of three-dimensional images of organic and inorganic objects on the basis of shadow projections. This article provides basic information regarding CAD of X-ray microtomography and a scheme consisting of three levels. The article also shows basic relations of X-ray computed tomography, the generalized scheme of an Xray microtomographic scanner. The methods of X-ray imaging of the spatial microstructure and morphometry of materials are described. The main characteristics of an X-ray microtomographic scanner, the X-ray source, X-ray optical elements and mechanical components of the positioning system are shown. The block scheme and software functional scheme for intelligent neural network system of analysis of the internal microstructure of objects are presented. The method of choice of design parameters of CAD of X-ray microtomography aims at improving the quality of design and reducing costs of it. It is supposed to reduce the design time and eliminate the growing number of engineers involved in development and construction of X-ray microtomographic scanners.
1. Introduction
An important factor of X-ray microtomographic scanners implementation is the development of computer-aided design (CAD). CAD systems are widely used in many fields of science and industry, which use complex technical systems and their elements: automatic lines for the manufacture of parts and components, flexible automated production systems, transport devices, robotic manipulators, including X-ray microtomographic scanners.
Design—is the process of drawing up descriptions, requiring for creation of an nonexistent object in specified conditions, based on the initial description (specification), transformation of the initial description, optimization and correction of the specification and the algorithm of its operation in various languages, development (production and research) of the layout system and preproduction [1,2].
2. Methods and Materials
The method of X-ray imaging of the spatial microstructure and morphometry of materials, living objects or tissues does not require sample preparation and production of thin sections for the reference. Scanning objects of study gives full details of the internal microstructure of the sample space with micron and submicron spatial resolution saving the structure of the sample or the life of the test animals.
A three-dimensional image of the sample is based on the obtained X-ray beam of shadow projections, which are converted into digital images.
In the systems of spiral CT scanning and image acquisition are as follows. X-ray tube in a radiation mode bypasses the desired area of the object along the arc of 360˚, stopping every 3˚ of the arc and making longitudinal movement. Aligned with the x-ray tube the detectors— sodium iodide crystals that convert ionizing radiation into light emission—are adjusted [3]. The light emission hits the photomultiplier tubes, converting this visible part into electrical signals. Electrical signals are increased and then transformed into numbers, which are entered the computer. The X-ray beam passing through the medium of absorption decreases in proportion to the tissue found on its way, and contains information about the degree of its reducing at each scan position.
The following are some basic functional connections of X-ray computed tomography [4]. We will consider the connection of radiation intensity I registered by a detector with a linear coefficient of absorption μ in the form of the integral equation:
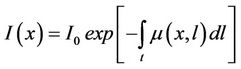
where I0—intensity of the incident beam, dl—element of absorption path along the ray corresponding to the scanning direction. The measurements are repeated for multiple scanning directions in relation to the object.
Computer tomography (CT) scanners create a digital image by measuring the intensity of X-rays passing through the object during the rotation in relation to the X-ray tube. Absorption coefficient of the X-ray fan-beam is measured with a set of several hundred to several thousand X-ray detectors (usually hard crystalline). Detectors gather information in each projection, which is then digitized and analyzed by a computer. Based on these data, the computer constructs the crosscut CT images. This image has a number of advantages, including the ability to reconstruct it in the desired projection and a high transmissibility of low contrast objects (which is significantly higher in CT scanners than in other methods of construction of the X-ray image).
Obtained with CT images show the anatomical structure of the object in the section with a density resolution better than 1%. In general the problem of distribution of a physical quantity (e.g. linear attenuation coefficient)
g(x) was solved by I. Radon in 1917.
Figure 1 illustrates the results of Radon inversion.
Let L be a beam, traversing the object, s—the length measured along it, O—the origin of coordinates, j—the angle between the base line OM, lying in the selected level and a perpendicular line hanging from O to L, p— the shortest distance from O to L, n—unit vector defined

Figure 1. Variables used in the formulas (1) and (2).
by angle j. Thus, it can be written:
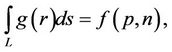 (1)
(1)
where two-dimensional vector r, rotated by an angle q in relation to the OM, describes the location on the plane of the point at which the distribution g is found on projections f, p, n, as shown by I. Radon:
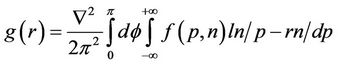 . (2)
. (2)
Currently, a large number of efficient algorithms for receiving tomograms from projections f (p, n), using fast computers and implemented on CT scanners, is developed.
Intensity attenuation of beam of homogeneous X-rays, results of absorption and scattering is shown in Figure 2.
When a narrow parallel beam of homogeneous X-rays having the same wavelength λ, flows through a layer of substance with thickness D, intensity of the beam will decrease (while entering this layer) due to absorption and scattering.
If IX—the intensity of the beam of X-rays, flowing through the elementary layer in thickness dx, separated from the surface of the absorbing body by x cm, then decrease of intensity dIX inside this layer will be proportional to the beam intensity IX, included in this elementary layer, and the thickness of this layer dx:
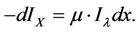
where μ—coefficient of proportionality, called the linear attenuation coefficient, which depends on the wavelength and type of absorbing material.
Generalized scheme of the designed X-ray microtomographic scanner is shown in Figure 3.
X-ray microtomographic scanner consists of the following units:
1) Source of radiation (X-ray tube).

Figure 2. Absorption and scattering of X-rays in the object.
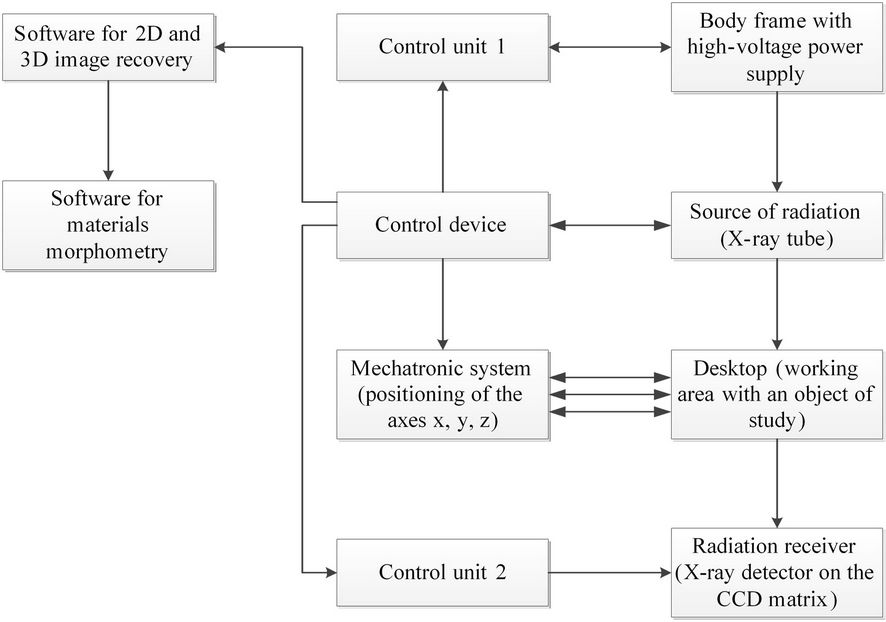
Figure 3. Generalized scheme of the X-ray microtomographic scanner.
2) Radiation receiver (X-ray detector on the CCD matrix).
3) Mechatronic system (positioning of the axes x, y, z) [5].
4) Desktop (working area).
5) Body frame with high-voltage power supply.
6) Control unit 1.
7) Control unit 2.
8) Control system (microcontroller or PC client).
9) Software (reconstruction of 2D and 3D images).
10) Software for materials diagnostics.
Specifications of the X-ray microtomographic scanner designed:
1) Number of resolution elements of the detector.
2) Power supply consumption.
3) The range of recovery value of absorption.
4) The range of the probe radiation (monochromatic and braking).
Specifications of the X-ray radiation source:
1) The maximum output voltage with constant potential.
2) Maximum output current.
3) Maximum power output.
4) Output voltage and its interval.
5) Number of characters of the selected voltage on the display.
6) The number of characters the current voltage on the display.
7) Accuracy of adjustment of output voltage.
8) Constancy of output voltage at given supply fluctuations.
9) Output current.
10) The number of characters of the selected current display.
11) The number of characters of the actual current display.
12) Accuracy of current setting.
13) Current stability at set supply voltage fluctuations.
14) Electrical parameters: the number of phases, voltage, frequency.
15) Power consumption.
16) Maximum current consumption.
Specifications X-ray optical elements:
1) The possibility of X-ray amplification (scope).
2) The size of the field of view (no less than).
3) Wavelength range.
Specifications of mechanical engineering assemblies for positioning of the sample examined:
1) The number of degrees of liberty.
2) Accuracy of the sample positioning.
Block scheme of software for intelligent neural network analysis system of internal microstructure of objects is shown in Figure 4.
The system includes:
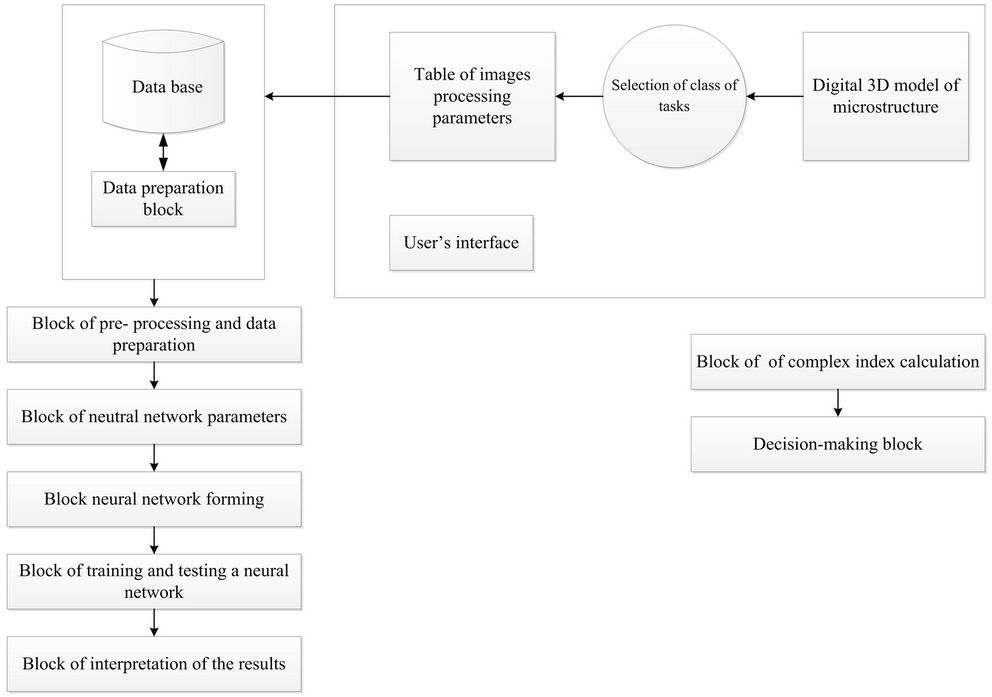
Figure 4. Block scheme of software for intelligent neural network analysis system of internal microstructure of objects.
1) Storage and processing module of the database, including the block of data preparation and the data base itself.
2) The user interface, which includes a digital model of the microstructure of the object, software tools for selection of class of tasks and parameters of processing of tomograms.
3) Unit of complex index calculation and decisionmaking unit.
4) Block of pre-processing and data/parameters of neural network preparation and interpreter of results.
Operating of Intelligent Neural Network Analysis System of Internal Microstructure of Objects includes:
1) Selection of class of tasks (image recognition, analysis of the homogeneity of a qualitative examination of abnormal changes in the properties of the object);
2) Forming of the table of images parameters line by line for each pixel. Preparation of training and testing samples on the basis of the reference image.
3) Creation of a neural network (topology selection, initializing of synapses cards).
4) Training a neural network with image segmentation in the hidden layer to define and classify the characteristics of the object.
5) Testing of the neural network.
6) Presentation of the neural network test cases, the calculation of the complex index, the interpretation of the results.
Functional scheme of software of the X-ray microtomographic scanner designed is shown in Figure 5, which shows the connection between the various functional blocks of the software.
For software control the user and the administrator’s interfaces are used, each of which is designed to solve a specific class of tasks.
The user’s interface is used for operating the program in normal mode, providing direct access to the module reconstruction process control, module of selection and adjustment of parameters and estimating module. All these modules use data storage modules while in operation. Module of 3D reconstruction of the object based on the shadow projection, module of 3D microstructure model of virtual movement, module of conversion to various formats are also used. From the user’s interface there is a limited access to the module of operating the device (no adjustments).
From the administrator’s interface full access to the module of operating the device as well as access to mo-
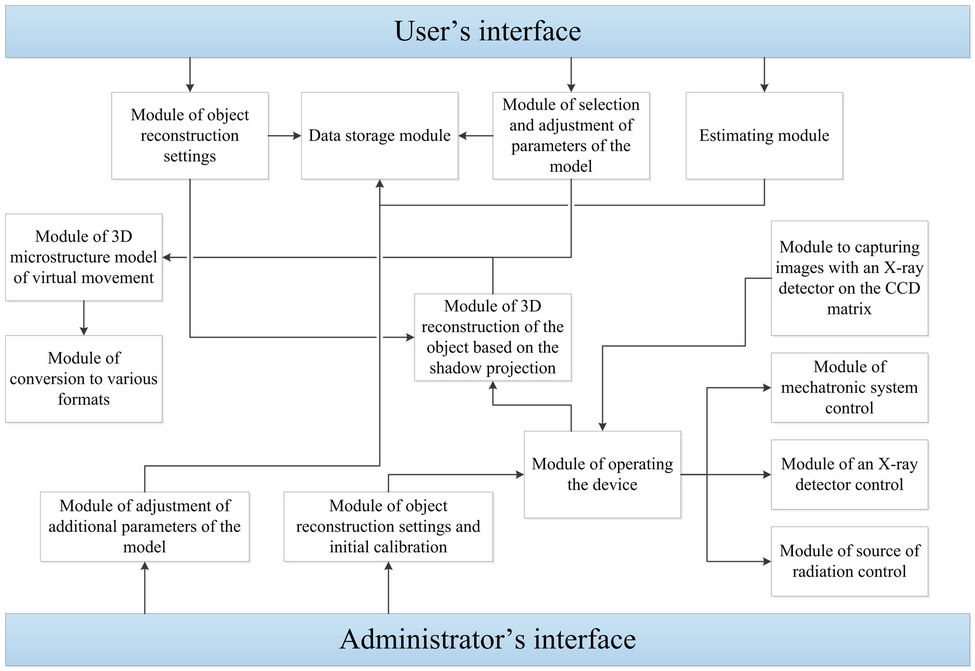
Figure 5. Functional scheme of software of the X-ray microtomographic scanner.
dule of adjustment of additional parameters of the model, module of object reconstruction settings and initial calibration are provided.
When choosing the design parameters of the X-ray microtomographic scanner the following method (the use of which does not depend on the further application) can be used.
1) Select the type of the X-ray microtomographic scanner in accordance with specifications.
2) Determine the permissible inaccuracy of the X-ray system.
3) Select the receiver (X-ray detector) and the source (X-ray tube) of radiation, based on the requirements in terms of accuracy, resolution, color and brightness of the reconstructed image.
4) Calculate the power consumption and maximum current for components of the X-ray microtomographic scanner.
5) Define the layout of components of the X-ray microtomographic scanner, design the body frame and calculate the parameters of the high-voltage power supply.
6) Determine the permissible inaccuracy of the positioning  according to the requirements for the accuracy and resolution of the reconstructed image in accordance with the technical specifications.
7) Determine the required operation speed of the system in accordance with the terms of the specification, select the platform for implementation of the software for recovering of 2D and 3D images.
8) Determine the required power and memory of the control unit of the mechatronic system.
9) Develop the design of the mechatronic part of the X-ray microtomographic scanner, based on the requirements for the size and weight of the objects examined.
10) Define system requirements for vibration protection system of the X-ray microtomographic scanner.
11) Define system requirements for the software for 2D and 3D image recovery in accordance with the selected platform and the technical specification.
12) Develop the generalized scheme of software for 2D and 3D image recovery; identify the most power using operations.
13) Calculate the required operation speed for different parts of the software.
14) Design and implement the software for 2D and 3D image recovery.
15) Develop metrological support of the X-ray microtomographic scanner.
In accordance with the above mentioned method, the development of the X-ray microtomographic scanner and CAD system is carried out.
3. Results
Following scheme of CAD of X-ray Microtomographic Scanners is proposed and shown in Figure 6.
That presents an iterative process. X-ray Microtomographic Scanners design is a combination of problems (choice of structural and numerical parameters of the sys-
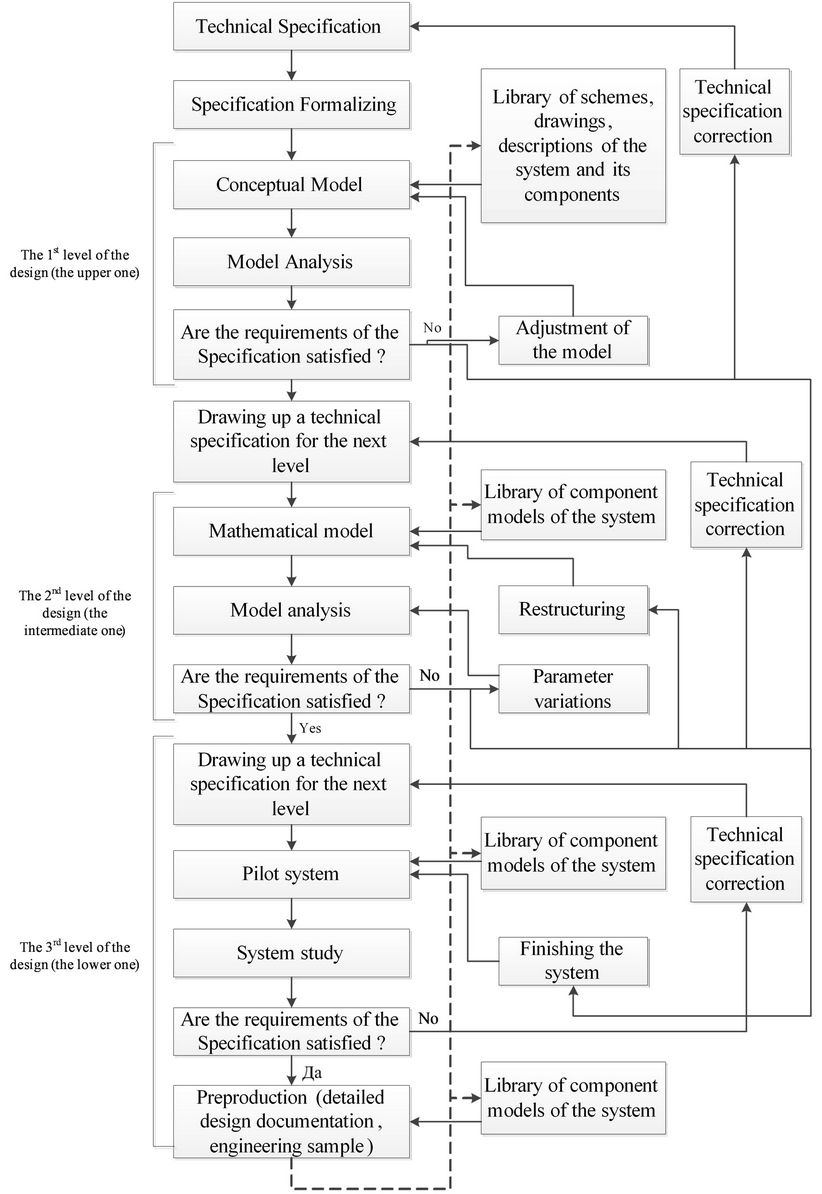
Figure 6. Computer-Aided Design of the X-ray Microtomographic Scanner.
tems developed) and analysis (the study of the synthesized system.) The phase synthesis can be repeated in case of negative test results. In the case of a satisfactory result of the iterative process at this stage of the specification, the design process moves the next level of design.
At each level of the design a model of an X-ray Microtomographic Scanner is presented, implemented in a form different from the real one. The models can be presented in the form of abstract mathematical formulas (analytical modeling), algorithms which allow to simulate the operation of an X-ray Microtomographic Scanner on a computer (computer simulation), copies or models (physical modeling).
The design process can be divided into three stages [2]: upper, middle and lower. At the upper design phase the model of an X-ray Microtomographic Scanner is presented in the form of a content model, which can be described in human language, illustrated with schemes, sketches, drawings, diagrams, tables, graphs. Thus, the content model is the one of the «input» languages of CAD of Xray Microtomographic Scanners. In this case, the terms of reference should be formalized—lead to the parameters and expressions, clear for CAD of X-ray Microtomographic Scanners.
The second level is called the level of design amendment and parameterization of the model. This level of design is also called the level of synthesis of the mathematical model, which is a set of mathematical objects (numbers, variables, vectors, etc.) and the relations between them, reflecting the properties of the system from the point of view of the designer. Among the alternate designs, the best option is searched for. So far this task is called structural optimization, and parameter calculation—parametric optimization.
If the information content of the content model is insufficient to build a mathematical model, it is necessary to return to the first level of the design and complete subsystems of the content model of the designed X-ray Microtomographic Scanner. When selecting the content model and the structural synthesis the functional-cost analysis, which is a multimeter method for designing an optimal variant of the structure of the product, should be used. Mathematical models synthesis can be done using well-known methods used in CAD of X-ray Microtomographic Scanners. The second stage of the design causes terms of references for the next stage of the design.
The lower level of the design should include the development of the device and causes the stage of pre-production. If necessary, the terms of reference can be adjusted according to the test results. At this stage, well known subsystems of Computer-aided Design of X-ray Microtomographic Scanners can be used.
It should be noted that according to the results of each level technical specifications for each step or the general design of the X-ray Microtomographic Scanner can be adjusted (confirmed) (if applicable). After the model test and prototyping, the correction (correction and addition) of run-time library is performed. In Figure 6 the effect shown by the dotted line.
Once a choice of a content model is made, structural and parametric optimization is implemented, the basic parameters of X-ray Microtomographic Scanner should be set and the method of calculation of the visual system should be developed [6].
4. Discussion
The scientific results were presented and discussed at the international, national and regional conferences and in scientific journals as a part of work for the Russian Federal Program No. 16.523.11.3009 [7-9].
5. Conclusion
The algorithm described above is cross functional for the design of an X-ray Microtomographic Scanner. The system will improve the use of production capacity, find the best options of engineering solutions, speed up the process of equipment selecting with minimal financial and time costs.
REFERENCES
- V. I. Syryamkin and V. S. Titov, “Vision Systems,” RASCO, Handbook, Tomsk, 1992, 367 p.
- I. P. Norenkov, “Basic Concepts of Computer-Aided Design,” 2nd Edition, Bauman Moscow State Technical University Press, Moscow, 2002, 336 p.
- V. E. Panin, V .E. Egorushkin and P. V. Makarov, “Physical Mesomechanics and Computer Design of Materials,” Nauka, Novosibirsk, 1995, 298 p.
- V. K. Kuleshov, “Physical and Experimental Basis of Radiation Monitoring and Control.Ch. 1: Basic Theory and Practice of Radiation Control,” Tomsk Polytechnic University, Tomsk, 2007, 341 p.
- Yu. M. Osipov, “Multi Coordination Electro Mechatronic Propulsion System,” Tomsk State University of Control Systems and Radioelectronics Press, Tomsk, 2010, 320 p.
- M. A. Bubenchikov, E. E. Gazieva, A. O. Gafurov, G. S. Glushkov, D. S. Zhdanov, D. V. San’kov, V. I. Syryamkin, S. V. Shidlovskii and A. V. Yurchenko, “Modern Methods of Materials Research and Nanotechnologies,” Tomsk State University Press, Tomsk, 2010, 366 p.
- E. N. Bogomolov, V. V. Brazovskiy, A. Zh. Kaztaev and V. I. Syryamkin, “Ccontrol. Diagnostics, “Spectrum, Moscow, 2012, pp. 122-125.
- E. N. Bogomolov, V. V. Brazovskiy and V. I. Syryamkin, “Method of Calculating of Digital X-Ray Microtomographic Scanners,” 13th International Scientific Conference on Measurement, Control, Information, Altai State Technical University Press, Barnaul, 2012, pp. 29-32.
- E. N. Bogomolov, V. V. Brazovskiy, V. I. Syryamkin, V. A. Borodin, A. Sh. Bureev and A. V. Vasiliev, “Engineering Calculation of X-Ray Microtomographic Scanners,” Multifunctional Chemical Materials and Technologies, Tomsk, 2012, pp. 307-309.