Computational Water, Energy, and Environmental Engineering
Vol.06 No.03(2017), Article ID:77075,14 pages
10.4236/cweee.2017.63016
Water Quality Evaluation Using Back Propagation Artificial Neural Network Based on Self-Adaptive Particle Swarm Optimization Algorithm and Chaos Theory
Mengshan Li, Wei Wu, Bingsheng Chen, Lixin Guan, Yan Wu
College of Physics and Electronic Information, Gannan Normal University, Ganzhou, China

Copyright © 2017 by authors and Scientific Research Publishing Inc.
This work is licensed under the Creative Commons Attribution International License (CC BY 4.0).
http://creativecommons.org/licenses/by/4.0/


Received: April 26, 2017; Accepted: June 19, 2017; Published: June 22, 2017
ABSTRACT
To overcome the shortcomings of the traditional methods of water quality evaluation, in this paper, a novel model combines particle swarm optimization (PSO), chaos theory, self-adaptive strategy and back propagation artificial neural network (BP ANN) that was proposed to evaluate the water quality of Weihe River in China. An improved PSO algorithm with a self-adaptive inertia weight and a chaotic learning factor tuned by logistic function was developed and used to optimize the network parameters of BP ANN. The values of average absolute deviation (AAD), root mean square error of prediction (RMSEP) and squared correlation coefficient are 0.0061, 0.0163 and 0.9903, respectively. Compared with other methods, such as BP ANN, and PSO BP ANN, the proposed model displays optimal prediction performance with high precision and good correlation. The results show that the proposed method has the good prediction ability for evaluating water quality. It is convenient, reliable and high precision, which provides good analysis and evaluation method for water quality.
Keywords:
Water Quality, Particle Swarm Optimization, BP ANN, Improved PSO

1. Introduction
The water quality evaluation is an important link of its research system, and has almost become an indispensable important part of all the environmental quality evaluation, not only accurately orienting the pollution level of lakes/rivers and the trend of future development, but also more efficiently utilizing and protecting water, thereby, it provides a directional and principled scheme and basis for the conservation of water source [1] [2] [3] [4] .
Currently, there are several main methods of water quality evaluation including single factor evaluation, principal component analysis and comprehensive water quality identification index [5] - [12] . The mechanism of the single factor evaluation method is that using the classification of the worst single index of water quality to determine the classification of the comprehensive water quality; the method is simple and clear, and can directly attain the relationship between water quality and evaluation criteria, but fails to get a comprehensive evaluation, furthermore, the accuracy of the evaluation results is poor. The principal component analysis (PCA) is an integrated model for water quality assessment and it can be used to establish comprehensive evaluation index and the effect is better, but it’s difficult to get a better evaluation result if the participating index is too more to reduce the contribution rate of the principal component [9] [13] [14] [15] [16] [17] . Because the water quality is affected by many factors, there is a complex non-linear relationship between the evaluation index and water quality standard.
These traditional processing methods can’t be addressed complex nonlinear problems well and the traditional mathematical evaluation method gradually replaced by intelligent optimization algorithm.
In recent years, the artificial neural network (ANN) technology has attracted much attention; it has fast training speed and can approach all linear and nonlinear complex practical problems, furthermore, widely used in water quality evaluation [13] [18] [19] [20] . For example, the back propagation artificial neural network (BP ANN) is used to the water environment quality evaluation model; the Radial Basis Function Artificial Neural Network (RBF ANN) is adopted to evaluate water quality. The traditional neural networks have some shortcomings, including slow convergence speed, easy to trap into local extremum, so that many improved neural network models have been successfully applied to water quality evaluation [9] [14] [21] .
Particle swarm optimization algorithm (PSO) is one of the hot topics in the field of intelligent optimization; it has stronger global searching capability, but it’s easy to be premature convergence, in turn, the BP ANN has a strong local search capability. Therefore, in order to improve the BP ANN’s shortcomings of easy to fall into local optimum and depend on the choice of initial weight, this paper proposes an improved PSO algorithm based on chaos theory and adaptive strategy, and it’s used to optimize the parameters of BP ANN, thus obtaining a hybrid artificial neural network prediction model, called CSAPSO BP ANN at the same time, to discuss the prediction effect of the model through making the CSAPSO BP ANN model apply to water quality evaluation.
2. Model Theory
2.1. Improved Particle Swarm Optimization Algorithm CSAPSO
PSO algorithm have many advantages, including its easy implementation, and fewer parameters need to be adjusted, the convergence speed and efficiency are better, which make PSO become a typical swarm intelligence algorithms. When, in an n-dimensional search space, the total number of particles is m, each particle is assumed to be a potential solution. The particle is updated their speed and position by the formulas (1) and (2) in the solving iteration process [22] [23] [24] [25] .
 (1)
(1)
 (2)
(2)
where ,
,  denotes the inertia weight factor,
  and
and  indicate the position and velocity of ith particle at d-dimension and the k-th iteration respectively.
  and
and  are learning factors,
  represents the best position of the i-th particle in d-dimensions, and
  denotes the global best position.
The improved algorithm proposed in this study is called CSAPSO algorithm. The self-adaptive adjustment strategy is adopted to adjust inertia weight factor ( ),
), was defined as follows [26] [27] :
 (3)
(3)
where,  and
and  denote the maximum and minimum weights, respectively.
  denotes the global best fitness at the k-th iteration,
  denotes the average local best fitness ,
  is the maximum iteration.
The learning factors  and
and  of the improved algorithm are obtained from the chaotic sequences generated by the classical Logistic map [28] .
According to the formula (3), the position ( ) of each dimension of the current particle (
 ) is mapped to the [0,1] interval :
 (4)
(4)
where, the  interval denotes the definition domain of the d-dimensional variable (
 ).
).
After K iterations, the chaotic sequences  are generated by the formula.
 (5)
(5)
where,  denotes the Chaotic variables,
  is
is ’s value after the K-th iteration, K is the iteration number of chaotic map.
2.2. CSAPSO BP ANN Model
In BP ANN, the model establishes the nonlinear relationship between input and output by determining the weights and deviation of each layer in the network, from structural analysis, the nonlinear relationship between the input and the output can be understood as: , which,
  indicate the weight vector between input layer and hidden layer respectively, the weight vector between hidden layer and output layer and the deviation vector of hidden layer. That is to say, the performance of the network depends on the three main parameters (
 ) of the network.
The CSAPSO BP ANN model is obtained by using the CSAPSO algorithm to optimize the weight vector , the weight vector
  and the deviation vector
 , the particle is designed as:
 (6)
(6)
The procedure for CSAPSO BP ANN can be summarized as follows:
Step 1. Model initialization. The connection weights, biases and population parameters of the model are initialized randomly.
Step 2. Model training. Using the improved PSO algorithm to optimize the parameters of BP ANN, particles structure refer to that above design.
Step 3. Adjustment of model parameters. Through the output error, all parameters of the model are adjusted until the number of execution times arrives at the set value or the error meet the set conditions.
Step 4. Finish the output. After training, the model output each parameter, and then through the training model for testing.
Table 1 shows each parameter of the model.
3. Model Building
3.1. Experimental Data
Based on the national surface water environmental quality standard (GB3838- 2002), according to the six types of standards corresponding to the limits of the concentration of pollution factors (as shown in Table 2) to generate water quality assessment of the 718 groups of data, and using it to regard as modeling database, the 70% of the database data (503 groups) is used for network training, and the 30% (215 groups) is applied to network verification. In the test sample, 10 sets of test data were used to test the reliability of the model. The test sample was shown in Table 3.
The average absolute deviation (AAD), the root mean square error of prediction (RMSEP) and the squared correlation coefficient (R2) are adopted to evaluate the accuracy and reliability of model, and defined as follows:
 (7)
(7)

Table 1. CSAPSO BP ANN model parameter setting.
Table 2. The water quality standard (GB3838-2002) and expected output.
aDissolved oxygen. bVolatile phenol. cPermanganate index. dAmmonia nitrogen.
Table 3. Measured data for water quality evaluation.
 (8)
(8)
 (9)
(9)
where, N denote the number of the data sample,  and
and  respectively represent the predicted and predicted average values,
  and
and  are the experiment and experiment mean values.
3.2. Model Structure
The CSAPSO BP ANN model applied a three-layer network architecture. In the input layer node, it adopted 4 water quality evaluation indicators, namely DO, VP, CODmn and NH3-N. The number of input nodes is 4. The number of nodes in the output layer is 1, which represents the prediction of water quality. In the hidden layer, the number of neurons of different problems is generally not the same, heuristic method is used to optimize the number of hidden layer, according to the number of neurons increased from 5 to 15, a total of 11 CSAPSO BP ANN models were obtained. By calculating the AAD, RMSEP, R2 and the best fitness value of each model, the optimal number of hidden layer nodes is determined, as shown in Table 4.
Generally, the network with the least error and higher correlation coefficient is regarded as the optimal network structure. In this study, the smallest AAD with RMSEP and the maximum R2 structure is chosen as the optimal, according to Table 4. The hidden layer, which contains 9 neurons, is the best optimal PSO- BP hybrid neural model.
4. Results and Discussion
The structure of the CSAPSO BP ANN model was 4-9-1. According to the data examples of water quality evaluation standard, CSAPSO BP ANN was trained and verified, and the training curve is shown in Figure 1.
Table 4. Optimize CSAPSO BP ANN topological structure.
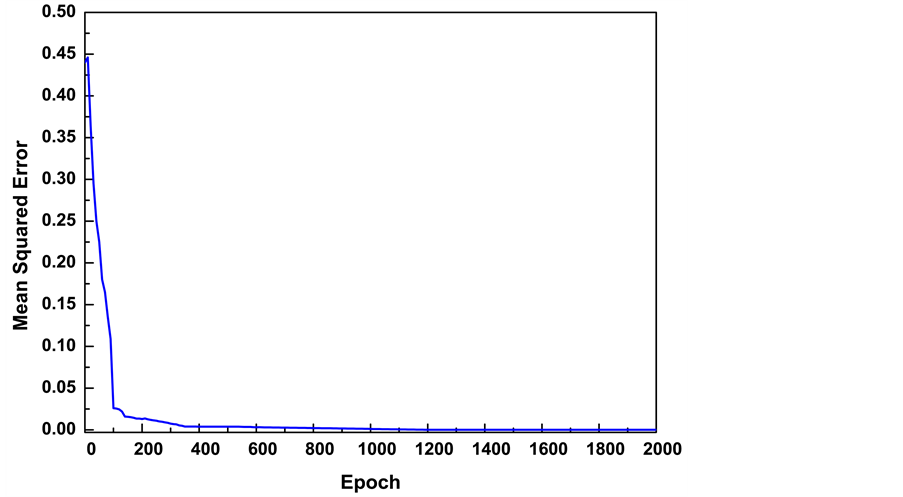
Figure 1. CSAPSO BP ANN training curve.
As we can see from the figure, it’s fast that the convergence rate of model, in the first 100 iterations. The convergence error decreases rapidly, especially in the first 50 iterations. After 350 iterations, the convergence error is stable and close to 0. The convergence rate is faster, in terms of the accuracy, the convergence error is close to 0, so the precision is higher. Undergo 350 iterations, the model has been well trained. Figure 2 shows the interrelation between the predicted value and the expected value in the training set. In the graph, the line and dot indicate the expected value and the predictive value data points respectively.
The vertical distance between the dot and the line show the absolute error between the predicted value and the expected value. For graph, the predicted data points are basically kept near the straight line, not only do show that the prediction performance of the CSAPSO BP ANN model is better in the training set, and the predicted value of the model is in good agreement with the expected values, but demonstrates the good prediction performance of the model.
After the model passed training, in order to verify the reliability of the trained network model, the model can be used to verify the data in the validation set. There are two points for verification purposes: one is to verify the training effect of the model; the other is to mildly adjust the network parameters, so that the network performance is better. Figure 3 shows the interrelation between the predicted value and the expected value in the validation set. From the vertical distance between the dot and the line, in the validation set, the prediction performance of CSAPSO BP ANN model is better, and the error and correlation are also good.
The experiment of training set and validation set shows that the CSAPSO BP

Figure 2. Prediction effect in training set.

Figure 3. Prediction effect in validation set.
ANN model has a good effect in water quality evaluation and prediction, both in the training set and the validation set, the predicted value is close to the expected output value, and the coincidence degree is high. From the results of the training, the model has been fully trained; according to the results of the verification, the predicted performance of the trained model is reliable and accurate.
After training and verification, the CSAPSO BP ANN model is applied to predict the samples in the test set. Figure 4 shows the correlation between the predicted value and the expected value of the model, and the curve denote the actual value of the test sample, the diamond represents the predicted data points of the model.
In the graph, the vertical distance between diamond and straight line is smaller, which shows that the CSAPSO BP ANN model has good prediction performance in the test samples. Apart from the prediction error of individual samples is relatively large, the predicted values of other are very close to the actual test values. It can be concluded from the test set that the model CSAPSO BP ANN has a good application in water quality evaluation.
Experiments show that whether the training set, the validation set, or the test set, the model CSAPSO BP ANN all show good prediction performance. And Table 5 displays the statistical data of the model predictions in each sample set. From AAD and RMSEP, the prediction error is small and the precision is high, as can be seen from the R2, the correlation between the predicted value and the real value of the test is better. Judging from the prediction performance of the 3 sets, the performance of the test set is slightly worse.
The above experimental results demonstrate that the model CSAPSO BP ANN

Figure 4. Prediction effect in testing set.
Table 5. Related data of the model prediction.
has good prediction performance in water quality evaluation, in order to evaluate the performance of the CSAPSO BP ANN model and other models, the CSAPSO BP ANN model and PSO BP ANN and BP ANN respectively conduct the water quality prediction experiment. When the parameters are the same, the convergence curve of each model is shown in Figure 5.
From the convergence curve of each model, the order of convergence rate of the three models in turn is: CSAPSO BP ANN, PSO BP ANN and BP ANN, the convergence rate of the CSAPSO BP ANN model is fastest. From the time of reaching the equilibrium of convergence, the CSAPSO BP ANN model has stabilized in the near 100 iterations. From the convergence accuracy, the CSAPSO BP ANN model is also obviously dominant, its final convergence accuracy is close to 0, significantly smaller than other models. Figure 6 shows the correlation between the predicted value and the expected value of the comparison model in the test set sample test, among the sub-graph (a) and (b) reflect the performance of each model from two angles of prediction data distribution and prediction error.
As we can be seen from the graph, in the case of the same parameter settings, the test results of each model are quite different. From sub-graph (a), the CSAPSO

Figure 5. Convergence curve chart of each comparison model.
BP ANN model’s predictive data points all exist in the position of near the line. For sub-graph (b), the vertical distance between the location of the CSAPSO BP ANN model’s predictive data points and the real data points is the shortest, which demonstrates the model’s predicted value is closest to the actual. Among the three models, the performance of CSAPSO BP ANN, PSO BP ANN and BP ANN decreased sequentially. Table 6 statistics the evaluation index data of each model in water quality evaluation.
In conclusion, the CSAPSO BP ANN model has the best comprehensive performance. The AAD and RMSEP’s data show that the prediction accuracy of the CSAPSO BP ANN model reach maximum, the R2 also reflects the best correlation of the model.
From efficiency and accuracy, the data from the table also reflects the dominate of the model CSAPSO BP ANN4. For accuracy, the RMSEP of the CSAPSO BP ANN model reach minimum, but its predicted capability is the strongest. Based on the execution time, the CSAPSO BP ANN, PSO BP ANN and BP ANN decreased sequentially. Due to the involvement of intelligent algorithms, the execution time will be bound to improve. Since the intelligent algorithm belongs to the iterative evolutionary algorithm, it can consume more time. The training of BP ANN is not the introduction of intelligent algorithm to make the execution time of the model smaller. And the CSAPSO BP ANN model introduced the adaptive strategy and chaotic mechanism into the improvement of the intelligent algorithm, which makes the model take a long time to execute. But on the whole, the execution time is not long and all are within acceptable limits.
5. Conclusions
1) In this paper, an improved PSO algorithm and BP ANN are combined to
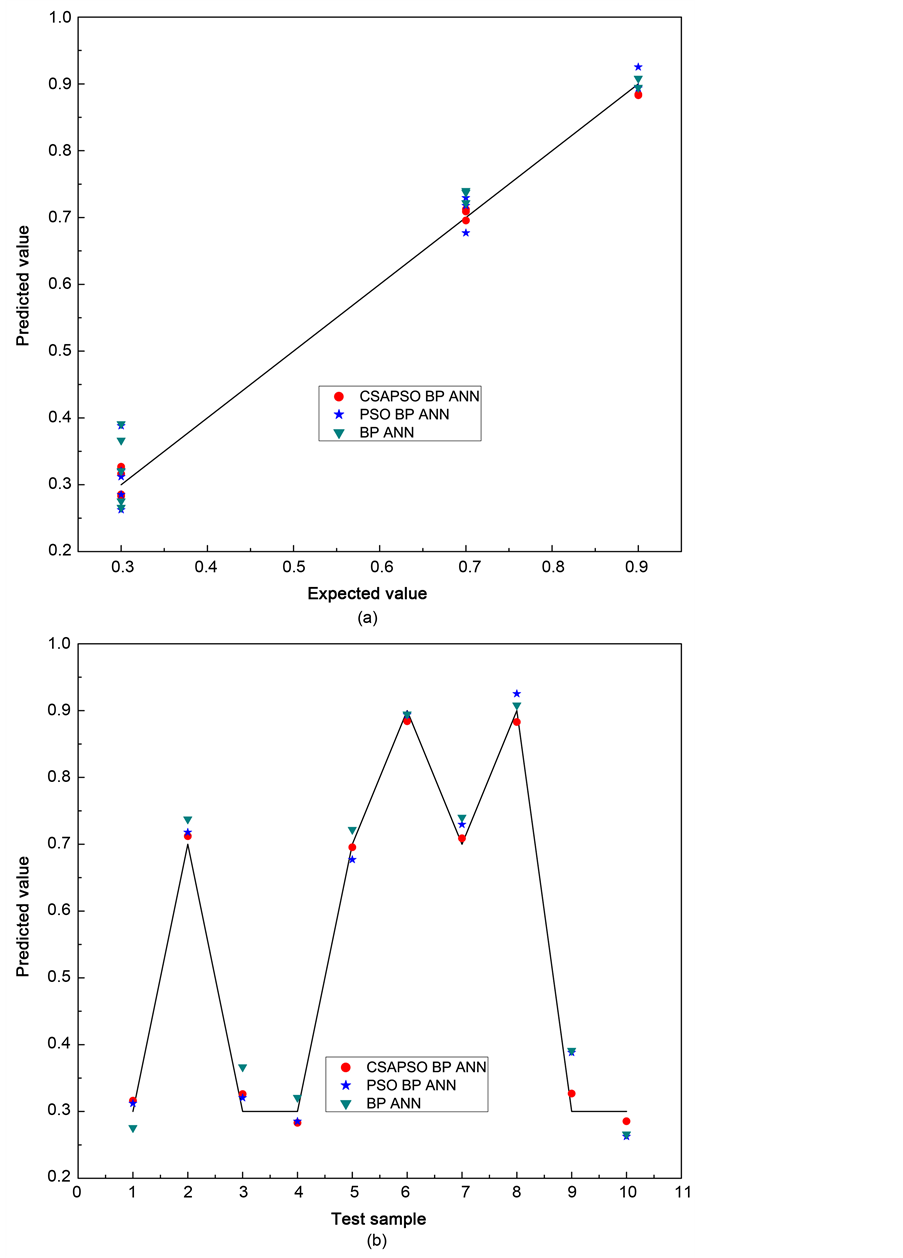
Figure 6. Comparison chart of predicted values and expected values of each model.
build a water quality prediction model. And the experimental results show that this model has the merits of strong classification ability, simple operation, low
Table 6. Values of ARD, R2, time and RMSEP for the comparison models.
prediction cost, thereby, using it to evaluate water quality is feasible and effective.
2) The performance of the CSAPSO BP ANN water quality evaluation model is very excellent; owing to the smaller error between the predicted value and the experimental value and the higher correlation, the water quality can be predicted well.
3) The proposed water quality evaluation model can provide a new idea for other prediction fields.
Acknowledgements
The authors gratefully acknowledge the support from the National Natural Science Foundation of China (Grant Numbers: 51663001, 51463015, 51377025) and the science and technology research project of the Education Department of Jiangxi Province (Grant Numbers: GJJ151012, GJJ150983).
Cite this paper
Li, M.S., Wu, W., Chen, B.S., Guan, L.X. and Wu, Y. (2017) Water Quality Evaluation Using Back Propagation Artificial Neural Network Based on Self-Adaptive Particle Swarm Optimization Algorithm and Chaos Theory. Computational Water, Energy, and Environmental Engineering, 6, 229-242. https://doi.org/10.4236/cweee.2017.63016
References
- 1. Aragones, L., Lopez, I., Palazon, A., Lopez-Ubeda, R. and Garcia, C. (2016) Evaluation of the Quality of Coastal Bathing Waters in Spain through Fecal Bacteria Escherichia coli and Enterococcus. Science of the Total Environment, 566, 288-297.
- 2. Kapembo, M.L., Laffite, A., Bokolo, M.K., Mbanga, A.L., Maya-Vangua, M.M., Otamonga, J.-P., Mulaji, C.K., Mpiana, P.T., Wildi, W. and Pote, J. (2016) Evaluation of Water Quality from Suburban Shallow Wells under Tropical Conditions According to the Seasonal Variation, Bumbu, Kinshasa, Democratic Republic of the Congo. Exposure and Health, 8, 487-496.
https://doi.org/10.1007/s12403-016-0213-y - 3. Sener, S., Sener, E. and Davraz, A. (2017) Evaluation of Water Quality Using Water Quality Index (WQI) Method and GIS in Aksu River (SW-Turkey). The Science of the Total Environment, 584-585, 131-144.
- 4. Bahmani, O., Sabziparvar, A.A. and Khosravi, R. (2017) Evaluation of Yield, Quality and Crop Water Stress Index of Sugar Beet under Different Irrigation Regimes. Water Science and Technology: Water Supply, 17, 571-578.
https://doi.org/10.2166/ws.2016.163 - 5. Liang, S., Jia, H., Xu, C., Xu, T. and Melching, C. (2016) A Bayesian Approach for Evaluation of the Effect of Water Quality Model Parameter Uncertainty on TMDLs: A Case Study of Miyun Reservoir. Science of the Total Environment, 560, 44-54.
- 6. Gholizadeh, M.H., Melesse, A.M. and Reddi, L. (2016) Discriminant Analysis Application in Spatiotemporal Evaluation of Water Quality in South Florida. Journal of Hydroinformatics, 18, 1019-1032.
https://doi.org/10.2166/hydro.2016.023 - 7. Shahryari, A., Nikaeen, M., Hatamzadeh, M., Vahid Dastjerdi, M. and Hassanzadeh, A. (2016) Evaluation of Bacteriological and Chemical Quality of Dialysis Water and Fluid in Isfahan, Central Iran. Iranian Journal of Public Health, 45, 650-656.
- 8. Ender, A., Goeppert, N., Grimmeisen, F. and Goldscheider, N. (2017) Evaluation of Beta-D-Glucuronidase and Particle-Size Distribution for Microbiological Water Quality Monitoring in Northern Vietnam. Science of the Total Environment, 580, 996-1006.
- 9. Zare Abyaneh, H. (2014) Evaluation of Multivariate Linear Regression and Artificial Neural Networks in Prediction of Water Quality Parameters. Journal of Environmental Health Science & Engineering, 12, 40.
https://doi.org/10.1186/2052-336X-12-40 - 10. Varol, S. and Davraz, A. (2016) Evaluation of Potential Human Health Risk and Investigation of Drinking Water Quality in Isparta City Center (Turkey). Journal of Water and Health, 14, 471-488.
https://doi.org/10.2166/wh.2015.187 - 11. Fernandez-Cassi, X., Silvera, C., Cervero-Arago, S., Rusinol, M., Latif-Eugeni, F., Bruguera-Casamada, C., Civit, S., Araujo, R.M., Figueras, M.J., Girones, R. and Bofill-Mas, S. (2016) Evaluation of the Microbiological Quality of Reclaimed Water Produced from a Lagooning System. Environmental Science and Pollution Research, 23, 16816-16833.
https://doi.org/10.1007/s11356-016-6812-0 - 12. Wang, J., Liu, G., Liu, H. and Lam, P.K.S. (2017) Multivariate Statistical Evaluation of Dissolved Trace Elements and a Water Quality Assessment in the Middle Reaches of Huaihe River, Anhui, China. Science of the Total Environment, 583, 421-431.
https://doi.org/10.1016/j.scitotenv.2017.01.088 - 13. Ma, L., Zhou, L. and Wang, T. (2014) Comprehensive Evaluation of Water Quality in Dahuofang Reservoir Based on BP Neural Network. Journal of Shenyang Agricultural University, 45, 637-640.
- 14. Li, R. and Qiao, J. (2015) A New Water Quality Evaluation Model Based on Simplified Hopfield Neural Network. In: Zhao, Q. and Liu, S., Eds., 2015 34th Chinese Control Conference, Institute of Electrical and Electronics Engineers, Hangzhou, 3530-3535.
- 15. He, J. (2016) Probabilistic Evaluation of Causal Relationship between Variables for Water Quality Management. Journal of Environmental Informatics, 28, 110-119.
- 16. Li, B., Yang, G., Wan, R., Zhang, L., Zhang, Y. and Dai, X. (2017) Using Fuzzy Theory and Variable Weights for Water Quality Evaluation in Poyang Lake, China. Chinese Geographical Science, 27, 39-51.
https://doi.org/10.1007/s11769-017-0845-2 - 17. Cho, Y. (2016) A Watershed Water Quality Evaluation Model Using Data Mining as an Alternative to Physical Watershed Models. Water Science and Technology-Water Supply, 16, 703-714.
https://doi.org/10.2166/ws.2015.180 - 18. Zang, L., Li, Z. and Wang, J. (2014) Model of Water Quality Evaluation with Normalized Indices Values Based on Probalistic Neural Networks. Environment Engineering, 32, 118-122.
- 19. Ren, J., Yu, Z. and You, X. (2015) Model for Water Quality Evaluation Based on Wavelet Neural Network of Adaptive Genetic Algorithm. Environment Engineering, 33, 144-148.
- 20. Charulatha, G., Srinivasalu, S., Maheswari, O.U., Venugopal, T. and Giridharan, L. (2017) Evaluation of Ground Water Quality Contaminants Using Linear Regression and Artificial Neural Network Models. Arabian Journal of Geosciences, 10, 128.
https://doi.org/10.1007/s12517-017-2867-6 - 21. Abyaneh, H.Z. (2014) Evaluation of Multivariate Linear Regression and Artificial Neural Networks in Prediction of Water Quality Parameters. Journal of Environmental Health Science and Engineering, 12, 40.
https://doi.org/10.1186/2052-336X-12-40 - 22. Yu, X. and Zhang, X. (2017) Multiswarm Comprehensive Learning Particle Swarm Optimization for Solving Multiobjective Optimization Problems. PLoS ONE, 12, e0172033.
https://doi.org/10.1371/journal.pone.0172033 - 23. Zhao, X.L., Turk, M., Li, W., Lien, K.C. and Wang, G.Z. (2016) A Multilevel Image Thresholding Segmentation Algorithm Based on Two-Dimensional K-L Divergence and Modified Particle Swarm Optimization. Applied Soft Computing, 48, 151-159.
https://doi.org/10.1016/j.asoc.2016.07.016 - 24. Wang, L., Yang, B. and Orchard, J. (2016) Particle Swarm Optimization Using Dynamic Tournament Topology. Applied Soft Computing, 48, 584-596.
https://doi.org/10.1016/j.asoc.2016.07.041 - 25. Taghiyeh, S. and Xu, J. (2016) A New Particle Swarm Optimization Algorithm for Noisy Optimization Problems. Swarm Intelligence, 10, 161-192.
https://doi.org/10.1007/s11721-016-0125-2 - 26. Li, M.S., Huang, X.Y., Liu, H.S., Liu, B.X., Wu, Y., Xiong, A.H. and Dong, T.W. (2013) Prediction of Gas Solubility in Polymers by Back Propagation Artificial Neural Network Based on Self-Adaptive Particle Swarm Optimization Algorithm and Chaos Theory. Fluid Phase Equilibria, 356, 11-17.
https://doi.org/10.1016/j.fluid.2013.07.017 - 27. Li, M.S., Huang, X.Y., Liu, H.S., Liu, B.X., Wu, Y. and Ai, F.R. (2013) Solubility Prediction of Gases in Polymers Based on Chaotic Self-Adaptive Particle Swarm Optimization Artificial Neural Networks. Acta Chimica Sinica, 71, 1053-1058.
https://doi.org/10.6023/A13020193 - 28. Huang, M., Li, X., Liu, H., Liu, B., Wu, Y. and Wang, L. (2015) Solubility Prediction of Supercritical Carbon Dioxide in 10 Polymers Using Radial Basis Function Artificial Neural Network Based on Chaotic Self-Adaptive Particle Swarm Optimization and K-Harmonic Means. RSC Advances, 5, 45520-45527.
https://doi.org/10.1039/C5RA07129A