Computational Water, Energy, and Environmental Engineering
Vol.2 No.2(2013), Article ID:30594,11 pages DOI:10.4236/cweee.2013.22005
Feasibility Study for Power Generation during Peak Hours with a Hybrid System in a Recycled Paper Mill
1Universidade Ritter dos Reis, Porto Alegre, Brazil
2Genesys Participações Ltd., Porto Alegre, Brazil
3Institution Pesquisas Hidráulicas, Universidade Federal do Rio Grande do Sul, Porto Alegre, Brazil
Email: albeluco@iph.ufrgs.br
Copyright © 2013 Adriano Beluco et al. This is an open access article distributed under the Creative Commons Attribution License, which permits unrestricted use, distribution, and reproduction in any medium, provided the original work is properly cited.
Received November 30, 2012; revised January 30, 2013; accepted February 8, 2013
Keywords: Hybrid Energy Systems; Micro Hydro Power; PV Modules; Energetic Complementarity; Feasibility Study; Computational Simulation; Software Homer
ABSTRACT
The differential pricing for peak hours encourages industrial consumers to look for independent power supplies for the period from 19 to 22 hours. This paper presents a study to identify the optimal solution for a recycled paper mill that also intends to work in that period. The factory is located in Rio Grande do Sul, in southern Brazil, and considers the use of a diesel gen set, a micro hydro power plant and possibly PV modules. Two micro hydro power plants were considered in the study, an old plant to be renewed and another to be fully implemented. The software Homer was used as a tool to determine the most feasible combination of components considered in the study. The sale of surplus power to the energy system appears as a key to viability of alternatives that are not based solely on diesel generators. The optimal solution consists of a combination of diesel generators and micro hydro power plant, in one case, and only on hydroelectric power plant in another, with a significant penetration of PV modules if its cost is reduced to 12% of the current price, selling an amount of energy equal to that which is bought. The annual water availability in one of the sites requires diesel supplement, while the other, more abundant, this supplement is not necessary.
1. Introduction
The peak time is three to four hours of the end of the day on which the power consumption increases dramatically by matching habits of various types of consumers.
This increase in consumption is traditionally fought with distinction in energy tariffs for that time, typically for the period from 19 hours to 22 hours.
The reversible hydropower plants provide a greater supply of energy at peak times, made possible by the difference in prices of energy at peak times and off-peak.
In Brazil, residential consumers still do not pay for more expensive energy at peak times, but the industrial consumers pay charges that may be more than six times higher than rates outside of peak hours. This differentiation forces industrial consumers to seek solutions for independent power supplies during peak hours.
Differences in tariffs are a tool for managing loads of different profiles and power that can be delivered to supply these loads [1,2]. This is a topic of ongoing study and the specific case of Brazil, for its size, the variety of loads and the pressure for economic development, awakens many discussions on applicable models for pricing [3].
The search for alternative energy supplies that may be competitive with electricity tariffs valid during peak hours are an obvious opportunity for development of renewable resources. Both the energies already established, such as solar and wind power and biomass fuels, as those still in development, can be employed.
This paper presents a study to identify the optimal solution for a recycled paper mill that also intends to work during the period from 19 to 22 hours without relying solely on the power supply provided by the grid.
2. The Recycled Paper Mill and the Problem to Be Solved
The factory is located near the city of Caxias do Sul1, Rio Grande do Sul, and produces recycled paper for cleaning, marketed in the southern states of Brazil. The plant requires about 60 employees and operates 21 hours a day, stopping only at peak times.
The mill has two paper making machines, each with a capacity to produce 900 tons per month, amounting to a total capacity of 1800 tons per month. These machines can operate producing recycled paper and paper produced from virgin pulp.
The two papermaking machines are installed in a building with total covered area of 10,500 square meters. This building houses all the facilities needed to operate these machines. There is also an administrative building and a large area dedicated to the treatment of effluents from industrial process.
Two machines, their auxiliary equipment and wastewater treatment plant consume a total power of 300 kW. The offices, lighting and other auxiliary systems, such as security, consume 25 kW.
The big difference in pricing of electricity during peak hours, compared to the off-peak, requires the company to cease production for three hours a day. Thus, the company (capable of operating 24 hours per day) currently produces about 1500 tons of paper per month.
This study aims to find a solution to the energy supply during peak hours, enabling the operation of the company during the 24 hours of the day.
Obviously, the company reserves the peak hours to perform daily maintenance tasks. The intention is to follow the schedule allowing peak for these activities, but with the intention to proceed with the production of paper whenever possible.
The problem can be viewed as a simple extension of a system based on diesel, with additional modules, wind turbines and a plant [5,6]. The isolated system and the system connected to the grid must be compared [7,8]. Contribution to sustainable development is an additional motivation for everyone involved [9,10].
The study was performed in two stages, as described in the next section. At first, the acquisition of a disabled micro hydro power plant was considered. At the second timing, the construction of a new hydro power plant at another location has been considered.
The study was based on computer simulations with software Homer, described in a later section. Homer simulates the operation of a power system and provides the optimal combination of components considered, receiving input data like component costs and their performances. Figure 1 shows schematically the system was simulated, described in detail in the next section.
3. Components of the Energy System
The study was conducted in two phases, known hereafter as Alternative A and Alternative B. These alternatives
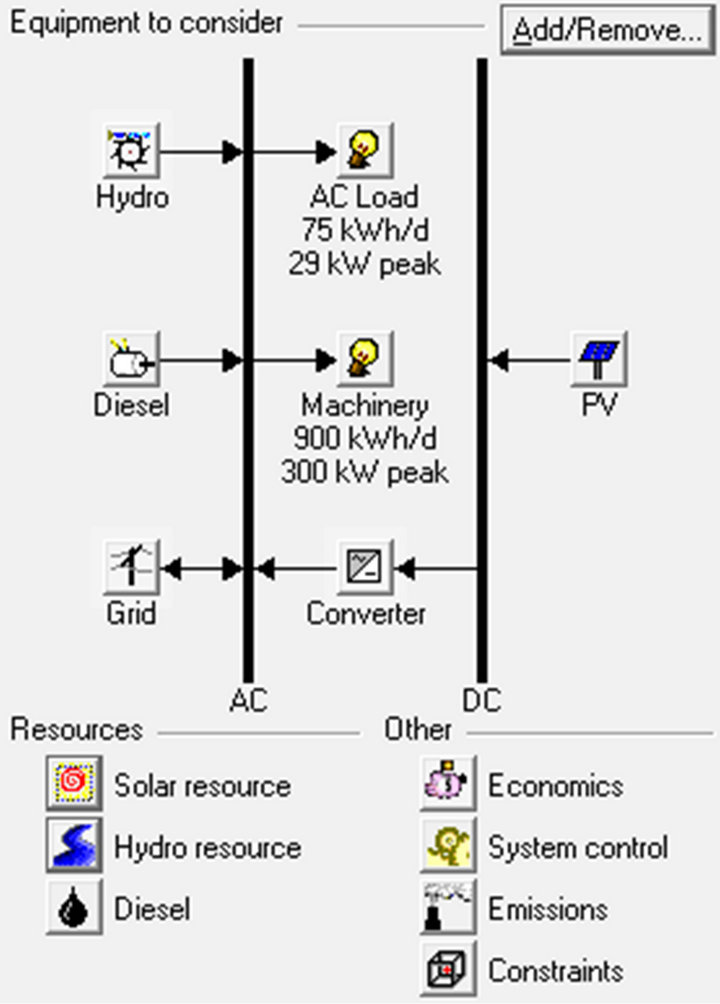
Figure 1. Hydro PV diesel hybrid system used to supply the recycled paper mill considered in the study.
are described in the following sections.
The first solution considered was a diesel generator set. Over time, it has become possible to acquire a disabled micro hydroelectric power plant with output of 240 kW and potential for expansion. A large covered area of the building that houses the two machines encouraged the inclusion of PV power generation in the study. These three possibilities were considered in Alternative A. A diesel generator set, another hydroelectric plant to be fully built and the same idea of using the covered area for photovoltaic generation is Alternative B.
These two alternatives take into account the sale of surplus power to the interconnected power system as an important factor in their development, both in the offpeak period and even at peak times.
In this study, the demand for electricity was divided into two loads, one for the office and the other corresponding to the papermaking machines and their auxiliary systems. Figure 2 shows the demand profile for the first load and Figure 3 shows the profile for the second load. These consumer loads only consider consumption to peak hours, since there is no intention to break the demand contract with the concessionaire of electric power distribution to the rest of the day.
Figures 2 and 3 show two graphs each. At first, the average electrical demand for each month, the deviations around these averages and maximum and minimum values are shown. The second graph consists of a diagram that summarizes the distribution of electrical demand for each hour of the day over all days of the year, according to the legend on the right. The step that appears in the months of November, December, January and February
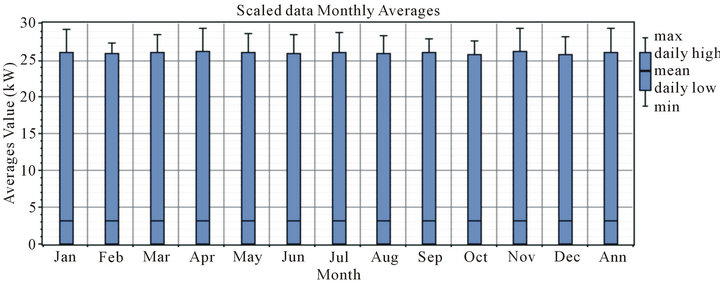
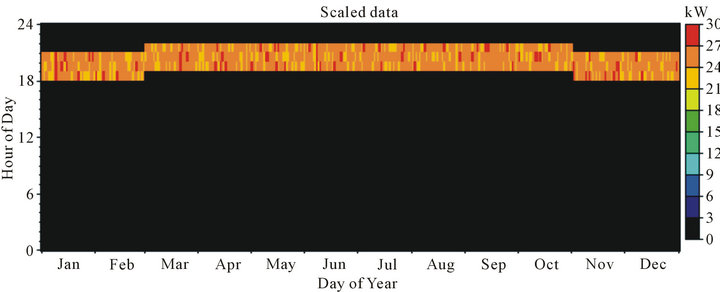
Figure 2. Average daily demand profile of the office of the paper mill.
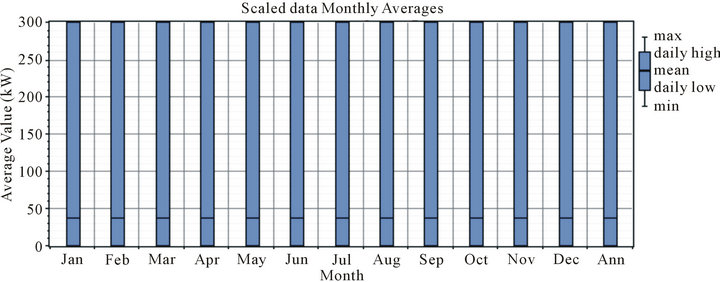
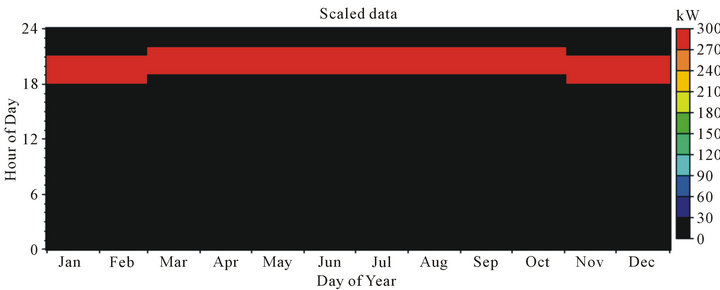
Figure 3. Profile of average daily demand for machinery of the paper mill.
matches the DST (daylight saving time).
3.1. Alternative A
The diesel generator set consists of two units with 150 kW each and possibly a third rig with 30 kW. The generators of 150 kW present initial cost of $36,000 and replacement cost at $32,400. Equipment with 30 kW presents initial cost of $8200. All have useful life of 15,000 hours.
The micro hydroelectric power plant considered in this alternative is the Trail 48, located in the municipality of Ivoti2, Rio Grande do Sul, launched in 1914 with 240 kW of installed power as a private venture, operated for several years by the government and deactivated in 1971. The distance to the headquarters of the company is around 72 km.
The Figure 4 shows the monthly average stream flow in the small dam that is part of this plant. The data set is synthetic and is compiled from data rainfall stations in the region. It is evident the wide variation between the months of highest and lowest availability, including energy restriction if the plant is expanded.
The cost of restoration of the facilities was not included in this study and may reverse in indirect benefits for a certain tourism potential in the region. The cost of refurbishing the plant was valued at $200,000 to modernize equipment and increase the installed capacity to 252 kW.
The dam is only 2.7 meters high and about 42 meters long. The annual average stream flow is 0.681 m3/s. There is a strong commitment to the small volume of storage due to silting occurred mainly due to human occupation of their surroundings.
A large covered area of the building that houses the papermaking machines encouraged the consideration of PV modules in this study. The opportunity to purchase PV modules from countries with low production costs or obtaining government incentives directed insertion of the modules in this study seeking the cost that would allow greater penetration of PV energy.
The software Homer [11] allowed the acquisition of data from solar availability in the region of Caxias do Sul, where the factory is located. Figure 5 shows the average incident solar radiation on a horizontal plane for each month, the deviations around these averages and maximum and minimum values are shown.
3.2. Alternative B
This alternative differs from Alternative A because it considers a new micro hydroelectric power plant. It’s actually a site with potential newly identified and not yet cataloged, located about 10 km from the headquarters of the factory. The height is 88 meters, the dam is approximately 30 meters long and 12 meters high, the annual average stream flow is 0.718 m3/s, with a total estimated potential of about 427 kW.
The Figure 6 shows the monthly average stream flow for the location originally designed for the implementation of a small dam. The data set is also synthetic and was compiled from data of rainfall stations in the region without storage capacity.
3.3. Energetic Complementarity between Water Availability and Solar Radiation
The water availability, both in Figure 4 as in Figure 6, and the incident solar radiation, in Figure 5, shows a clear and evident complementarity. Following the proposal of Beluco et al. [12], this complementarity can be assessed by the complementarity index κ.
Comparing Figures 4 and 5, the values 0.98 for complementarity in time, 0.82 for energy complementarity and 0.78 for complementarity between amplitudes are obtained. The overall index value is 0.63.
Comparing Figures 5 and 6, the values 0.92 for complementarity in time, 0.74 for energy complementarity and 0.89 for complementarity between amplitudes are obtained. The overall index value is 0.61.
The final values of the indices were low (0.63 and 0.61), but the complementarity that strikes the eye observing the figures are evaluated by complementarity in time, where values were higher (0.92 and 0.98).
References [13,14] present results that show the influence of different degrees of complementarity on the performance of hybrid energy systems. This subject is not well known and is still a matter of research.
4. Simulations with Homer
The software Homer [11] was developed by National Renewable Energy Laboratory (NREL) and is available for universal access in its version 2.68 beta. Homer simulates a system for power generation over the time period of 25 years at intervals of 60 minutes, presenting the results for a period of one year [15,16].
Simulations were performed for the following values for the optimization variables: 0.00 kW and 2000 kW for PV modules; 0 kW, 150 kW and 300 kW for diesel generation set; 0 kW and 380 kW for the purchase capacity from the grid; and 0.0 kW, 380 kW and 2000 kW for the converter power capacity.
Simulations were performed for the following values for the sensitivity inputs: 500 l/s, 900 l/s, 1,300 l/s and 1700 l/s for stream flow; $0.80, $1.10, $1.40 and $1.70 per liter of diesel; 1.00, 0.25, 0.15, 0.10, 0.05 and 0.01 for PV Capital Cost, PV Replacement Cost and PV
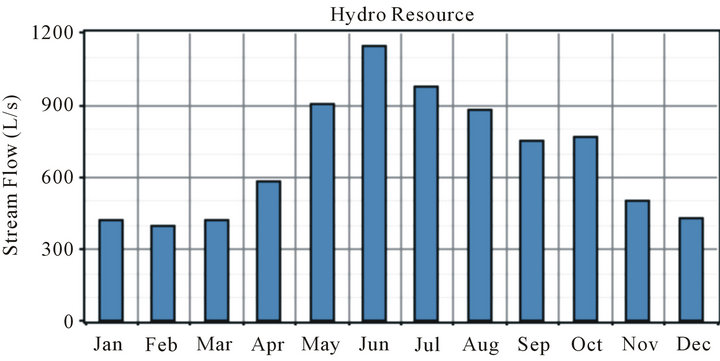
Figure 4. Trail 48 micro hydro characteristics.
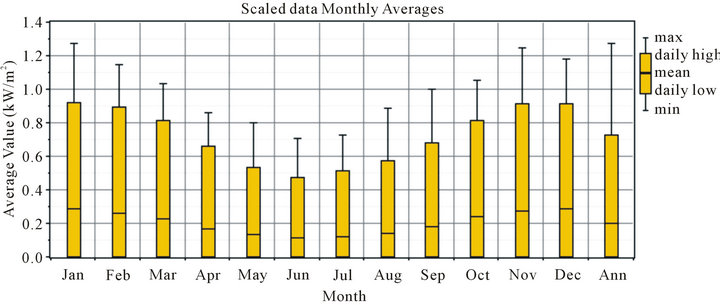
Figure 5. Incident solar radiation on a horizontal plane, obtained with software Homer.
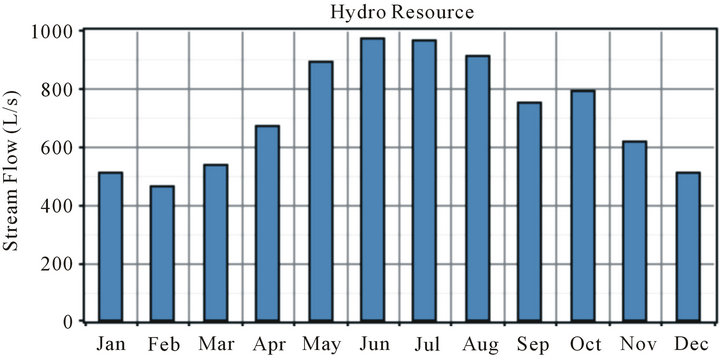
Figure 6. Trail 48 micro hydro characteristics.
Operating and Maintenance Costs multipliers, these latter two linked to the first.
$200,000, $320,000, $400,000 and $480,000 for hydro capital cost, $160,000, $256,000, $320,000 and $384,000 for hydro replacement cost, $4000, $6000, $8000 and $10,000 for hydro operation and maintenance costs, linked to 740 l/s, 860 l/s, 980 l/s and 1100 l/s for design flow rate, for Alternative A.
$1,075,000, $1,285,000, $1,500,000 and $1,700,000 for hydro capital cost, $800,000, $960,000, $1,200,000 and $1,400,000 for hydro replacement cost, $20,000, $24,000, $30,000 and $36,000 for hydro operation and maintenance costs, linked to 600 l/s, 720 l/s, 840 l/s and 960 l/s for design flow rate, for Alternative B.
A set of 72 simulations, with 1536 different values for the variables of sensitivity, for Alternative A, and other 72 simulations, with 1536 different values for the variables of sensitivity, for Alternative B, were performed. The results are presented and discussed in the next section.
5. Results and Discussion
Figures 7 and 8 show the main results for the Alternative A. The system of Figure 7 is able to sell 2000 kW to the grid and the system of Figure 8 has no capacity for sale to the grid. These two figures show the optimal combinations of components of the system of Figure 1 for different values of average stream flow and diesel price.
It can be seen in Figure 7 that the combination of grid connection and hydro power plant would prevail only for higher values of average stream flow. All combinations in brown in this figure correspond to the combination of grid and hydro, supported by diesel generator set.
For larger values of design flow rate and peak power price, in Figure 8, with no ability to sell energy to the grid, the area in the figure corresponding to the combination of grid supplies and hydro is smaller on the right side. It appears on the left, in black, a series of combinations of grid and diesel generator set only.
In Figure 7, the leftmost points of the optimization space have energy costs near $0.2/kW·h. This value will decrease further to the right of the chart, passing situations highly profitable due to higher water availability. The sale of surplus power to the grid allows these combinations present operating profit. Equilibrium occurs approximately at points around the stream flow of 900 l/s.
In these two figures, the regions corresponding to combinations including diesel generator set, the leftmost points, with less water availability, include two generators of 150 kW. More to the right, with higher water availability, combinations include one generator.
Figures 9 and 10 show the main results for the Alternative B. The same manner as for A, the system of Figure 9 is able to sell 2000 kW to the grid and the system of Figure 10 has no capacity for sale. These two figures also show the optimal combinations of the system of Figure 1 for different values of average stream flow and diesel price.
Figure 9 shows a much more favorable situation for the combination of grid connection and hydro power plant than that of Figure 7. The combinations which include diesel generator set, in brown, are now reduced to the lower right corner of the optimization space.
This difference is due in part to the best results obtained with a hydro power plant with higher available power and less stream flow variation. In Alternative A, the hydro power plant has a design flow rate of 740 l/s and an installed power of 240 kW, while in B, the design flow rate is 600 l/s and the power is equal to 380 kW.
In Figure 10, without possibility of selling energy to the grid and allowed to purchase energy, it arises in extreme lower left of optimization space a region corresponding to the combinations of grid connection and diesel generators only. All combinations include two generators of 150 kW, with cost of energy around $0.400/kW·h.
The simulations with different values for the stream flow can be useful for two reasons. First, the time series used in the study were synthesized from data sets obtained from stations in neighboring river basins, providing
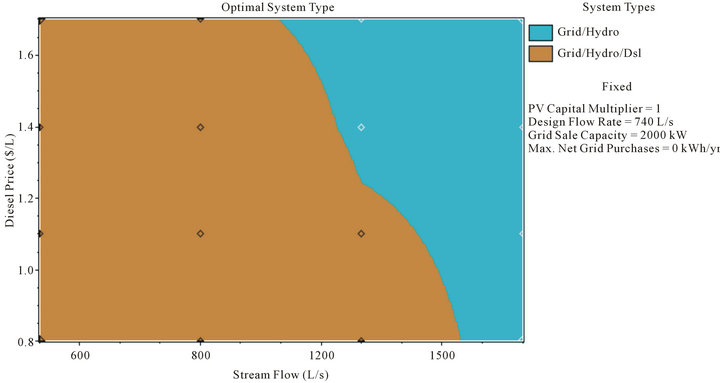
Figure 7. Results for the optimization space of the system of Figure 1, with components of Alternative A.
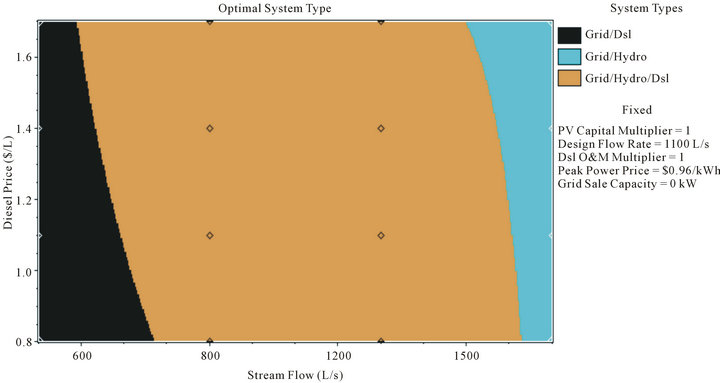
Figure 8. Results for the optimization space of the system of Figure 1, Alternative A, without grid sale capacity.

Figure 9. Results for the optimization space of the system of Figure 1, with components of Alternative B.
information that may be undersized. Second, they allow viewing combinations of system components and the cost of energy to higher water availability.
Alternative A would lead to an optimum combination of components that include the micro hydro power plant with design flow rate of 740 l/s, a 150 kW generator with no network connection, with probable failure in meeting the demand of around 10%.
The possibility of selling surplus power to the system makes this combination of components a solution quite profitable. The demand will represent only 15% of the total energy produced per year.
The price of diesel currently prevailing in the region is $1.1 per liter. The diesel generator is required only in
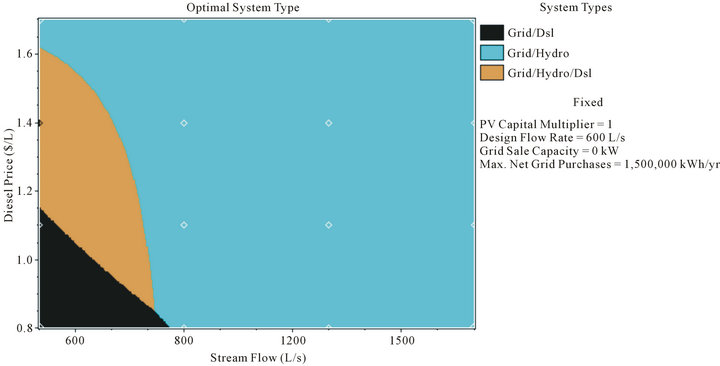
Figure 10. Results for the simulation of the complete system of Figure 1, Alternative B, without grid sale capacity.
periods of low water availability, when it would also be necessary to acquire power from the grid.
Alternative B would lead to an optimum combination of components that include the micro hydro power plant with design flow rate of 600 l/s, a 150 kW generator with no network connection, also with probable failure in meeting the demand of around 10%.
In Alternative A, the micro hydro power plant would have an installed power of 252 kW with a design flow rate of 740 l/s. In Alternative B, the installed power will be 427 kW, with a design flow rate of 600 l/s.
The results of these four figures indicate the presence of the connection to the grid as a component of optimal solutions. In part because the price charged for the provision of demand is relatively low, but also because at various times the cost of energy supplied by the hybrid system becomes greater than the cost of energy of the grid even at peak times.
The energy purchased from the system is always small, never exceeding 10% of all energy consumed during peak hours. If this supply is limited, the hybrid system would fail at most 10% in meeting demand. Considering that the company does not currently operate at peak times, go to operate for 90% of this period would be an increase in revenue that cannot be overlooked.
The modules do not appear in combinations of spaces optimization of simulations performed. Obviously, the high initial costs unfeasible solutions including solar energy. The difference between the hours of insolation and peak times requires an agreement for the sale of energy to the power system. The next section includes some results on this topic.
For Alternative A, an optimum combination of components, e.g., for 0.900 m3/s, for diesel price of $1.10, and design flow rate of 0.740 m3/s, include therefore the hydro power plant operating at 252 kW and diesel gen set with a capacity of 150 kW, with sale of surplus power to the grid. The energy price reaches $0.118 per kW·h sold, with 97% penetration of renewables and only 387 hours of operation of the diesel system.
The difference between the value of installed hydro power and value provided by Homer is due to the fact the software is identifying the flow that optimizes the system. The existing plant can be operated with a higher wattage or can be made a feasibility study for increasing the installed power.
For Alternative B, e.g., for 0.900 m3/s, for diesel price of $1.10, and design flow rate of 0.720 m3/s, the simulations indicate an optimum combination of components including the micro hydro power plant operating at 513 kW and selling surplus energy to the grid, without diesel gen set. The energy price reaches $0.388 per kW·h sold, with 97% penetration of renewables obviously equal to 100%. In this case it is easier to deal with the difference between the design flow and flow provided by Homer because the plant is still in the design phase.
These results and the above discussion indicate that the best choice is the Alternative B.
6. How Much Should Be the Cost of PV Modules to Increase Its Penetration?
PV modules do not appear among the optimal solutions in the previous section, from Figures 7 to 10. A large collection area and the high cost per kW installed, are certainly the reasons for this absence.
It is reasonable to seek prices from which the PV modules present a higher penetration. These prices could be considered as a minimum price for achieving greater penetration. With these values in mind, it will be possible to devise strategies to promote the installation of modules in greater quantity. With these values in mind, negotiate better prices with suppliers, obtaining benefits by buying in large quantities will also be possible.
Figure 11 shows simulation results for the optimization space of the system of Figure 1, Alternative A, with sales capacity to the grid equal to 380 kW, with PV capital multiplier equal to 0.05, above, and 0.01, lower.
The PV capital cost multiplier is simply the price of
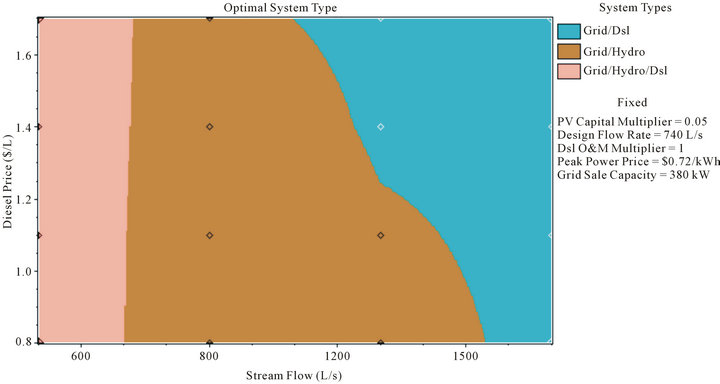
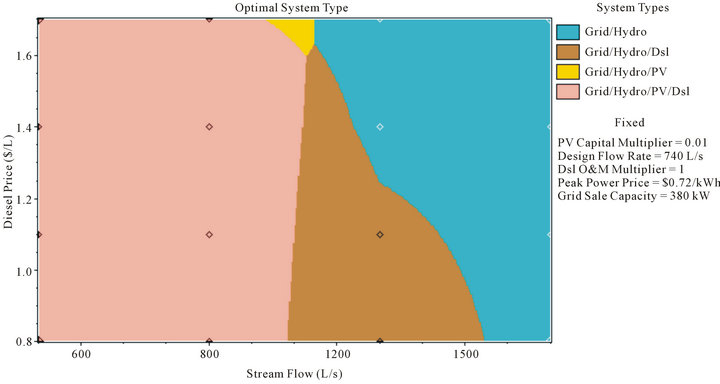
Figure 11. Results for the optimization space of the system of Figure 1, Alternative A, with sales capacity to the grid according to the installed PV power, with PV capital multiplier equal to 0.05 (above) and 0.01.
PV modules, multiplied by the indicated value. A multiplier 0.05 or 0.01 therefore corresponds to a hypothetical cost equal to 5% or 1% respectively of the current price. Simulations indicate the PV modules in optimization space only if the multiplier reaches 12%, corresponding to lower stream flow values. In such conditions, PV penetration becomes greater than zero.
In Figure 11, above, combinations that include PV modules appear only on the extreme left, where there is less water availability. Below, the area corresponding to combinations including PV modules occupies half the optimization space.
The simulations with 2000 kW sold to the grid indicate the operation of photovoltaic modules already starting with price at 40% of current prices, obtainable in the market for large acquisitions. Under these conditions, the company’s demand during peak hours becomes 15% of the total energy produced by the system. The hybrid system becomes a supplier of energy to the system, rather than an alternative to peak hours.
Reference [17] shows the main results obtained with Homer, with input and with the spaces corresponding to the different values of the variables of sensitivity.
7. Final Remarks
This paper presented a study to identify the optimal solution for a recycled paper mill that also intends to work during the period from 19 to 22 hours without relying solely on the power supply provided by the grid.
Alternatives considered for power generation were two micro hydro power plants, a diesel generator set and PV modules. One of the hydro power plants requires a restoration while the other must be completely constructed. PV modules were considered in a separate study, since it did not appear in solutions for its high initial cost.
The alternative which includes this second plant, designated as B in the text, is shown to be more appropriate. This alternative has a higher initial cost, but allows a lower cost of energy.
The possibility of selling surplus energy to the system is the key to enabling a lower cost of energy and to enabling the installation of PV modules, occupying a vast area available for photovoltaic generation.
The results indicate that Alternative A, with a combination of hydro and diesel leads to sell excess power and a return $0.188 per kW·h sold. Alternative B, only with hydro, leads to the sale of energy by the final value of $0.388 per kW·h sold.
Simulations indicate that a reduction to 40% of the actual cost of photovoltaic modules makes possible a higher PV penetration. Larger reductions can obviously further increase this penetration.
The study indicated that the photovoltaic power generation was more interesting in this case as an investment rather than as an alternative generation at peak times. Its viability will depend on the bargaining agreement of sale of surplus power to the grid.
The photovoltaic power generation was included in this study by the availability of large area for installation of the modules. The study should be extended, considering different values of installed power and different amounts of energy sold to the grid, to determine the optimal investment to be made.
8. Acknowledgements
This work was developed as a part of research activities on renewable energy developed at the Instituto de Pesquisas Hidráulicas, Universidade Federal do Rio Grande do Sul, in southern Brazil. The authors acknowledge the support received from the institution and responsiveness encountered during data collection at the paper mill. For commercial reasons, the identity of the recycled paper mill and location of the micro hydroelectric power plant component of the Alternative B, per request of the owners of the factory, were not disclosed.
REFERENCES
- J. Vetterli and M. Benz, “Cost-Optimal Design of an Ice Storage Cooling System Using Mixed Integer Linear Programming Techniques under Various Electricity Tariff Schemes,” Energy and Buildings, Vol. 49, No. 1, 2012, pp. 226-234. doi:10.1016/j.enbuild.2012.02.012
- A. F. Orlando, M. P. Málaga and M. M. Huamani, “Methodology for Generating Electric Load Profiles for Sizing an Electric Energy Generation System,” Energy and Buildings, Vol. 52, No. 1, 2012, pp. 161-167. doi:10.1016/j.enbuild.2012.04.014
- P. E. S. Santos, R. C. Leme and L. Galvão, “On the Electrical Two Part Tariff—The Brazilian Perspective,” Energy Policy, Vol. 40, No. 1, 2012, pp. 123-130. doi:10.1016/j.enpol.2011.10.029
- Google Maps, 2012. maps.google.com
- S. M. Shaahid, I. El-Amin, S. Rehman, A. Al-Shehri, F. Ahmad, J. Bakashwain and L. M. Al-Hadhrami, “TechnoEconomic Potential of Retrofitting Diesel Power Systems with Hybrid Wind PV Diesel Systems for Off-Grid Electrification of Remote Villages of Saudi Arabia,” International Journal of Green Energy, Vol. 7, No. 6, 2010, pp. 632-646. doi:10.1080/15435075.2010.529408
- S. M. Shaahid and M. A. Elhadidy, “Prospects of Autonomous/Stand-Alone Hybrid (PV Diesel Battery) Power Systems in Commercial Applications in Hot Regions,” Renewable Energy, Vol. 29, No. 2, 2004, pp. 165-177. doi:10.1016/S0960-1481(03)00194-0
- S. M. Shaahid, I. El-Amin, A. Rehman A. Al-Shehri, J. Bakashwain and F. Ahmad, “Potential of Autonomous/ Off-Grid Hybrid Wind Diesel Power System for Electrification of a Remote Settlement in Saudi Arabia,” Wind Engineering, Vol. 28, No. 5, 2004, pp. 621-627. doi:10.1260/0309524043028127
- M. A. Elhadidy and S. M. Shaahid, “Decentralized/StandAlone Hybrid Wind-Diesel Power Systems to Meet Residential Loads of Hot Coastal Regions,” Energy Conversion and Management, Vol. 46, No. 15-16, 2005, pp. 2501-2513. doi:10.1016/j.enconman.2004.11.010
- S. M. Shaahid and I. El-Amin, “Techno Economic Evaluation of Off-Grid Hybrid PV Diesel Battery Power Systems for Rural Electrification in Saudi Arabia—A Way forward for Sustainable Development,” Renewable and Sustainable Energy Reviews, Vol. 13, No. 3, 2009, pp. 625-633. doi:10.1016/j.rser.2007.11.017
- S. M. Shaahid and M. A. Elhadidy, “Economic Analysis of Hybrid PV Diesel Battery Power Systems for Residential Loads in Hot Regions—A Step to Clean Future,” International Renewable and Sustainable Energy Reviews Journal, Vol. 12, No. 2, 2008, pp. 488-503. doi:10.1016/j.rser.2006.07.013
- HOMER, “The Micropower Opyimization Model, Homer Energy,” Version 2.68 Beta, 2009. www.homerenergy.com
- A. Beluco, P. K. Souza and A. Krenzinger, “A Dimensionless Índex Evaluating the Time Complementarity between Hydraulic and Solar Energies,” Renewable Energy, Vol. 33, No. 10, 2008, pp. 2157-2165. doi:10.1016/j.renene.2008.01.019
- A. Beluco, P. K. Souza and A. Krenzinger, “A Method to Evaluate the Effect of Complementarity in Time between Hydro and Solar Energy on the Performance of Hybrid Hydro PV Generating Plants,” Renewable Energy, Vol. 45, No. 1, 2012, pp. 24-30. doi:10.1016/j.renene.2012.01.096
- A. Beluco, P. K. Souza and A. Krenzinger, “Influence of Different Degrees of Complementarity between Hydro and Solar Energy on the Performance of Hybrid Hydro PV Generating Plants,” Energy and Power Engineering, 2013.
- T. W. Lambert, P. Gilman and P. D. Lilienthal, “Micropower System Modeling with Homer,” In: F. A. Farret and M. G. Simões, Eds., Integration of Alternative Sources of Energy, John Wiley & Sons, Hoboken, 2005, pp. 379-418.
- P. D. Lilienthal, T. W. Lambert and P. Gilman, “Computer Modeling of Renewable Power Systems,” In: C. J. Cleveland, Ed., Encyclopedia of Energy, Elsevier, Oxford, 2004, pp. 633-647.
- A. Beluco, C. P. Colvara, L. E. Teixeira and A. Beluco “Simulation Results with Homer on Power Generation during Peak Hours with a Hydro PV Diesel Hybrid Energy System in a Recycled Paper Mill,” Internal Report, UFRGS, IPH, 2012. galileu.iph.ufrgs.br/beluco/docs/homer-2570018.pdf
NOTES
1The city of Caxias do Sul can be located on Google Maps [4] at http://goo.gl/maps/nQIiZ.
2The city of Ivoti can be located on Google Maps [4] at http://goo.gl/maps/lD30s.