Pharmacology & Pharmacy
Vol.07 No.09(2016), Article ID:70841,17 pages
10.4236/pp.2016.79046
Role of Angiotensin-(1-7) on Renal Hypertrophy in Streptozotocin-Induced Diabetes Mellitus
Dante Amato1, Alma R. Núñez-Ortiz1, José del Carmen Benítez-Flores2, David Segura-Cobos1, Pedro López-Sánchez3, Beatriz Vázquez-Cruz1*
1Laboratorio de Farmacología, Unidad de Investigación Interdisciplinaria en Ciencias de la Salud y la Educación, Facultad de Estudios Superiores Iztacala, Universidad Nacional Autónoma de México, Tlalnepantla, México
2Laboratorio de Histología, Unidad de Morfología y Función, Facultad de Estudios Superiores Iztacala, Universidad Nacional Autónoma de México, Tlalnepantla, México
3Sección de Estudios de Posgrado e Investigación, Escuela Superior de Medicina, Instituto Politécnico Nacional, Ciudad de México, México

Copyright © 2016 by authors and Scientific Research Publishing Inc.
This work is licensed under the Creative Commons Attribution International License (CC BY 4.0).
http://creativecommons.org/licenses/by/4.0/


Received: August 8, 2016; Accepted: September 23, 2016; Published: September 26, 2016
ABSTRACT
Participation of angiotensin II in chronic kidney diseases including diabetic nephropathy (DN) has been extensively described. Similarly, several studies support a protective role for angiotensin-(1-7). However, other studies suggest that some of the cellular effects of angiotensin-(1-7) may be deleterious. The objective of this study was to determine the role of exogenous angiotensin-(1-7) on renal hypertrophy development in rats with streptozotocin-induced diabetes. A control group and three groups of rats with streptozotocin-induced diabetes: untreated diabetic rats, diabetic rats treated with captopril, and diabetic rats treated with angiotensin-(1-7), were studied. After two weeks of treatment, the kidneys were removed under anesthesia with pentobarbital. The kidneys were weighed and the renal cortex was separated for analysis of AT1R, TGF-β1, MASR, and ACE2 expression by western blot. Rats in the three groups with diabetes had hyperglycemia, increased food and water consumption, and higher urinary volume than control rats. Treatment with captopril or angiotensin-(1-7) reversed streptozotocin-induced renal hypertrophy, measured by kidney weight, protein/DNA ratio in renal cortex, glomerular area, or proximal tubular cells area, proteinuria, and creatinine clearance reduction. AT1R, TGF-β1, and MAS receptor expression in renal cortex of diabetic rats increased significantly as compared to controls (p < 0.05); treatment with captopril or angiotensin-(1-7) reversed such increments. ACE2 in the renal cortex decreased in diabetic rats, but it was increased after treatment with captopril or angiotensin-(1-7). These findings suggest that exogenous administration of angiotensin-(1-7) may be renoprotective in early stages of diabetes mellitus.
Keywords:
Diabetes Mellitus, Streptozotocin, Ang-(1-7), MAS Receptor, Renal Hypertrophy

1. Introduction
The pathophysiological mechanisms related to diabetic nephropathy (DN) development are complex [1] [2] . Initial manifestations of renal injury are hypertrophy and glomerular hyperfiltration [3] [4] . Glomerular hemodynamic dysfunction and the process of kidney growth are interwoven [4] [5] . Early growth of the diabetic kidney depends on the proximal tubule. DNA synthesis is increased in the proximal tubular cells, peaking at day two. Hyperplasia and hypertrophy contribute to kidney enlargement [6] . This is in agreement with in vitro studies reporting that high glucose concentration stimulates proliferation of glomerular mesangial cells, associated initially with increased expression of the early genes c-myc and egr-1, and later to an antiproliferative phase, attributed to the bio-activation of transforming growth factor-β1 (TGF-β1) [7] [8] . Solute reabsorption increases as a result of proximal tubular cells growth, generating hemodynamic changes such as increased renal plasma flow and glomerular capillary hypertension, due to reduction of pre-glomerular resistance relative to post-glo- merular resistance, with consequent hyperfiltration [5] [9] , which in turn generates renal injury [10] [11] . Considerable evidence suggests that the renal renin-angiotensin system (RAS) plays an important role in the pathogenesis of DN [12] . Experimental and clinical studies using angiotensin-converting enzyme (ACE) inhibitors and Ang II subtype 1 receptor (AT1R) blockers diminish proteinuria and retard progressive glomerulosclerosis [13] - [15] . Ang II promotes systemic and intra-glomerular hypertension, and the aforementioned hypertrophic changes [16] . Ang II also increases TGF-β1 expression, which in turn mediates mesangial, glomerular, and tubular epithelial cells hypertrophy [17] , increases plasminogen activator inhibitor-1 synthesis, resulting in decreased matrix degradation, and inhibits the activity of mesangial cells collagenase [18] [19] . By activating NADPH oxidase, Ang II increases reactive oxygen species (ROS) renal production. ROS may act as signaling molecules and activate protein kinase C with the subsequent activation of mitogen-activated kinases (MAPKs). Redox- dependent activation of Akt/PKB and ERK1/ERK2 contributes to the stimulation of protein synthesis, which is crucial in renal hypertrophy [20] .
The angiotensin-converting enzyme monocarboxipeptidase (ACE2), homologue of ACE, catalyzes the conversion of Ang II to angiotensin-(1-7) [Ang-(1-7)]. ACE2 can also cleave angiotensin I to the inactive nonapeptide angiotensin-(1-9), which in turn is cleaved by ACE to generate Ang-(1-7) [21] [22] . The proximal tubule cells express ACE2, where Ang-(1-7) is generated in quantities comparable to those of Ang II [22] . ACE2 expression is significantly decreased in the kidneys of patients with DN and/or hypertension, in turn resulting in Ang II increment and Ang-(1-7) reduction [23] . Ang-(1-7) effects are mediated by activation of the MAS receptor (MASR), which, are distinct and opposite to those mediated by Ang II via AT1R [24] . The main effects of Ang-(1-7) are vasodilation, modulation of oxidative stress, and anti-hypertrophic action [25] . Ang-(1-7) may counterbalance the effects of Ang II, and has a protective role in disorders mediated by RAS activation. The role of Ang-(1-7) in the progression of chronic kidney disease is still unclear [26] - [28] . This study was carried out to determine the role of exogenous Ang-(1-7) on renal hypertrophy development in STZ-induced diabetes.
2. Material and Methods
2.1. Animals and Treatment
In the present study, we used the well-established STZ-induced diabetes model. STZ destroys the pancreatic beta cells causing a state of insulin dependent diabetes. Male Wistar rats were obtained from the rat colony of the Facultad de Estudios Superiores Iztacala. Animals aged 10 weeks, with initial body weight of 250 ± 20 g were studied. Rats had free access to standard rat chow (Rodent Laboratory Chow 5001, Ralston Purina, Richmond Indiana, USA) and tap water, with 12 - 12 h light-dark cycles throughout the experiment. Diabetes was induced by a single STZ intraperitoneal (ip) injection (65 mg/kg of body weight) in 10 mM sodium citrate buffer, pH 4.5. Control (C) rats received vehicle (10 mM sodium citrate buffer, pH 4.5) alone. Forty-eight hours after STZ injection, blood glucose concentration was determined in tail vein blood samples using a reflectance meter (One Touch; LifeScan, Milpitas, CA, USA). Only animals with blood glucose levels >300 mg/dL were included in the study. Diabetic rats were randomized into three groups: 1) untreated diabetic rats (DM) receiving vehicle (saline solution), 2) diabetic rats treated with captopril, 10 mg/kg, po (DM + CAP), and 3) diabetic rats treated with Ang-(1-7), 100 µg/kg, ip [DM + Ang-(1-7)]. Once hyperglycemia with serum glucose levels ³ 300 mg/dl was confirmed, treatment with captopril or Ang-(1-7) was given daily during the 2 weeks of the experiment. Each group consisted of five animals. Two days before STZ injection and two days before the end of the experiment, the animals were placed in metabolic cages to measure food and water consumption, urinary volume, and to obtain urine samples to measure proteins and creatinine.
At the end of the study, the rats were anesthetized with sodium pentobarbital (45 mg/kg, ip). Blood samples were obtained to measure blood glucose and creatinine levels. Both kidneys were quickly removed. The left kidney was decapsulated, weighted, and dissected into cortex and medulla for total DNA and protein extraction, and immunoblot analysis. The right kidney was cannulated, and fixed with 4% formaldehyde. Animal care and procedures were performed in compliance with the Mexican Federal Regulations for Animals Investigation and Care (NOM-062 ZOO-1969, Ministry of Agriculture, Mexico), on care and use of laboratory animals, and the National Institutes of Health guide for the care and use of Laboratory animals (NIH Publications No. 8023, revised 1978). The protocol was approved by the institutional ethics review board.
2.2. Measurement of Renal Hypertrophy
Kidney weight/rat body weight ratio was used as a kidney hypertrophy index. The formaldehyde fixed right kidneys were dehydrated through ethanol graded series, embedded in paraffin, sectioned in 4 mm thick slices, mounted on glass slides and stained with hematoxylin-eosin (HE) and periodic acid-Schiff (PAS). Glomeruli and proximal tubular cells were visualized using an optic microscope and the areas were measured using a computer program (Motic Images Plus 2.0 ML, Richmond, British Columbia, Canada). For glomerular area, 50 consecutive glomeruli per rat were analyzed with 10× magnification. For proximal tubular cells area, 100 cells per field at 40× magnification were counted, and 10 fields per slide were analyzed and averaged. Finally, total DNA and protein from cortex tissue was extracted and quantified by Trizol reagent method (Invitrogen, Grand Island, New York, USA), and the protein/DNA ratio was calculated as an index of relative hypertrophy.
2.3. Analytical Methods
A 24 h urine sample was collected placing the animals in metabolic cages. Samples were immediately frozen and stored at −80˚C to measure proteins and creatinine. Protein concentration in urine was measured by the Bradford method (Bio-Rad), we used bovine serum albumin (BSA) (Sigma Chemical Co.) as standard, and creatinine was measured with Cayman reagents (Cayman Chemical, Ann Arbor, Michigan, USA). The protein/creatinine urinary excretion ratio was calculated.
2.4. Western Blotting
Renal tissue was homogenized in 100 mM Tris (hydroxymethyl-aminomethane-tris- hydrochloride, Sigma, St Louis, MO, USA), pH 7.4, incubated with a protease-inhibitor cocktail (Mini Complete EDTA-free protease inhibitor cocktail, Roche, Germany) and centrifuged at 10,000 g for ten min to remove insoluble debris. The protein concentration of the supernatant was quantified using the Bradford method. 50 mg of protein were loaded into a 10 % SDS-PAGE mini-gel under reducing conditions and transferred to polyvinylidene fluoride (PVDF) membranes (Amersham Hybond-ECL, GE Health Care, Buckinghamshire, UK). The membranes were blocked with 5% nonfat milk in Tris buffered saline (pH 7.6) containing 0.05% Tween 20 (TBST) for two hours at room temperature. Membranes were incubated for 16 h at 4˚C with a 1:400 dilution of a rabbit polyclonal antibody to AT1R, TGF-β1, ACE2 (Santa Cruz Biotechnology Inc., Santa Cruz, California, USA) and MASR respectively (Novus Biological, Littleton CO, USA). After incubation with the primary antibody, the membranes were washed with TBST buffer and incubated with a 1:1000 dilution of horseradish-peroxidase-labeled goat anti rabbit IgG secondary antibody (Zymed, Invitrogen, Grand Island, New York, USA) at room temperature for 2 hours. Visualization was performed with an enhanced chemiluminiscence (ECL) western blotting kit (Luminol, Santa Cruz Biotechnology Inc., Santa Cruz, California, USA). The obtained films were scanned and digitalized using a flatbed scanner. Band intensity was measured by computer analysis using Multi Gauge, Fuji Film Science, Lab2003 (Fuji Photo Film Co., LTD). All membranes were stripped, re-blocked and incubated with goat β-actin antibody (Santa Cruz Biotechnology Inc., Santa Cruz, California, USA) used as housekeeping protein with the same protocol.
2.5. Statistical Analysis
All values are presented as mean ± SEM, and compared by ANOVA followed by Newman-Keuls test. Differences were considered statistically significant with p values £0.05.
3. Results
3.1. Whole Animal Data
Table 1 shows whole animal data for C, DM, DM+CAP, and DM+Ang-(1-7) rats: glycemia, body weight, consumption of food and water and urinary volume. All STZ- induced diabetic rat groups had significant hyperglycemia (plasma glucose: DM, 450 ± 17.6 mg/dLvs control 115 ± 4.03 mg/dL, p < 0.05) at the time of experiment. In DM+ Ang-(1-7) and DM+CAP groups, glycemia did not differ from the DM group. Body weight was lower than that of the control group. Conversely, food and water consumption, and urinary volume were markedly increased in the 3 groups of diabetic animals.
3.2. Renal Hypertrophy
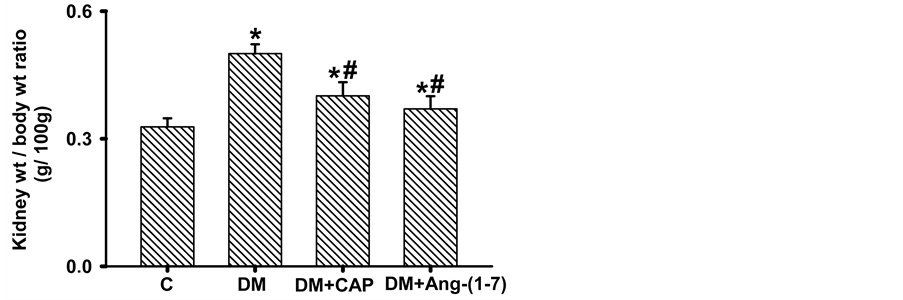
In Figure 1(a), kidney weight/body weight ratio is shown. In diabetic rats, kidney weight/body weight ratio is significantly increased as compared to the control group (C: 0.328 ± 0.02, DM: 0.50 ± 0.02 g); treatment with Ang-(1-7) reversed this increment (DM+Ang-(1-7): 0.379 ± 0.035 g), the kidney weight/body weight ratio in the animals treated with captopril did not reach a statistically significant difference with that of the DM group (DM + CAP: 0.401 ± 0.032, Figure 1(a)). Also, the protein/DNA ratio was significantly higher in DM than in C (C: 59.0 ± 6.71, DM: 132.7 ± 15.86 in arbitrary units), treatment with captopril or Ang-(1-7) reversed this increment (DM+CAP: 60.5 ± 6.8, DM+Ang-(1-7): 99.29 ± 6.8 in arbitrary units (Figure 1(b)).
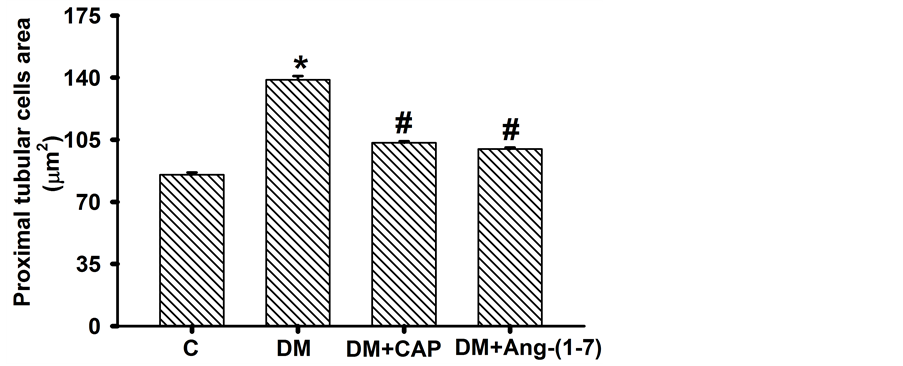
Figure 2 shows representative photomicrographs (magnification ×40) of kidney sections stained with H-E and PAS from all groups. The proximal tubules cellular area in

Table 1. Comparison of glycemia, body weight, water and food ingestion, and urinary volume in 4 groups of rats: control (C), untreated diabetes mellitus (DM), diabetes mellitus treated with captopril (DM+CAP), and diabetes mellitus treated with angiotensin-(1-7) [DM+Ang-(1-7)], after 2 weeks of treatment.
Data are expressed as mean ± SEM. *p < 0.05 vs. C.
 (a)
(a) (b)
(b)
Figure 1.Comparison of kidney weight/body weight ratio (a) and protein/DNA ratio (b), in rats groups after 2 weeks days of treatment. Data are expressed as mean ± SEM. *p < 0.05 vs. C, and #p < 0.05 vs. DM.
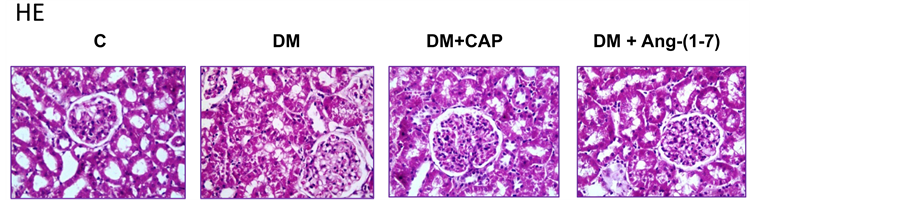

Figure 2. Representative photomicrographs (magnification ×40) of kidney sections stained with HE (upper panel) and PAS (lower panel) from rats set as follows: control (C), untreated diabetes mellitus (DM), diabetes mellitus treated with captopril (DM+CAP), and diabetes mellitus treated with angiotensin-(1-7) [DM+Ang-(1-7)].
the diabetic rats increased significantly as compared to the control group (C: 85.33 ± 1.15, DM: 138.76 ± 2.083 μm2). However, treatment with captopril or Ang-(1-7) reversed this increment (DM+CAP: 103.26 ± 0.85, and DM+Ang-(1-7): 99.739 ± 0.955 μm2 (Figure 3(a)). The glomerular area in the diabetic rats increased significantly as compared to the control group (C: 7448 ± 182, DM: 10266 ± 295 μm2, Figure 3(b)). However, treatment with captopril or Ang-(1-7) reversed this increment (DM+CAP: 8068 ± 164, and DM+Ang-(1-7): 7531 ± 203 μm2).
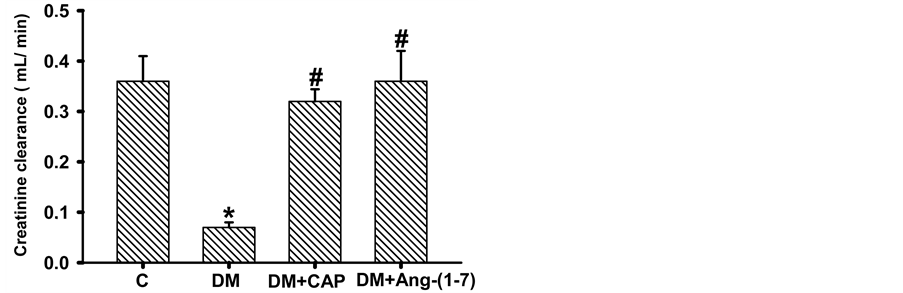
3.3. Proteinuria and Creatinine Clearance
Creatinine clearance in diabetic rats was significantly lower as compared to the control group (C: 0.36 ± 0.05, DM 0.07 ± 0.01 mL/min), treatment with captopril or Ang-(1-7) reversed this reduction (DM+CAP: 0.32 ± 0.124, DM+Ang-(1-7): 0.36 ± 0.06 mL/min) (Figure 4(a)). Proteinuria in the four studied groups is shown in Figure 4(b). Protein/
 (a)
(a)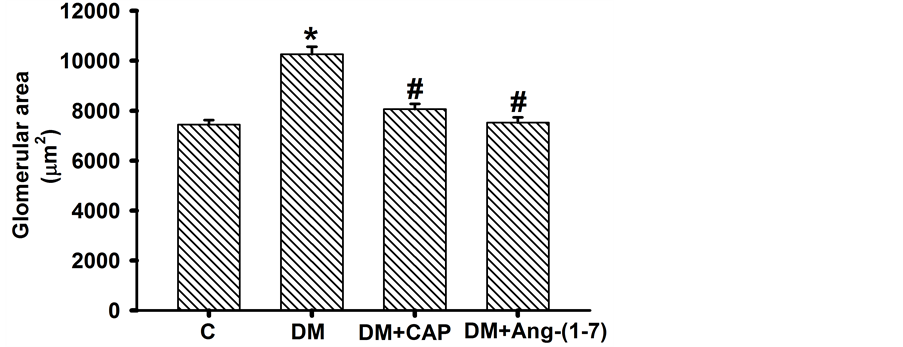 (b)
(b)
Figure 3. Comparison of proximal tubular cells area (A) and glomerular area (B) in groups of rats after 2 weeks of treatment. Data are expressed as mean ± SEM. *p < 0.05 vs. C, and #p < 0.05 vs. DM. Units = µm2.
 (a)
(a)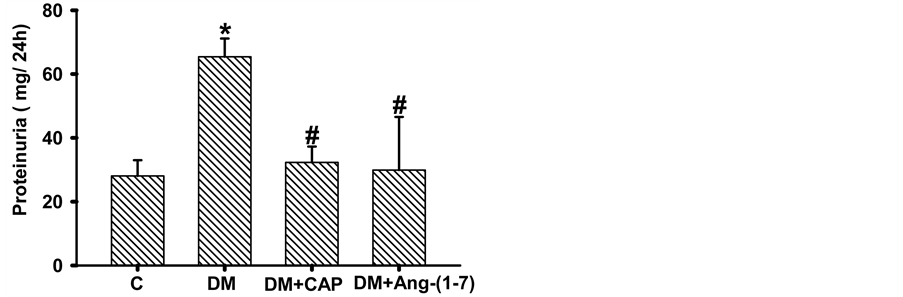 (b)
(b)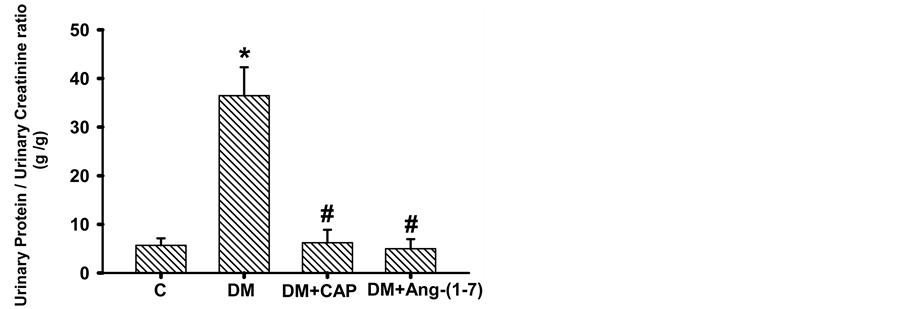 (c)
(c)
Figure 4. Comparison of creatinine clearance (A), proteinuria (B), and urinary protein/urinary creatinine ratio (C) in groups of rats: control (C), untreated diabetes mellitus (DM), diabetes mellitus treated with captopril (DM+CAP), and diabetes mellitus treated with angiotensin-(1-7) [DM+Ang-(1-7)], after 2 weeks of treatment. Data are expressed as mean ± SEM. *p < 0.05 vs. C, and #p < 0.05 vs. DM.
creatinine urinary excretion ratio in diabetic rats increased significantly as compared to the control group (C: 5.69 ± 1.43, DM: 36.47 ± 5.83 g/g), treatment with captopril or Ang-(1-7) reversed this increment (DM+CAP: 6.22 ± 2.67, DM+Ang-(1-7): 4.99 ± 1.96 g/g, Figure 4(c)).
3.4. Immunobloting
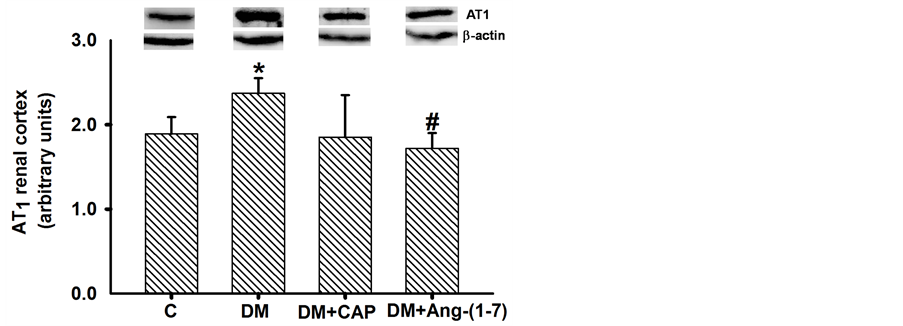
AT1R, TGF-β1, ACE2, and MASR protein expression in renal cortex homogenates were determined by western blot analysis and standardized with β-actin. AT1R protein expression in renal cortex of diabetic rats increased significantly as compared to control group; treatment with captopril or Ang-(1-7) reversed AT1R protein expression increment, but only treatment with Ang-(1-7) showed significant differences from that of diabetic rats (Figure 5(a)). Levels of TGF-β1 protein expression in the renal cortex of diabetic rats increased three-fold as compared to the control group. Treatments with Ang-(1-7) and captopril reversed this effect. Ang-(1-7) treatment reduced TGF-β1 protein expression to control values (Figure 5(b)). MAS receptor protein expression in renal cortex from diabetic rats was higher than that of the control group; treatment with captopril or Ang-(1-7) reversed this increment. Both treatments reduced MASR expression in renal cortex of diabetic rats, as compared to control group. This latter effect was more notorious in the DM+Ang-(1-7) group (Figure 6(a)). Finally, ACE2
 (a)
(a)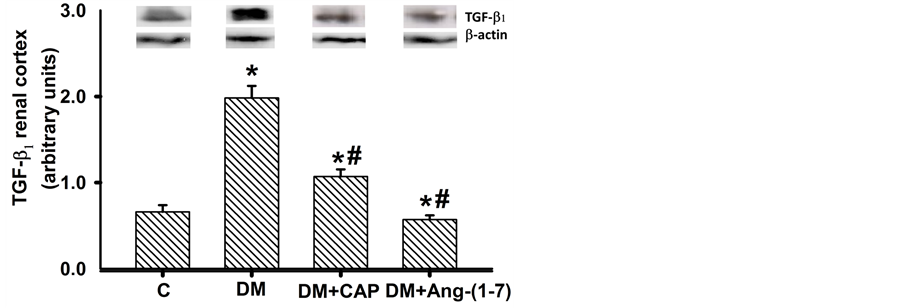 (b)
(b)
Figure 5. Comparison of AT1 receptor (a) and TGF-β1 (b) expression in renal cortex cells, in groups of rats: control (C), untreated diabetes mellitus (DM), diabetes mellitus treated with captopril (DM+CAP), and diabetes mellitus treated with angiotensin-(1-7) [DM+Ang-(1-7)], after 14 days of treatment. Representative western blots are shown in the inset. Data are expressed as mean ± SEM. *p < 0.05 vs. C, and #p < 0.05 vs. DM.
 (a)
(a)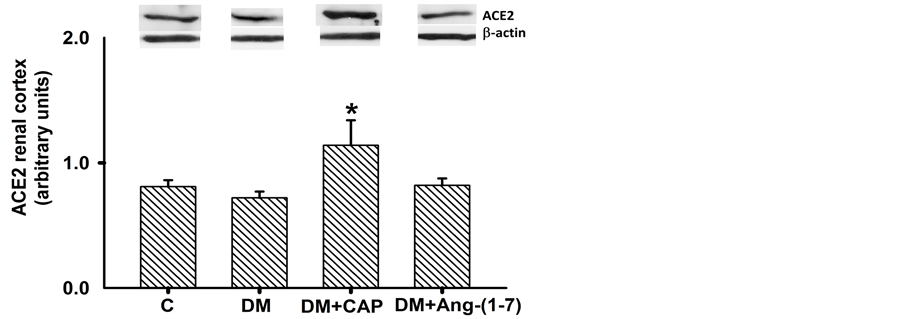 (b)
(b)
Figure 6. Comparison of MAS receptor (a) and ACE2 (b) expression in renal cortex cells, in groups of rats: control (C), untreated diabetes mellitus (DM), diabetes mellitus treated with captopril (DM+CAP), and diabetes mellitus treated with angiotensin-(1-7) [DM+Ang-(1-7)], after 14 days of treatment. Representative western blots are shown in the inset. Data are expressed as mean ± SEM. *p < 0.05 vs. C, and #p < 0.05 vs. DM.
protein expression in the renal cortex of control rats was not different from that of diabetic rats. Captopril increased ACE2 protein expression in the renal cortex. However, Ang-(1-7) did not modify the expression of the enzyme (Figure 6(b)).
4. Discussion
The earlier manifestations of renal injury produced by DM are structural changes consisting of tubuloepithelial and glomerular hypertrophy, followed by thickening of glomerular and tubular basement membranes and progressive accumulation of extracellular matrix proteins in the mesangium and interstitium. The structural changes start before any other measurable clinical changes are detectable (1-3). Among many factors reported to be involved in early diabetes renal hypertrophy, the RAS, through Ang II, participates in the generation of renal disturbances preceding the development of DN [29] [30] . Ang-(1-7) is synthetized directly by cleavage of Ang II by ACE2. Ang-(1-7) is produced in proximal tubular cells. Several studies have shown that Ang-(1-7) may limit the pressor and proliferative effects of Ang II in the progression of chronic kidney disease. Ang-(1-7) has a protective role in this setting, counterbalancing the effects of Ang II. Reportedly, Ang-(1-7) has an important role in cardiovascular alterations acting as an antiarrhythmic agent and protecting the myocardium from the consequences of cardiac injury-reperfusion [21] [31] . However, the effects of Ang-(1-7) on renal hypertrophy and DN [27] [32] are controversial. For that reason, the objective of this study was to examine whether exogenous Ang-(1-7) is capable of modifying the early renal hypertrophy development in STZ-induced diabetes in rats. STZ selectively destroys the b cells of the pancreatic islets of Langerhans trough DNA alkylation [33] . In this study, diabetes was induced by a single ip injection of STZ to create a diabetes model with pathological features similar to human diabetes [34] . The results showed that the ip daily administration of Ang-(1-7), 100 mg/kg for 2 weeks to rats after STZ-induced diabetes, attenuated the early renal damage associated to DN, evidenced by reduction of renal hypertrophy and proteinuria, and creatinine clearance improvement. The anti-hyper- trophic effect of Ang-(1-7) on rats with STZ-induced diabetes and renal injury was reflected by the reduction of kidney weight/body weight ratio, protein/DNA ratio, glomerular area, and proximal tubular cells area, occurring only 2 weeks after treatment with the heptapeptide. Moreover, the treatment with Ang-(1-7) improved the renal function since the urinary protein/creatinine ratio was reduced, and creatinine clearance increased. This was associated with less body weight reduction than that of untreated diabetic rats. In accordance with our results, it has been recently reported that treatment with Ang-(1-7) for a longer period (4 weeks) to rats with STZ-induced diabetes, reduced kidney hypertrophy, and improved renal function [28] . It has been demonstrated in LLC-PK1 proximal tubular cells incubated with high glucose that Ang-(1-7) activates tyrosine phosphatases, which in turn inhibit the mitogen-activated protein kinases (p38 MAPK) stimulated by high-glucose, thereby suppressing high- glucose-induced protein synthesis and hypertrophy [35] .
Furthermore, treatment with Ang-(1-7) reduced AT1R, TGF-β1, and MASR expression in renal cortex. Similar effects were produced by treatment with captopril. Treatment with Ang-(1-7) did not modify the expression of ACE2, and captopril produced a significant increment of the enzyme.
Numerous studies have demonstrated that Ang II induces renal hypertrophy and glomerulosclerosis by activation of its specific receptor AT1R [36] - [38] . High glucose concentration on cultured mesangial cells induces matrix protein synthesis and inhibition of proteolytic enzymes activity, such as plasmin and collagenase. These effects are similar to those produced by addition of Ang II to the culture medium [39] . High glucose concentration activates angiotensinogen gene expression in renal tubular cells, increasing Ang II production [40] . Moreover, administration of ATIR blockers or ACE inhibitors attenuates renal injury. Our results showed augmented expression of AT1R in diabetic rats, suggesting that induced diabetes stimulated its expression. It is described that 12-lipooxigenase (12-LO) pathway in glomerular cells in vitro and glomeruli in vivo, is activated in diabetes, and up-regulates AT1R, thus magnifying Ang II effects and leading to DN [41] . Treatment with captopril and/or Ang-(1-7) decreased ATIR expression and also its hypertrophic effect.
Reportedly, TGF-β1 promotes the progression of renal fibrosis and acts as a major mediator of hypertrophic and prosclerotic changes in DN [20] . It interferes with the normal cell cycle regulation by inducing cyclin-dependent kinase inhibitors. The cell enters in a period of protein synthesis without DNA replication and undergoes hypertrophy [42] . It is also known that Ang II-induced hypertrophy may be mediated by stimulation, production and secretion of TGF-β1 [7] [38] . In this study we observed a positive correlation between the increment of the AT1R expression and increment of TGF-β1 in the renal cortex of diabetic rats. Exogenous Ang-(1-7) significantly reduced expression of both proteins, which could explain the reduction of the hypertrophic changes. A similar effect was observed with the captopril treatment. These results show that in the early development of DN in STZ-induced diabetes, Ang II-stimulated TGF-β1 may account for the hypertrophic response, and the Ang-(1-7) inhibitory effect upon it, attenuate renal injury. Previous studies have shown that MAPKs are important intracellular mediators for cell growth and differentiation, survival, and cell death. This signaling pathway, activated by Ang II, is stimulated in STZ-induced diabetes in rats, and is capable of inducing TGF-β1 synthesis [43] [44] . Ang-(1-7) by interaction with its specific receptor MAS, activates tyrosine phosphatase activity and inhibits p38 MAPK, thereby partially suppressing TGF-β1 expression in proximal tubular cells. A779, a specific MASR antagonist, blocks this Ang-(1-7) effect [43] . A similar effect was obtained with captopril, suggesting an increment in Ang-(1-7), by angiotensin I cleavage.
Our results suggest that treatment with Ang-(1-7) may exert a beneficial effect on the progression of DN, beyond reducing proteinuria and increasing creatinine clearance. In db/db mice Ang II induced oxidative stress and kidney inflammation through AT1R. Ang-(1-7) treatment for 28 days reduced ROS and lipid deposition through NADPH oxidase inhibition, decreasing the inflammatory response [45] . The transduction pathway of Ang-(1-7) has not been completely elucidated, but there are reports of the inhibitory effects of Ang-(1-7) on kidney hypertrophy. For instance, in a rat kidney cell line, it has been demonstrated that Ang-(1-7) may inhibit ERK 1-2 expression and function, in a similar way than TGF-β1 blockade [46] . In diabetic rats, MASR activation with Ang-(1-7) decreases collagen IV, TGF-β1, VEGF, NOX4, p47 phox, PKCα, and PKCβ1 expression, and Smad3 phosphorylation, suggesting that Ang-(1-7) treatment may have beneficial effects on the progression and treatment of DN [28] [35] [44] [46] .
ACE2 is expressed in the kidney and it mediates conversion of Ang II to Ang-(1-7). The synthesis of Ang-(1-9) from Ang I and the catabolism of Ang II to produce Ang- (1-7). Classic ACE inhibitors do not inhibit this effect. Ang-(1-7) binds to the MASR and counteracts the effects of Ang II in DN [47] . Previous studies have shown high levels of both enzymes, ACE and ACE2, in proximal tubule cells, they have also shown that ACE2 expression is reduced in experimental DN [47] [48] . It has been reported that ACE2 loss accelerates glomerular and tubulointerstitial damage in STZ-induced diabetic mice [49] . Moreover, in NRK-52E renal cells incubated with high glucose, ACE2 expression increased at 8 - 24 h and decreased at 72 h [49] . ACE2 kidney expression is down-regulated in models of diabetic mice and in diabetic patients [51] [52] . Treatment with the ACE2 inhibitor, MLN-4760, in db/db diabetic mice caused increased proteinuria, effect reverted by AT1R blockers [51] . We found that ACE2 expression decreased in diabetic rats as compared to control rats, showing an opposite correlation between the TGF-β1 expression and the ACE2 expression. The mechanism of ACE2 deficiency in DN is not well known, however, is likely that an interaction between ACE2 and TGF-β1 could exist.
These results are similar with those found in NRK-52E cells incubated with high glucose for 24 - 72 h. ACE2 and MASR expression were decreased while TGF-β1 expression was increased [50] . In this work, Ang-(1-7) administration did not modify ACE2 expression, however, captopril significantly increased it, which is in accordance with several reports, where administration of ACE inhibitors and AT1R blockers causes substantial increases in plasma Ang-(1-7) levels and ACE2 expression [53] [54] .
5. Conclusion
The results suggest that early exogenous administration of Ang-(1-7) may reduce renal hypertrophy by regulating the activity of TGF-β1 in the proximal tubule, indicating the importance of the ACE2-Ang-(1-7)-MAS receptor axis, and its potential renoprotective effect in early stages of DN.
Acknowledgements
This study was supported by the Universidad Nacional Autónoma de México, UNAM (grants PAPCA 2011, and DGAPA-PAPIIT IN210307).
Conflict of Interests
The authors declare that there is no conflict of interests regarding the publication of this paper.
Cite this paper
Amato, D., Núñez- Ortiz, A.R., del Carmen Benítez-Flores, J., Segura-Cobos, D., López-Sánchez, P. and Vázquez-Cruz, B. (2016) Role of Angiotensin-(1-7) on Renal Hypertrophy in Streptozotocin-Induced Diabetes Mellitus. Pharmacology & Pharmacy, 7, 379-395. http://dx.doi.org/10.4236/pp.2016.79046
References
- 1. Vinod, P.B. (2012) Pathophysiology of Diabetic Nephropathy. Clinical Queries: Nephrology, 1, 112-126.
http://dx.doi.org/10.1016/s2211-9477(12)70005-5 - 2. Dronavalli, S., Duka, I. and Bakris, L.G. (2008) The Pathogenesis of Diabetic Nephropathy. Nature Clinical Practice, 4, 444-452.
http://dx.doi.org/10.1038/ncpendmet0894 - 3. Ziyadeh, F.N. (1993) The Extracellular Matrix in Diabetic Nephropathy. American Journal of Kidney Diseases, 22, 736-744.
http://dx.doi.org/10.1016/S0272-6386(12)80440-9 - 4. O’Bryan, G.T. and Hostetter, T.H. (1997) The Renal Hemodynamic Basis of Diabetic Nephropathy. Seminars in Nephrology, 17, 93-100.
- 5. Thomson, S., Vallon, V. and Blantz, R.C. (2004) Kidney Function in Early Diabetes: The Tubular Hypothesis of Glomerular Filtration. American Journal of Physiology-Renal Physiology, 286, F8-F15.
http://dx.doi.org/10.1152/ajprenal.00208.2003 - 6. Satriano, J. and Vallon, V. (2006) Primary Kidney Growth and Its Consequences at the Onset of Diabetes Mellitus. Amino Acids, 31, 1-9.
http://dx.doi.org/10.1007/s00726-006-0326-x - 7. Ziyadeh, F.N. (2004) Mediators of Diabetic Renal Disease: The Case for TGF-β as the Major Mediator. Journal of the American Society of Nephrology, 15, S55-S57.
http://dx.doi.org/10.1097/01.asn.0000093460.24823.5b - 8. Wolf, G. and Ziyadeh, F.N. (1999) Molecular Mechanism of Diabetic Renal Hypertrophy. Kidney International, 56, 393-405.
http://dx.doi.org/10.1046/j.1523-1755.1999.00590.x - 9. Bak, M., Thomsen, K., Christiansen, T. and Flyvbjerg, A. (2000) Renal Enlargement Precedes Renal Hyperfiltration in Early Experimental Diabetes in Rats. Journal of the American Society of Nephrology, 11, 1287-1292.
- 10. Ziyadeh, F.N. and Wolf, G. (2008) Pathogenesis of the Podocytopathy and Proteinuria in Diabetic Glomerulopathy. Current Diabetes Reviews, 4, 39-45.
http://dx.doi.org/10.2174/157339908783502370 - 11. Vallon, V., Blantz, R.C. and Thomson, S.C. (2003) Glomerular Hyperfiltration and the Salt Paradox in Early Type 1 Diabetes Mellitus: A Tubule-Centric View. Journal of the American Society of Nephrology, 14, 530-537.
http://dx.doi.org/10.1097/01.ASN.0000051700.07403.27 - 12. Kabori, H., Nangaku, M., Navar, L.G. and Nishiyama, A. (2007) The Intrarenal Renin-Angiotensin System: From Physiology to the Pathobiology of Hypertension and Kidney Disease. Pharmacological Reviews, 59, 251-287.
http://dx.doi.org/10.1124/pr.59.3.3 - 13. Lewis, E.J., Hunsicker, L.G., Bain, R.P. and Rhode, R.D. (1993) The Effect of Angiotensin-Converting Enzyme Inhibition on Diabetic Nephropathy. New England Journal of Medicine, 329, 1456-1462.
http://dx.doi.org/10.1056/NEJM199311113292004 - 14. Brenner, B.M., Cooper, M.E., de Zeeuw, D., Keane, W.F., Mitch, W.E., Parving, H.H., Remuzzi, G., Snapinn, S.M., Zhang, Z. and Shahinfar, S. (2001) Effects of Losartan on Renal and Cardiovascular Outcomes in Patients with Type 2 Diabetes and Nephropathy. New England Journal of Medicine, 345, 861-869.
http://dx.doi.org/10.1056/NEJMoa011161 - 15. Taal, M.W. and Brenner, B.M. (2000) Renoprotective Benefits of RAS Inhibition: From ACEI to Angiotensin II Antagonists. Kidney International, 57, 1803-1817.
http://dx.doi.org/10.1046/j.1523-1755.2000.00031.x - 16. Zimpelmann, J., Kumar, D., Levine, Z.D., Wehbi, G., Imig, D.J., Navar, L.G. and Burns, D.K. (2000) Early Diabetes Mellitus Proximal Tubule Renin mRNA Expression in the Rat. Kidney International, 58, 2320-2330.
http://dx.doi.org/10.1046/j.1523-1755.2000.00416.x - 17. Kagami, S., Border, W.A., Miller, D.E. and Noble, N.A. (1994) Angiotensin II Stimulates Extracellular Matrix Protein Synthesis through Induction of Transforming Growth Factor-β Expression in Rat Glomerular Mesangial Cells. Journal of Clinical Investigation, 93, 2431-2437.
http://dx.doi.org/10.1172/JCI117251 - 18. Nakamura, S., Nakamura, I., Ma, L.J., Vaughan, D.E. and Fogo, A. (2000) Plasminogen Activator Inhibitor-1 Expression Is Regulated by the Angiotensin Type 1 Receptor in Vivo. Kidney International, 58, 251-259.
http://dx.doi.org/10.1046/j.1523-1755.2000.00160.x - 19. Kagami, S., Kuhara, T., Okada, K., Kuroda, Y., Border, W.A. and Noble, A.(1997) Dual Effects of Angiotensin II on the Plasminogen/Plasmin System in Rat Mesangial Cells. Kidney International, 51, 664-667.
http://dx.doi.org/10.1038/ki.1997.96 - 20. Jiao, B., Wang, Y.S., Cheng, Y.N., Gao, J.J. and Zhang, Q.Z. (2011) Valsartan Attenuated Oxidative Stress, Decreased MCP-1 and TGF-β1 Expression in Glomerular Mesangial and Epithelial Cells Induced by High-Glucose Levels. Bioscience Trends, 4, 173-181.
http://dx.doi.org/10.5582/bst.2011.v5.4.173 - 21. Ferrario, M.C., Trask, A.J. and Jessup, J.A. (2005) Advances in Biochemical and Functional Roles of Angiotensin-Converting Enzyme 2 and Angiotensin-(1-7) in Regulation of Cardiovascular Function. American Journal of Physiology-Heart and Circulatory Physiology, 289, H2281-H2290.
http://dx.doi.org/10.1152/ajpheart.00618.2005 - 22. Dilauro, M. and Burns, D.K. (2009) Angiotensin-(1-7) and Its Effects in the Kidney. The Scientific World Journal, 9, 522-535.
http://dx.doi.org/10.1100/tsw.2009.70 - 23. Brant-Pinheiro, S.V. and Simoes e Silva, A.C. (2012) Angiotensin Converting Enzyme 2, Angiotensin-(1-7), and Receptor Mas Axis in the Kidney. International Journal of Hypertension, 2012, Article ID: 414128.
- 24. Santos, R.A.S., Ferreira, A.J. and Simoes e Silva, A.C. (2008) Recent Advances in the Angiotensin-Converting Enzyme 2-Angiotensin (1-7)-Mas Axis. Experimental Physiology, 93, 519-527.
http://dx.doi.org/10.1113/expphysiol.2008.042002 - 25. Moon, J.Y. (2011) ACE-2 and Angiotensin-(1-7) in Hypertensive Renal Disease. Electrolytes & Blood Pressure, 9, 41-44.
http://dx.doi.org/10.5049/EBP.2011.9.2.41 - 26. Benter, I.F., Yousif, M.H., Dhaunsi, G.S., Kaur, J., Chappell, M.C. and Diz, D.L. (2008) Angiotensin-(1-7) Prevents Activation of NADPH Oxidase and Renal Vascular Dysfunction in Diabetic Hypertensive Rats. American Journal of Nephrology, 28, 25-33.
http://dx.doi.org/10.1159/000108758 - 27. Shao, Y., He, M., Zhou, L., Yao, T., Huang, Y. and Lu, L. (2008) Chronic Angiotensin (1-7) Injection Accelerates STZ-Induced Diabetic Renal Injury. Acta Pharmacologica Sinica, 29, 829-837.
http://dx.doi.org/10.1111/j.1745-7254.2008.00812.x - 28. Zhang, K., Meng, X., Li, D., Yang, J., Kong, J., Hao, P., Guo, T., Zhang, M., Zhang, Y. and Zhang, C. (2015) Angiotensin (1-7) Attenuates the Progression of Streptozotocin-Induced Diabetic Renal Injury Better than Angiotensin Receptor Blockade. Kidney International, 87, 359-369.
http://dx.doi.org/10.1038/ki.2014.274 - 29. Chawla, T., Sharma, D. and Singh, A. (2010) Role of the Renin Angiotensin System in Diabetic Nephropathy. World Journal of Diabetes, 1, 141-145.
http://dx.doi.org/10.4239/wjd.v1.i5.141 - 30. Balakumar, P., Arora, M.K., Ganti, S.S., Reddy, J. and Singh, M. (2009) Recent Advances in Pharmacotherapy for Diabetic Nephropathy: Current Perspectives and Future Directions. Pharmacological Research, 60, 24-32.
http://dx.doi.org/10.1016/j.phrs.2009.02.002 - 31. Benter, I.F., Yousif, M.H., Cojocel, C., Al-Maghrebi, M. and Diz, D.I. (2007) Angiotensin-(1-7) Prevents Diabetes-Induced Cardiovascular Dysfunction. American Journal of Physiology-Heart and Circulatory Physiology, 292, H666-H672.
http://dx.doi.org/10.1152/ajpheart.00372.2006 - 32. Zimmerman, D. and Burns, K.D. (2012) Angiotensin-(1-7) in Kidney Disease: A Review of the Controversies. Clinical Science, 123, 333-346.
http://dx.doi.org/10.1042/CS20120111 - 33. Szkudelski, T. (2001) The Mechanism of Alloxan and Streptozotocin Action in B Cells of the Rat Pancreas. Physiological Research, 50, 537-546.
- 34. Lenzen, S. (2008) The Mechanism of Alloxan- and Streptozotocin-Induced Diabetes. Diabetologia, 51, 216-226.
http://dx.doi.org/10.1007/s00125-007-0886-7 - 35. Gava, E., Samad-Zadeh, A., Zimpelmann, J., Bahramifarid, N., Kitten, G.T., Santos, R.A., Touyz, R.M. and Burns, K.D. (2009) Angiotensin-(1-7) Activates a Tyrosine Phosphatase and Inhibits Glucose-Induced Signaling in Proximal Tubular Cells. Nephrology Dialysis Transplantation, 24, 1766–1773.
http://dx.doi.org/10.1093/ndt/gfn736 - 36. Remuzzi, A., Perico, N., Amuchastegui, C.S., Malanchini, B., Mazerska, M., Battaglia, C., Bertani, V. and Remuzzi, G. (1993) Short- and Long-Term Effect of Angiotensin II Receptor Blockade in Rats with Experimental Diabetes. Journal of the American Society of Nephrology, 4, 40-49.
- 37. Burns, K.D. (2000) Angiotensin II and Its Receptors in the Diabetic Kidney. American Journal of Kidney Diseases, 36, 449-467.
http://dx.doi.org/10.1053/ajkd.2000.16192 - 38. Singh, R., Alavi, N., Singh, A.K. and Leehey, D.J. (1999) Role of Angiotensin II in Glucose-Induced Inhibition of Mesangial Matrix Degradation. Diabetes, 48, 2066-2070.
http://dx.doi.org/10.2337/diabetes.48.10.2066 - 39. Wolf, G., Mueller, E., Stahl, R.A.K. and Ziyadeh, F.N. (1993) Angiotensin II-Induced Hypertrophy of Cultured Murine Proximal Tubular Cells Is Mediated by Endogenous Transforming Growth Factor-β. Journal of Clinical Investigation, 92, 1366-1372.
http://dx.doi.org/10.1172/JCI116710 - 40. Leehey, D.J., Singh, A.K., Alavi, N. and Singh, R. (2000) Role of Angiotensin II in Diabetic Nephropathy. Kidney International Supplements, 77, S93-S98.
http://dx.doi.org/10.1046/j.1523-1755.2000.07715.x - 41. Xu, Z.G., Miao, L.N., Cui, Y.C., Jia, Y., Yuan, H. and Wu, M. (2009) Angiotensin II Type 1 Receptor Expression Is Increased via 12-Lipoxygenase in High Glucose-Stimulated Glomerular Cells and Type 2 Diabetic Glomeruli. Nephrology Dialysis Transplantation, 24, 1744-1752.
http://dx.doi.org/10.1093/ndt/gfn703 - 42. Satriano, J. (2007) Kidney Growth, Hypertrophy and the Unifying Mechanism of Diabetic Complications. Amino Acids, 33, 331-339.
http://dx.doi.org/10.1007/s00726-007-0529-9 - 43. Wang, T., Chen, S.S., Chen, R., Yu, D.M. and Yu, P. (2015) Reduced Beta 2 Glycoprotein I Improves Diabetic Nephropathy via Inhibiting TGF-β1-p38 MAPK Pathway. International Journal of Clinical and Experimental Pathology, 8, 2321-2333.
- 44. Su, Z., Zimpelmann, J. and Burns, K.D. (2006) Angiotensin-(1-7) Inhibits Angiotensin II-Stimulated Phosphorylation of MAP Kinases in Proximal Tubular Cells. Kidney International, 69, 2212-2218.
http://dx.doi.org/10.1038/sj.ki.5001509 - 45. Mori, J., Patel, V.B., Ramprasath, T., Alrob, O.A., Aulniers, J.D., Scholey, J.W., Lopaschuk, G.D. and Oudit, G.Y. (2014) Angiotensin 1–7 Mediates Renoprotection against Diabetic Nephropathy by Reducing Oxidative Stress, Inflammation, Andlipotoxicity. American Journal of Physiology-Renal Physiology, 306, F812-F821.
http://dx.doi.org/10.1152/ajprenal.00655.2013 - 46. Alzayadneh, E.M. and Chappell, M.C. (2014) Angiotensin-(1-7) Abolishes AGE-Induced Cellular Hypertrophy and Myofibroblast Transformation via Inhibition of ERK1/2. Cell Signal, 26, 3027-3035.
http://dx.doi.org/10.1016/j.cellsig.2014.09.010 - 47. Ye, M., Wysocki, J., Naaz, P., Salabat, M.R., La Pointe, M.S. and Batlle, D. (2004) Increased ACE2 and Decreased ACE Protein in Renal Tubules from Diabetic Mice: A Renoprotective Combination? Hypertension, 43, 1120-1125.
http://dx.doi.org/10.1161/01.HYP.0000126192.27644.76 - 48. Tikellis, C., Johnston, C.I., Forbes, J.M., Burns, W.C., Burrell, L.M., Risvanis, J. and Cooper, M.E. (2003) Characterization of Renal Angiotensin-Converting Enzyme 2 in Diabetic Nephropathy. Hypertension, 41, 392-397.
http://dx.doi.org/10.1161/01.HYP.0000060689.38912.CB - 49. Shiota, A., Yamamoto, K., Ohishi, M., Tatara, Y., Ohnishi, M., Maekawa, Y., Iwamoto, Y., Takeda, M. and Rakugi, H. (2010) Loss of ACE2 Accelerates Time-Dependent Glomerular and Tubulointerstitial Damage in Streptozotocin-Induced Diabetic Mice. Hypertension Research, 33, 298-307.
http://dx.doi.org/10.1038/hr.2009.231 - 50. Chou, C.H., Chuang, L.Y., Lu, C.Y. and Guh, J.Y. (2013) Interaction between TGF-β and ACE2-Ang-(1-7)-Mas Pathway in High Glucose-Cultured NRK-52E Cells. Molecular and Cellular Endocrinology, 366, 21-30.
http://dx.doi.org/10.1016/j.mce.2012.11.004 - 51. Ye, M., Wysocki, J., William, J., Soler, M.J., Cokie, I. and Batlle, D. (2006) Glomerular Localization and Expression of Angiotensin-Converting Enzyme 2 and Angiotensin-Converting Enzyme: Implications for Albuminuria in Diabetes. Journal of the American Society of Nephrology, 17, 3067-3075.
http://dx.doi.org/10.1681/ASN.2006050423 - 52. Reich, H.N., Oudit, G.Y., Penninger, J.M., Scholey, J.W. and Herzenberg, A.M. (2008) Decreased Glomerular and Tubular Expression of ECA2 in Patients with Type 2 Diabetes and Kidney Disease. Kidney International, 74, 1610-1616.
http://dx.doi.org/10.1038/ki.2008.497 - 53. Iyer, S.N., Ferrario, C.M. and Chappell, M.C. (1998) Angiotensin-(1-7) Contributes to the Antihypertensive Effects of Blockade of the Renin-Angiotensin System. Hypertension, 31, 356-361.
http://dx.doi.org/10.1161/01.HYP.31.1.356 - 54. Sukumaran, V., Veeraveedu, P.T., Gurusamy, N., Yamaguchi, K., Lakshmanan, A.P., Ma M., Suzuki, K., Kodama, M. and Watanabe, K.(2011) Cardioprotective Effects of Telmisartan against Heart Failure in Rats Induced by Experimental Autoimmune Myocarditis through the Modulation of Angiotensin-Converting Enzyme-2/Angiotensin 1-7/Mas Receptor Axis. International Journal of Biological Sciences, 7, 1077-1092.
http://dx.doi.org/10.7150/ijbs.7.1077