Open Journal of Applied Biosensor
Vol. 2 No. 4 (2013) , Article ID: 39759 , 7 pages DOI:10.4236/ojab.2013.24013
QCM Aptasensor for Rapid and Specific Detection of Avian Influenza Virus
1Department of Biological and Agricultural Engineering, University of Arkansas, Fayetteville, USA
2Center of Excellence for Poultry Science, University of Arkansas, Fayetteville, USA
3Cell and Molecular Biology Program, University of Arkansas, Fayetteville, USA
Email: *yanbinli@uark.edu
Copyright © 2013 Luke Brockman et al. This is an open access article distributed under the Creative Commons Attribution License, which permits unrestricted use, distribution, and reproduction in any medium, provided the original work is properly cited.
Received February 1, 2013; revised March 18, 2013; accepted April 6, 2013
Keywords: Aptasensor; Avian Influenza; QCM; Aptamer; Nanobeads
ABSTRACT
There has been a need for rapid detection of Avian Influenza virus (AIV) H5N1 due to it being a potential pandemic threat. Most of the current methods, including culture isolation and PCR, are very sensitive and specific but require specialized laboratories and trained personnel in order to complete the tests and are time-consuming. The goal of this study was to design a biosensor that would be able to rapidly detect AIV H5N1 using aptamers as biosensing material and a quartz crystal microbalance (QCM) for transducing method. Specific DNA aptamers against AIV H5N1 were immobilized, through biotin and streptavidin conjugation, onto the gold surface of QCM sensor to capture the target virus. Magnetic nanobeads (150 nm in diameter) were then added as amplifiers considering its large surface/volume ratio which allows for faster movement and a higher target molecule binding rate. The result showed that the captured AIV caused frequency change, and more change was observed when the AIV concentration increased. The nanobead amplification was effective at the lower concentrations of AIV, however, it was not significant when the AIV concentration was 1 HA or higher. The detection limit of the aptasensor was 1 HAU with a detection time of 1 h. The capture of the target virus on to the surface of QCM sensor and the binding of magnetic nanobeads with the virus was confirmed with electron microscopy. Aptamers have unlimited shelf life and are temperature stable which allows this aptasensor to give much more consistent results specifically for in field applications.
1. Introduction
H5N1 is a highly pathogenic subtype of avian influenza virus (AIV), influenza A virus. Since 2003, there have been reported 615 human cases of avian influenza H5N1 resulting in 364 deaths [1]. It is estimated that H5N1 has already cost the poultry industry over $10 billion and the World Bank has estimated that a severe human outbreak would cost upwards of $3 trillion to the global economy [2]. These threats are why a sensitive, rapid detection method is needed.
The current gold standards for avian influenza detection are viral isolation cultures and real-time RT-PCR. They both provide high sensitivity but are time consuming, expensive, and require special training and facilities [3,4]. Rapid techniques for the detection of avian influenza, such as ELISA and immunochromatographic strips, lack sensitivity, specificity, and can have high false positive rates [5].
As an alternative to these methods, biosensors have been studied for the detection of avian influenza virus. Biosensors, which combine a biological sensing element, a transducer, and a signal processing unit, have shown a lot of promise for rapid detection of virus [5]. Surface plasmon resonance (SPR) [6,7], optical interferometry [8], and impedance [9,10] are a few of the more popular biosensors being researched today. However, many of them still lack the sensitivity and specificity required and are not ready for in-field use.
Quartz crystal microbalance (QCM) has been gaining popularity due to its simplicity and cost effectiveness [11]. The QCM biosensor is based on the piezoelectric properties of a quartz crystal wafer. When an electric field is applied across the electrode an inverse piezoelectric effect occurs, causing deformation of the crystal. The change of the resonant frequency of the crystal is attributed to a change in mass on the electrode surface [12]. For gas-phase measurement, the relationship between the frequency change ( ) and mass change (
 ) of the crystal is expressed by the Sauerbrey equation [13]:
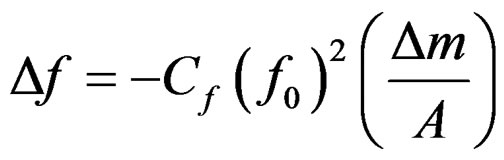 (1)
(1)
where A is the electrode area,  is the resonant frequency and
  is the sensitivity factor for the crystal. For liquid-phase measurement, a most commonly used model was by Kananzawa and Gordon [14] as follows:
 (2)
(2)
where h is the thickness of the quartz crystal,  is the density of the quartz,
  is the resonance frequency due to the added mass, and
  ,
,  , and
, and ![]() are density, magnitude of the complex viscosity, and relative phase angle of the liquid medium, respectively. While rapid and easy to use, the QCM biosensor still lacks the sensitivity needed to be considered an effective detection method for avian influenza virus. There have been a few previous studies using the QCM to rapidly detect AIV and that use nanoparticle amplification. Liu et al. [15] used the QCM to detect E. coli O157:H7 while also comparing different nanobead sizes for amplification. Hewa et al. [16] was able to use the QCM to detect influenza virus. Li et al. [17] was able to successfully detect H5N1 using nanobead amplification. Owen et al. [18] used aerosolized influenza virus with the QCM and successfully detected down to 4 virus particles/ml in a gas media. Most recently, Wang and Li [19] developed a hydrogel based QCM aptasensor to greatly reduce their detection limit down to 0.0128 HAU. Improvements can still be made not only in the sensitivity and specificity of these tests but in the detection time as well.
are density, magnitude of the complex viscosity, and relative phase angle of the liquid medium, respectively. While rapid and easy to use, the QCM biosensor still lacks the sensitivity needed to be considered an effective detection method for avian influenza virus. There have been a few previous studies using the QCM to rapidly detect AIV and that use nanoparticle amplification. Liu et al. [15] used the QCM to detect E. coli O157:H7 while also comparing different nanobead sizes for amplification. Hewa et al. [16] was able to use the QCM to detect influenza virus. Li et al. [17] was able to successfully detect H5N1 using nanobead amplification. Owen et al. [18] used aerosolized influenza virus with the QCM and successfully detected down to 4 virus particles/ml in a gas media. Most recently, Wang and Li [19] developed a hydrogel based QCM aptasensor to greatly reduce their detection limit down to 0.0128 HAU. Improvements can still be made not only in the sensitivity and specificity of these tests but in the detection time as well.
Aptamers are artificially created single-stranded oligonucleotides that have the ability to bind to targets such as amino acids, drugs, proteins, cells, and viruses with high affinity and specificity [20]. They are selected through an in vitro process from random oligonucleotide pools called Systematic Evolution of Ligands by Exponential enrichment (SELEX) [21,22]. Aptamers show a very high affinity to their targets, comparable to those of monoclonal antibodies [23]. Aptamers can provide a number of advantages over antibodies, namely the ease at which they are designed and modified, higher thermal stability, and a much longer shelf life [24]. In order to improve the sensitivity and specificity of the QCM biosensors, aptamers were considered by some researchers. Bai et al. [7] used an aptamer based SPR biosensor for the detection of AIV H5N1 and successfully detected down to 0.128 HAU. As previously mentioned, Wang and Li [19] developed a hydrogel based QCM aptasensor for the detection of AIV H5N1. Cui et al. [25] was able to use aptamers specifically as a labeling technique for quantum dots against Influenza A particles.
In this study, we describe an improved QCM aptasensor for the detection of AIV H5N1. Aptamers were used with the advantage of being much more consistent and stable compared to antibodies while still maintaining a strong binding affinity to the target virus. Aptamer-labeled 150 nm nanobeads were used as biolabels and mass amplifiers to increase the sensitivity of the system.
2. Materials and Methods
2.1. Biological and Chemical Reagents
Phosphate buffered saline (PBS, 10X) was purchased from Sigma-Aldrich (St. Louis, MO) and diluted with Milli-Q (Mill-Q, Bedford, MA) water to 10 mM (pH 7.4) for use in all tests. Poly (ethylene glycol) methyl ether thiol (PEG) was purchased from Sigma-Aldrich (St. Louis, MO). PEG was dissolved in 10 mM PBS to a concentration of 0.1 mg/ml and prepared fresh for each test. Streptavidin was purchased from Rockland Inc. (Gilbertsville, PA). It was reconstituted in 10 mM PBS and stored in 1 mg/ml aliquots at −20˚C. The streptavidin was diluted to 0.25 mg/ml for use in tests. All water used in tests was obtained from a Millipore water purification system (Mill-Q, Bedford, MA).
2.2. Virus and Aptamers
Inactivated avian influenza A/H5N1 virus was obtained from the USDA/National Veterinary Services Laboratory in Ames, Iowa. The virus was inactivated by the USDA lab using β-propiolactone. The H5N1 virus used in the tests was isolated from chickens in Scotland in 1959. The stock concentration of the virus was 128 HAU. All dilutions were done using PBS. Killed AIV H7N2, H9N2, H5N9, H5N2, and H5N3 were obtained from Animal Diagnostic Laboratory at Penn State University (University Park, PA).
The H5N1 aptamer (73 nucleotides; 5’-GTGTGCATGGATAGCACGTAACGGTGTAGTAG-ATACGT-GCGGGTAGGAAGAAAGGGAAATAGTTGTCCTGTTG-3’) was previously developed in our laboratory through the SELEX method [19]. The aptamer was synthesized and biotin labeled by Integrated DNA Technologies (Coralville, IA). The aptamer was aliquoted and stored at −20˚C. The aliquots were diluted using PBS to a working concentration of 0.023 mg/ml (1 µM).
2.3. Instruments and Electrodes
Figure 1 shows the general aptasensor set up. All measurements were taken with the QCA 922 Quartz Crystal
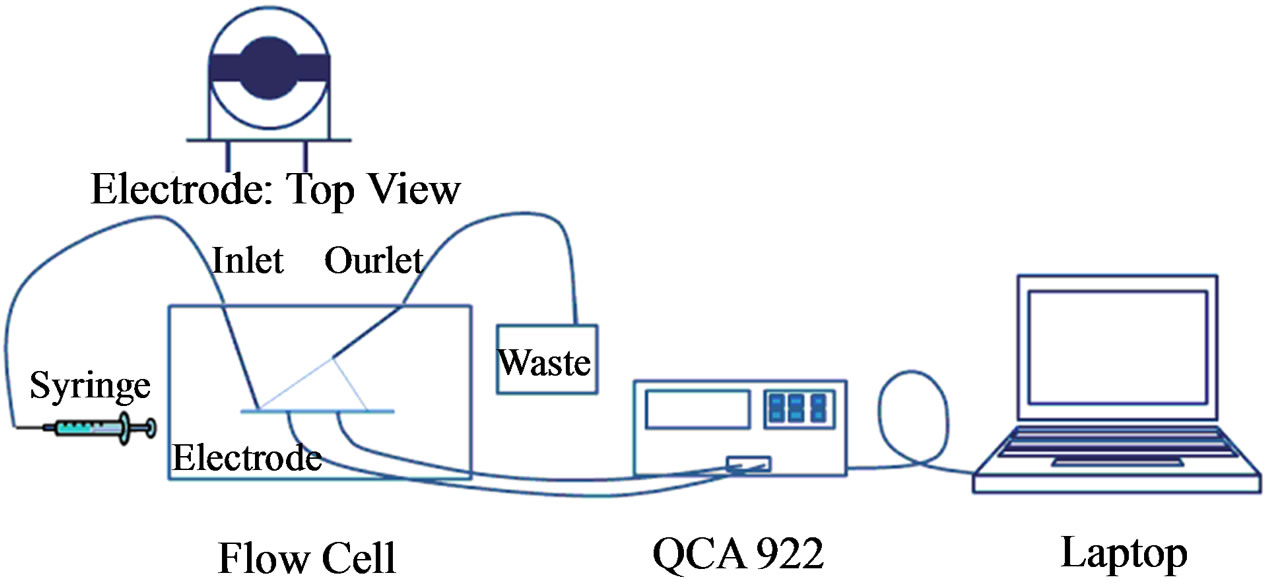
Figure 1. Schematic of the aptasensor. The biological sensing element is immobilized on the electrode surface. The quartz in the electrode acts as a transducer, converting the mass change to a frequency signal. The QCM processes and records all of the data.
Analyzer from Princeton Applied Research (Oak Ridge, TN) with the WinEchem software used to collect and plot the data. The leads of the QCM were connected to the electrode and frequency and resistance measurements were takenat 1 s intervals. All measurements were done in PBS at room temperature.
AT-cut quartz crystals (13.7 mm diameter) were obtained from International Crystal Manufacturing (Oklahoma City, OK). The crystals had a resonant frequency of 7.995 MHz, and its surface was polished with gold (5.1 mm diameter).
A flow cell from International Crystal Manufacturing (Oklahoma City, OK) was used for mounting the crystal electrode and holding the testing sample. The two flow cell pieces were screwed together to hold the electrode in place and was sealed with two O-rings. A 70 µl chamber was located above the polished gold surface for the injection of the testing samples.
2.4. Pretreatment and Aptamer Immobilization of Electrodes
The crystal’s electrodes were first cleaned by immersing them in 1 M NaOH for 20 min. Then a freshly prepared piranha solution (1:3 H2O2:H2SO4) was dropped on the gold surface for 1 min. Special care was taken to keep this solution away from the electrode leads. The electrodes were washed with deionized water and dried in a stream of nitrogen after each pretreatment. The crystal was then ready for installation into the flow cell.
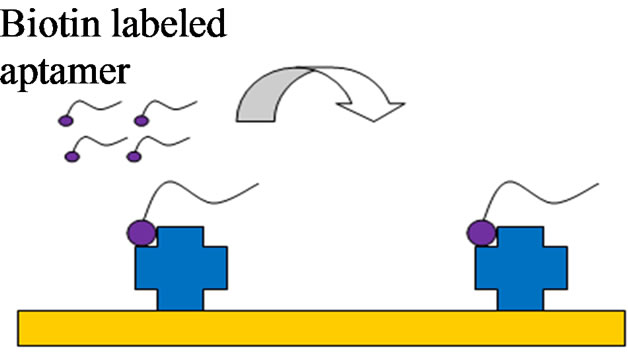
A schematic of the electrode pretreatment and aptamer immobilization is shown in Figures 2(a)-(c). PBS solution was first injected into the flow cell to provide a baseline measurement. Streptavidin (0.25 mg/ml) was then added to the flow cell for 30 min and allowed to bind to the electrode surface through protein adsorption. Biotin labeled H5N1 aptamer (1 µM) was injected into the flow cell and allowed to incubate for 15 min. Next, poly (ethylene glycol) methyl ether thiol (0.1 mg/ml) was added for 1 h to prevent any nonspecific binding to the
 (a)
(a)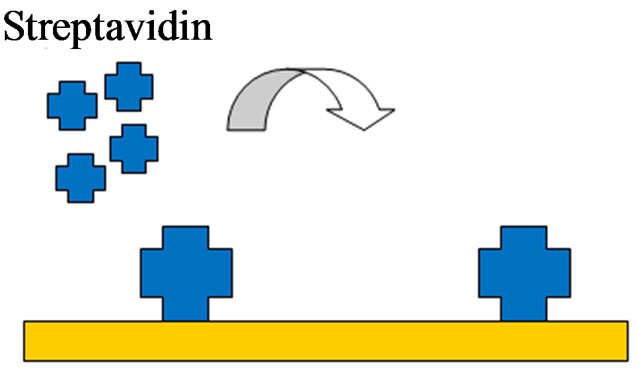 (b)
(b)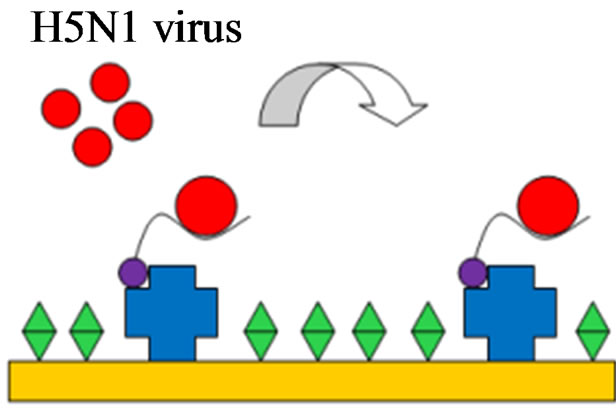 (c)
(c)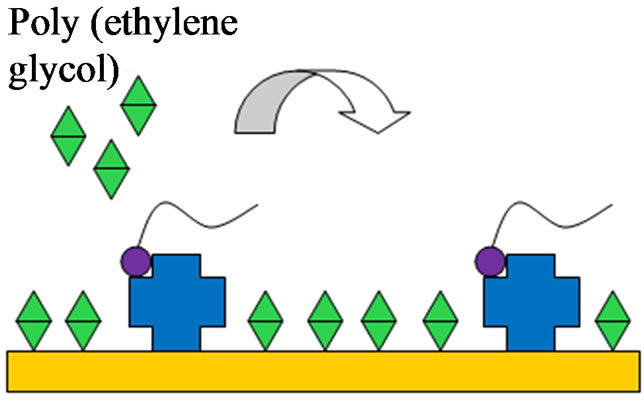 (d)
(d)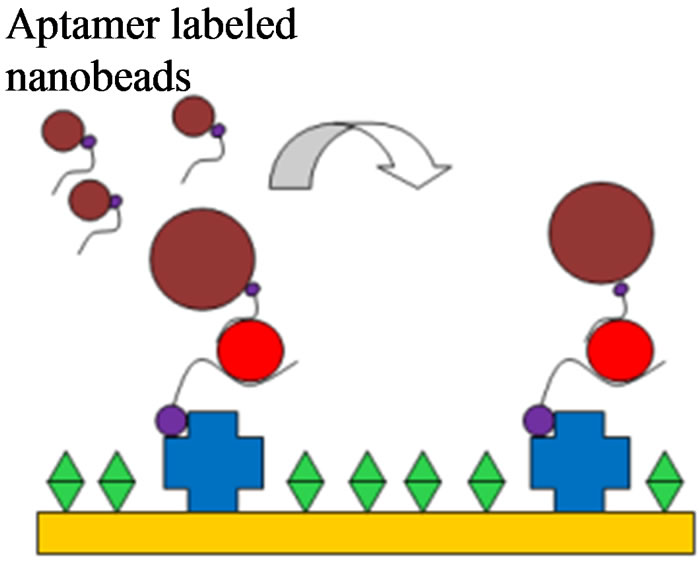 (e)
(e)
Figure 2. The electrode modification, virus detection and signal amplification of the aptasensor. (a) Streptavidin adsorption; (b) Aptamer immobilization by streptavidin binding; (c) PEG blocking of unbound sites; (d) Capturing of target H5N1 virus; (e) Amplification by nanobead labeling.
electrode surface.
2.5. Preparation of 150 nm Magnetic Nanobeads
MagCellect Streptavidin Ferrofluid nanobeads with a diameter of 150 nm were obtained from R&D systems (Minneapolis, MN) and used at stock concentration. The MagCellect Streptavidin Ferrofluid was a colloid of magnetic nanoparticles conjugated to streptavidin in solution containing Bovine Serum Albumin (BSA) and preservatives.
A 20 µl streptavidin coated nanobead solution was mixed with 200 µl of PBS and then a magnetic field at 0.8 T was applied for 2 min using a magnetic separator (AIBIT LLC., Jiangyin, China). The nanobeads were then resuspended in 100 µl of aptamers and 100 µl of PBS. The solution was rotated at 15 rpm for 30 min. Next, the nanobeads were suspended in 100 µl of PBS and 100 µl of biotin solution and rotated again for 10 min. After each step the magnetic separation and washing was repeated, resuspending the nanobeads in 200 µl of PBS.
2.6. Detection of AIV H5N1
Inactivated AIV H5N1 with titers in the range of 0.01 - 4 HAU/50 µl in PBS were added to the flow cell for capturing by the aptamer immobilized on the surface of QCM sensor and allowed to incubate for 30 min (Figure 2(d)). All uses of HAU refer to HAU/50 µl. Next, the aptamer coated nanobeads were injected into the flow cell for 30 min to allow binding to the captured virus (Figure 2(e)). Specificity tests were conducted using inactivatedAIV H7N2, H9N2, H5N9, H5N2, and H5N3 at 2 HAU. Triplicate tests were run for each of the titers of 0.01, 0.1, 1, 2 and 4 HAU and were used for determining the relationship between frequency change and virus concentration. The mean and standard deviation of frequency changes were calculated plotted using Microsoft Excel. The threshold for positive detection or lower detection limit was set as signal/noise ratio of 3 where the noise is defined as the standard deviation of the control sample.
2.7. ESEM Images
ESEM imaging was done using the Philips XL30 ESEM (Environmental Scanning Electron Microscope, FEI, Hillsboro, OR) to confirm the binding of nanobeads to the AIV H5N1. The ESEM samples were prepared by following the electrode modification protocol at 4 HAU followed by fixation with Karnovsky’s fixative and dehydration with ethanol.
3. Results and Discussion
3.1. Fabrication and Characterization of the QCM Aptasensor
Figure 2 shows the stepwise modification of the fabrication of the QCM biosensor, including target binding and signal amplification. Initial tests were run with no blocking agent prior to the addition of H5N1 virus and magnetic nanobeads. Negative control tests showed a significant amount of non-specific binding of the virus and nanobeads to the gold surface in the absence of aptamers. The first solution was to use Bovine Serum Albumin (BSA) to block the remaining free gold surface from any non-specific binding. However, this was found to also inhibit the capturing of the target virus by the aptamer, most likely due to the large size of BSA (≈ 12 nm) relative to the aptamer size (≈ 3 nm). Poly (ethylene glycol) methyl ether thiol (PEG) was then used due to its small size and strong blocking capabilities. PEG proved to be very effective for not only preventing non-specific binding to the gold surface but also not interfering with the aptamer’s ability to capture the target virus. Figure 3 shows a comparison of the two blocking agents. BSA blocking actually caused a decrease in mass after the addition of AIV H5N1virus at 4 HAU, most likely due to the BSA being washed away easily from the shear stress of the fluid flow. PEG clearly allows the aptamer to still capture the target virus. The target H5N1 virus was then added to the flow cell and would bind to the immobilized aptamer. Lastly, 150 nm magnetic nanobeads modified with the H5N1 aptamer were used as biolabels for further amplifying the mass of the virus particles. Each of these steps caused a decrease in the resonant frequency of the electrode due to an increase in mass. The net response from each step is determined by the difference in the corresponding PBS baselines.
Figure 4 shows a typical sensorgram of virus detection with the aptasensor. The adsorption of streptavidin to the gold surface along with the immobilization of the aptamer were both verified in real time by the decreases in frequency, 77 Hz and 46 Hz respectively. PEG required a long binding time of 1 h in order to completely block the remaining electrode surface and further decreased the frequency by 2 Hz. Following the blocking step, the target virus was captured by the aptamer and caused a 44 Hz decrease in frequency. Lastly, nanobead amplification further increased the frequency change by 10 Hz by binding to the H5N1 virus. Each step was followed by a PBS washing step to wash away any unbound materials and to create a stable baseline prior to the next injection.
3.2. Detection of AI H5N1 Virus
The total detection time for the detection of virus and
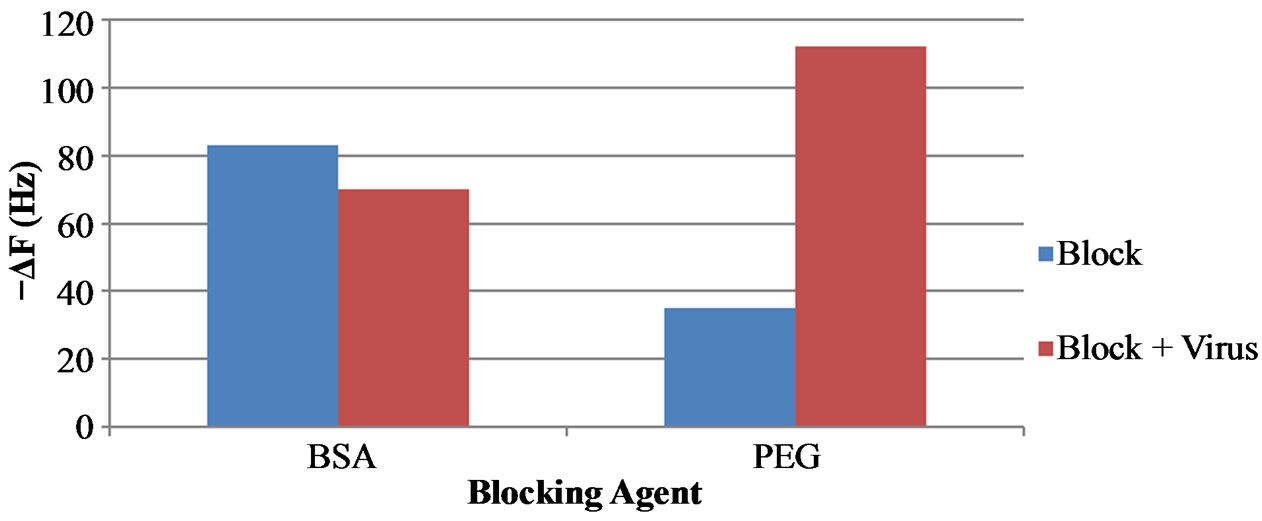
Figure 3. Frequency shifts of the QCM aptasensor comparing BSA and PEG blocking agents for AIV H5N1.
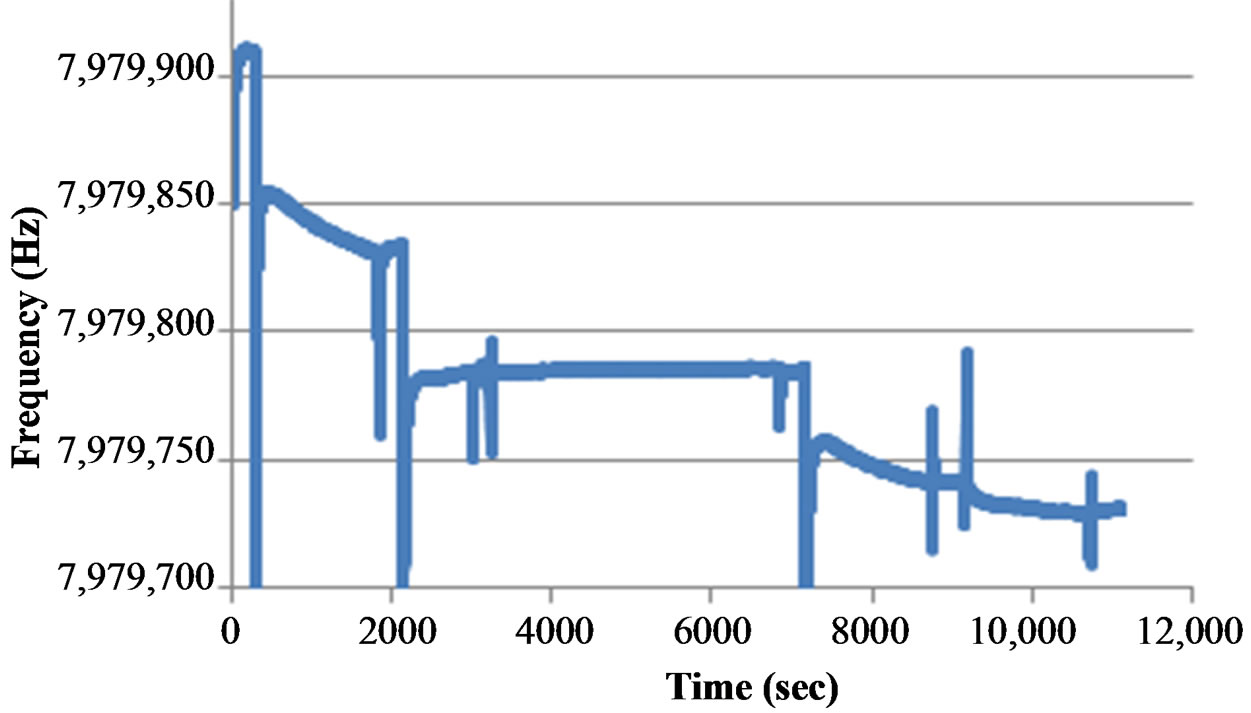
Figure 4. Typical sensorgram of the QCM aptasensor for surface modification, aptamer immobilization, target AIV detection and signal amplification with nanobeads. The concentration of AIV H5N1 was 1 HA in this test.
amplification with nanobeads is 1 h for this sensor. The detection signal was the change in frequency of the PBS baselines due to the addition of the virus and nanobeads and the results can be seen in Figure 5. The detection limit of this sensor was determined to be 1 HAU. Using the same calculation method, the detection limit of the biosensor was also 1 HAU for H5N1 detection without nanobead amplification.
Compared to the QCM immunosensor reported by Li et al. [17], the aptamer seemed to be much more effective in the capturing virus than the more commonly used antibody. Not only was the magnitude of the frequency change higher for each respective titer, but the aptamer also cut the detection time in half compared to antibody tests. Also, the aptamers did not require chemical immobilization which is time consuming and material intensive. However, the aptamer coated nanobeads were not as effective as a mass amplifier as hoped. While they did slightly increase the sensitivity of the biosensor, this was not enough to lower the detection limit from the pure virus detection limit. It should be noted that as the titer concentration lowered, the beadamplification became more and more significant. At 0.1 and 0.01 HAU the nanobeads more than doubled the frequency change due to the capture of AIV H5N1. Unfortunately, this was still below the lower detection limit of the aptasensor. If the noise level could be lowered by further reducing nonspecific binding of nanobeads the aptasensor would prove to be even more sensitive. A possible explanation for the failure of the nanobead amplification could be the nonrigid structure of the AIV/nanobead complex. The QCM is much more sensitive to rigid structures compared to elastic ones. Antibodies provide a more rigid structure and can bind to multiple virus particles as well while aptamers are more flexible and only have one binding site. While aptamers are still great for very specific virus detection, they are not as strong when it comes to nanobead amplification because of the elasticity of their structure.
Figure 6 shows an SEM image of the top of the QCM electrode surface. The image confirms the capturing of the target H5N1 virus by the aptamer and also the binding of the 150 nm magnetic nanobead to the virus.
3.3. Specificity of the Aptasensor
The immunosensor was evaluated for specificity with five different subtypes of avian influenza viruses using the same procedure described previously. These non-target viruses were chosen due to the similar properties of their HA and NA proteins. Figure 7 shows the frequency change due to the addition of each non-target virus at a concentration of 2 HAU. While AIV H5N1 made 65 Hz of frequency change, none of the five non-target subtypes caused more than 8 Hz of frequency change, which is well below the lower detection limit of 18 Hz frequency change. The results proved a high specificity of the aptasensor to the target AIV H5N1.
4. Conclusion
The results of this study showed that the aptamer not only increased the sensitivity of the aptasensor to the target virus but also reduced the detection time. A detection limit of 1 HAU was determined. Unfortunately, the nanobead amplification proved to be insignificant by not amplifying the frequency change enough to lower the detec-
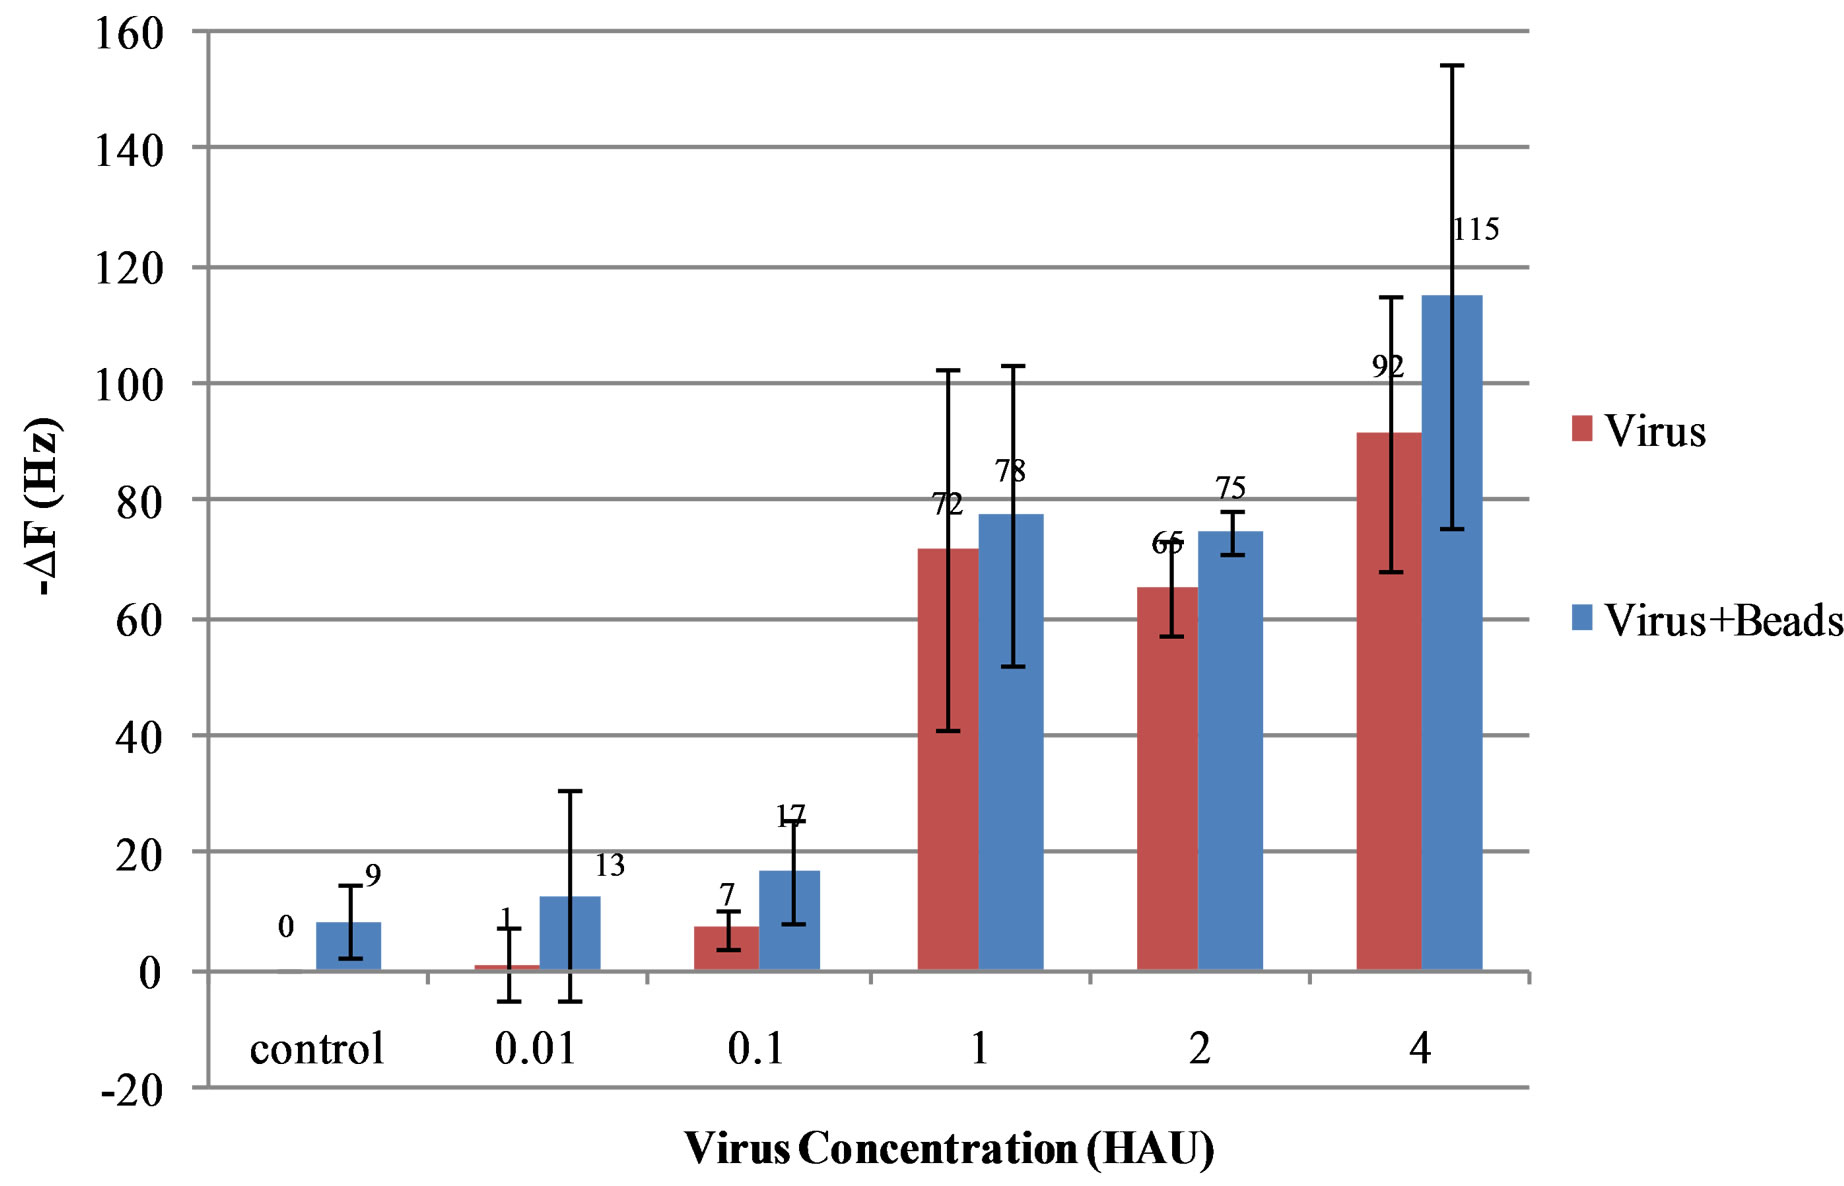
Figure 5. Frequency shifts of the QCM biosensor as a function of the titer (HAU) of AI H5N1 virus in PBS solution. The detection limit is determined as 1 HAU. Error bars indicate the standard deviation (n = 3).

Figure 6. SEM image of the top view of the QCM surface. Confirmation of the binding of a magnetic nanobead with a 150 nm diameter to a target H5N1 virus (80 nm diameter).
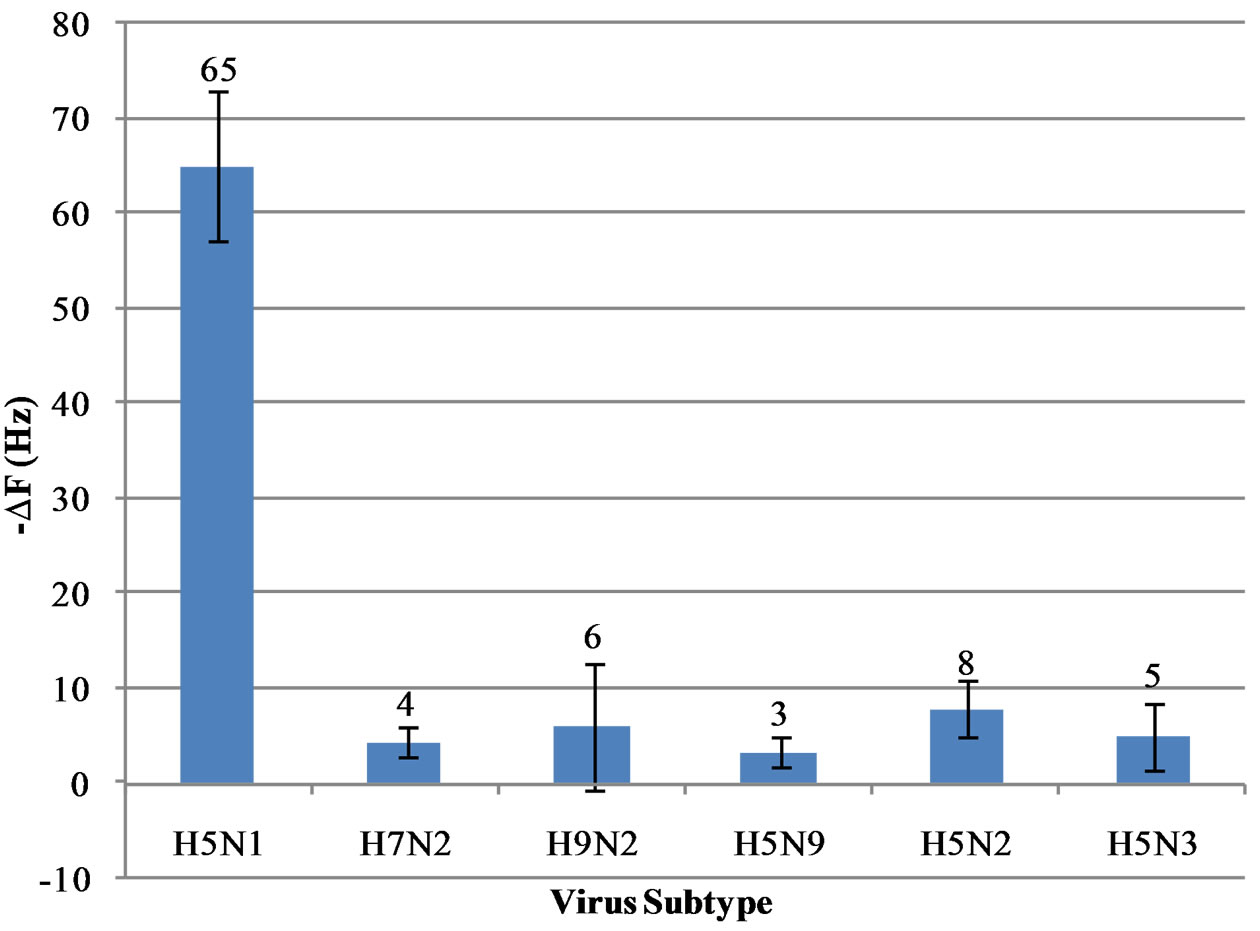
Figure 7. Frequency shifts of the QCM aptasensor for the target AIV H5N1 virus along with the five non-target AIV subtypes at 2 HAU. Error bars indicate standard deviation (n = 3).
tion limit. If the noise level could be reduced, the sensor’s sensitivity could be greatly increased. While the detection limit of this aptasensor was very similar to previous studies (1 HAU), it has the advantage of being specific to the H5N1 virus rather than just the H5 protein. The aptasensor was proven to have no non-specific binding to similar non-target AIV subtypes. The detection time of the aptasensor was also greatly reduced down to 1 h.
5. Acknowledgements
This research was supported in part by ABI. The authors thank Dr. Huaguang Lu, Animal Diagnostic Laboratory at Penn State University, for providing inactivated viruses and Lisa Kelso, Department of Poultry Science at University of Arkansas, for her help in SEM imaging.
REFERENCES
- WHO (World Health Organization), 2013. http://www.who.int/influenza/human_animal_interface/EN_GIP_20121217CumulativeNumberH5N1cases.pdf
- A. Burns, D. van der Mensbrugghe and H. Timmer, “Evaluating the Economic Consequences of Avian Influenza,” World Bank Report, 2008. http://siteresources.worldbank.org/EXTAVIANFLU/Resources/EvaluatingAHIeconomics_2008.pdf
- B. Charlton, B. Crossley and S. Hietala, “Conventional and Future Diagnostics for Avian Influenza,” Comparative Immunology Microbiology and Infectious Diseases, Vol. 32, No. 4, 2009, pp. 341-350. http://dx.doi.org/10.1016/j.cimid.2008.01.009
- J. S. Ellis and M. C. Zambon, “Molecular Diagnosis of Influenza,” Reviews in Medical Virology, Vol. 12, No. 6, 2002, pp. 375-389. http://dx.doi.org/10.1002/rmv.370
- Y. Amano and Q. Cheng, “Detection of Influenza Virus: Traditional Approaches and Development of Biosensors,” Analytical and Bioanalytical Chemistry, Vol. 381, No. 1, 2005, pp. 156-164. http://dx.doi.org/10.1007/s00216-004-2927-0
- C. Estmer-Nilsson, S. Abbas, M. Bennemo, A. Larsson, M. D. Hämäläinen and Å. Frostell-Karlsson, “A Novel Assay for Influenza Virus Quantification Using Surface Plasmon Resonance,” Vaccine, Vol. 28, No. 3, 2010, pp. 759-766. http://dx.doi.org/10.1016/j.vaccine.2009.10.070
- H. Bai, R. Wang, B. Hargis, H. Lu and Y. Li, “A SPR Aptasensor for Detection of Avian Influenza Virus H5N1,” Sensors, Vol. 12, No. 9, 2012, pp. 12506-12518. http://dx.doi.org/10.3390/s120912506
- J. Xu, D. Suarez and D. S. Gottfried, “Detection of Avian Influenza Virus Using an Interferometric Biosensor,” Analytical and Bioanalytical Chemistry, Vol. 389, No. 1, 2007, pp. 1193-1199. http://dx.doi.org/10.1007/s00216-007-1525-3
- R. Wang, Y. Wang, K. Lassiter, Y. Li, B. Hargis, S. Tung, et al., “Interdigitated Array Microelectrode Based Impedance Immunosensor for the Detection of Avian Influenza Virus HN1,” Talanta, Vol. 79, No. 2, 2009, pp. 159- 164. http://dx.doi.org/10.1016/j.talanta.2009.03.017
- J. Lum, R. Wang, K. Lassiter, B. Srinivasan, D. Abi-Ghanem, L. Berghman, et al., “Rapid Detection of Avian Influenza H5N1 Virus Using Impedance Measurement of Immuno-Reaction Coupled with RBC Amplification,” Biosensors and Bioelectronics, Vol. 38, 2012, pp. 67-73. http://dx.doi.org/10.1016/j.bios.2012.04.047
- D. Ivnitski, I. Abdel-Hamid, P. Atanasov and E. Wilkins, “Biosensors for Detection of Pathogenic Bacteria,” Biosensors and Bioelectronics, Vol. 14, 1999, pp. 599-624. http://dx.doi.org/10.1016/S0956-5663(99)00039-1
- A. J. Bard and L. R. Faulkner, “Electrochemical Methods: Fundamentals and Applications,” 2nd Edition, John Wiley & Sons, New York, 2001.
- G. Sauerbrey, “Verwendung von Schwingquarzen zur Wä- gung Dünner Schichten und Zur Mikorwägung,” Zeitschrift für Physik, Vol. 155, 1959, pp. 206-222.
- K. K. Kanazawa and J. G. Gordon, “The Oscillation Frequency of a Quartz Resonator in Contact with Liquid,” Analytica Chemica Acta, Vol. 175, 1985, pp. 99-105.
- F. Liu, Y. Li, X. Su, M. F. Slavik, Y. Ying and J. Wang, “QCM Immunosensor with Nanoparticle Amplification for Detection of Escherichia coli O157:H7,” Sensing and Instrumentation for Food Quality, Vol. 1, 2007, pp. 161- 168. http://dx.doi.org/10.1007/s11694-007-9021-1
- T. M. P. Hewa, G. A. Tannock, D. E. Mainwaring, S. Harrison and J. V. Fecondo, “The Detection of Influenza A and B Viruses in Clinical Specimens Using a Quartz Crystal Microbalance,” Journal of Virological Methods, Vol. 162, No. 1-2, 2009, pp. 14-21.
- D. Li, J. Wang, R. Wang, Y. Li, D. Abi-Ghanem, L. Berghman, B. Hargis and H. Lu, “A Nanobeads Amplified QCM Immunosensor for the Detection of Avian Influenza Virus H5N1,” Biosensors and Bioelectronics, Vol. 26, 2011, pp. 4146-4154. http://dx.doi.org/10.1016/j.bios.2011.04.010
- T. W. Owen, R. O. Al-Kaysi, C. J. Bardeen and Q. Cheng, “Microgravimetric Immunosensor for Direct Detection of Aerosolized Influenza A Virus Particles,” Sensors and Actuators B, Vol. 126, 2007, pp. 691-699. http://dx.doi.org/10.1016/j.snb.2007.04.028
- R. Wang and Y. Li, “Hydrogel Based QCM Aptasensor for Detection of Avian Influenza Virus,” Biosensors and Bioelectronics, Vol. 42, 2013, pp. 148-155. http://dx.doi.org/10.1016/j.bios.2012.10.038
- S. D. Jayasena, “Aptamers: An Emerging Class of Molecules that Rival Antibodies in Diagnostics,” Clinical Chemistry, Vol. 45, No. 9, 1999, pp. 1628-1650.
- C. Tuerk and L. Gold, “Systematic Evolution of Ligands by Exponential Enrichment: RNA Ligands to Bacteriophage T4 DNA Polymerase,” Science, Vol. 249, No. 4968, 1990, pp. 505-510. http://dx.doi.org/10.1126/science.2200121
- A. D. Ellington and J. W. Szostak, “In Vitro Selection of RNA Molecules that Bind Specific Ligands,” Nature, Vol. 346, No. 6287, 1990, pp. 818-822. http://dx.doi.org/10.1038/346818a0
- R. D. Jenison, S. C. Gill, A. Pardi and B. Polisky, “HighResolution Molecular Discrimination by RNA,” Science, Vol. 263, No. 5152, 1994, pp. 1425-1429. http://dx.doi.org/10.1126/science.7510417
- K. Sefah, J. A. Phillips, X. Xiong, L. Meng, D. Van Simaeys, H. Chen, et al., “Nucleic Acid Aptamers for Biosensors and Bio-Analytical Applications,” Analyst, Vol. 134, 2009, pp. 1765-1775. http://dx.doi.org/10.1039/b905609m
- Z. Cui, Q. Ren, H. Wei, Z. Chen, J. Deng, Z. Zhang, et al., “Quantum Dot-Aptamer Nanoprobes for Recognizing and Labeling Influenza A Virus Particles,” Nanoscale, Vol. 3, 2011, pp. 2454-2457. http://dx.doi.org/10.1039/c1nr10218d
NOTES
*Corresponding author.